Analysis of heavy_metal_content_in_conventional_an
SGSLSS_Migration_WONG_Poster_2014
1. INTRODUCTION
Although food and drug packaging is commonly printed with colorful labels, there is limited knowledge about the potential migration of printed ink components into the products.
With no global legislation available and ill-defined terminology in the scientific community, formulating ink used in packaging becomes a challenge for suppliers and users who are con-
cerned with potential migration of harmful components. Possible sources of migratable compounds in inks and coatings include UV photo-initiators, mineral oils, and resins. No single
analytical method can detect all components in the inks due to the complexity of the compositions and solubility of individual components. Hence, the aim of this study is to apply the
most effective methodologies using minimal extraction, combined with instrumental analysis, to determine the amount of ink components potentially migrating into the contact adhe-
sive layer of a transdermal patch with printing directly on it. The instrumental analytical tests include GC-FID/MS for volatile compounds (benzyl alcohol as ink reducer), UPLC-DAD/MS
for non-volatile compounds (polyamide, photo-initiators and their decomposition products) and ICP-OES for metal analysis (D&C Red as color dye).
In this study, the calibration curves showed linearity in the range of 0.6 - 5.0 µg/mL, 0.3 - 3.0 µg/mL and 0.3 - 2.0 µg/mL for all GC-FID/MS, UPLC-DAD/MS and ICP-OES, respectively
with r2
no less than 0.998 for all three instrumental analyses. The limits of detection and the recoveries of individual ink components from extraction samples were 0.2 µg/mL and 89-
102%, respectively. The proposed methods would be useful for the quantification of ink migration from the transdermal patch.
OBJECTIVES
The objective of this study was to evaluate the materials, transdermal patches with printed labels, for an extractable profile by quantitative analysis. It also describes the experimental
strategy for the extraction and investigation of the potential migration of ink from backing print to adhesive layer under aggressive and exaggerated conditions.
CHALLENGES
1. Sample matrices were co-eluted with target volatile compounds.
2. Polyamide does not contain a chromophore.
3. No direct method for quantifying color dye.
MATERIALS & METHODS
Test Article:
Unprinted Patches stored at controlled room temperature (CRT) as negative control and spiked recovery study; and Printed Patches stored at 40°C/75%RH for 6 months as sample.
Sample Preparation:
Three (3) adhesive layers of each test article were separated from the backing films of the patches and transferred into the same scintillation vial with 20 mL of methanol for solvent
extraction. Then, the scintillation vial was capped and sonicated for 20 minutes. The extraction solvent was used “as is” for LC and GC instrumental analysis, while the extraction sol-
vent was digested with concentrated sulphuric acid and nitric acid before ICP testing.
Gas Chromatography (GC-FID/MS) Parameters:
Instrument: Agilent 6890
Column: Agilent DB-1 (30 m x 0.32 mm x 3.0 µm)
Temperature Program: Start at 40°C, Hold 5.0 min.
Ramp at 15°C/min. to 170°C,
Ramp at 20°C/min. to 280°C, Hold 10.0 min.
Carrier Gas: Helium
Carrier Gas Flow: 2.0 mL/min.
Injector Temperature: 280°C
Injector: Split ratio (1:1)
Injection Volume: 2.0 µL
Flame Ionization Detector (FID)
Detection Temperature: 300°C
Air Flow: 350 mL/min.
Hydrogen Flow: 45 mL/min.
Make-Up Gas Flow: 5 mL/min. Helium
Mass Spectrometry (MS)
Mass Spectrometer: Agilent 5973 Network
Ion Mode: EI+
Scan Range: 29-800 m/z
Source Temperature: 200°C
Liquid Chromatography (LC-DAD/MS) Parameters:
Waters UPLC system with PDA detector and Micromass Quattro micro Mass Spectrometer with Electrospray Ionization source.
WATERS LC-MS ACQUISITION PARAMETERS
RESULTS AND DISCUSSION
GC-MS was used to quantify benzyl alcohol due to sample matrices interference and GC-FID was used to quantify isopropyl alcohol. The detection limit for the method is 0.2 µg/mL
and the spiked recovery is 102% for benzyl alcohol. The results were summarized in Table 1 and the overlay chromatograms for Isopropyl Alcohol and Benzyl Alcohol were shown in
Figure 1 and 2, respectively.
MIGRATION OF INK COMPONENTS INTO TRANSDERMAL PATCHES
KENNETH WONG, XINJIE SONG, TERRY PANETTA, GAYATRI TRIVEDI, AND THERESA BURCHFIELD
SGS LIFE SCIENCE SERVICES, FAIRFIELD, NJ, USA
Column Waters Acquity BEH C4, 1.7 µm, 2.1 x 50 mm
Column Temp 40°C
Sampler temp 15°C
Injection Volume 10 µL
Mobile Phase A 0.1% (v/v) Formic acid in water
Mobile Phase B Acetonitrile
UV/Vis Range(nm) Scan range 200 – 400 nm
MS PARAMETERS:
Ionization Mode ESI positive
Source Temp 140°C
Cone 30 V
Resolution 10.0 and 15.0
Mass Range (SIR) 587.9 m/z
Desolvation Temp 450°C
Multiplier 650 V
CONCLUSION
An efficient technique was introduced to extract extractables components from the patch for instrumental analysis.
The sensitivity methods for GC-FID/MS, UPLC-DAS/MS and ICP-OES were developed for analysis of benzyl alcohol and isopropyl alcohol, polyamide and metallic elements (Calcium),
respectively.
ACKNOWLEDGEMENT
Thanks to Dr. Richard Bunnell, Theresa Burchfield and Pamela Drinkard for their valuable advice and assistance in reviewing this document.
REFERENCE
1. Dennis Jenke (2009). Compatibility of Pharmaceutical Solutions and Contact Materials: Safety Assessments of Extractables and Leachables for Pharmaceutical Products.
Hoboken, NJ: Wiley.
2. John C. Tran, Alan A. Doucette; Journal of the American Society for Mass Spectrometry Volume 17, Issue 5, May 2006, Pages 652-656.
3. Burrell, M.C., Chao, H.S.-I, Meerman, T.P, Peterson, G.S; Surface and Interface Analysis Volume 25, Issue 10, September 1997, Pages 799-803.
TIME
(MINUTES)
TIME
(MINUTES)
MOBILE %A MOBILE %B
0.0 0.3 60 40
3.0 0.3 20 80
10.0 0.3 20 80
10.2 0.3 60 40
12.0 0.3 60 40
LC-MS GRADIENT
Inductively coupled plasma (ICP-OES) Testing Parameters:
Instrument: Agilent 720 ICP equipped with an optical emission
Plasma Flow: 15.0 L/min
Auxiliary Flow: 1.50 L/min
Nebulizer Flow: 0.75 L/min
Power: 1000 W
Carrier Gas: Argon
Measurement time: 45 seconds
Replicates: 3
SAMPLE DESCRIPTION
BENZYL ALCOHOL ISOPROPYL ALCOHOL
CONCENTRATION
(μg/mL)
AMOUNT
(μg/PATCH) 2
CONCENTRATION
(μg/mL)
AMOUNT
(μg/PATCH)3
Unprinted Patches stored at
controlled room temperature
0.65 4.4 < LOD 1
< 1.4
Printed Patches stored at
40°C/75%RH for 6 months
1.29 8.6 < LOD 1
< 1.4
Notes:
1 LOD (0.2 µg/mL); LOQ (0.6 ppm)
2 Calculation based on 20 mL extraction solvent and 3 patches were used (conc. µg/mL x 20 mL / 3 patches)
3 Calculation based on 20 mL extraction solvent and 3 patches were used (0.2 µg/mL x 20 mL / 3 patches)
TABLE 1: GC-MS RESULTS FOR EXTRACT SAMPLES FIGURE 1: GC-FID CHROMATOGRAM FOR STANDARD AND SAMPLES
(ISOPROPYL ALCOHOL)
Notes:
A: Printed Patches stored at 40°C/75%RH for 6 months; <LOD (0.2 ppm) Isopropyl Alcohol
B: Unprinted Patches stored at controlled room temperature: <LOD (0.2 ppm) Isopropyl Alcohol
FIGURE 2: GC-MS CHROMATOGRAM FOR STANDARD AND SAMPLES
(BENZYL ALCOHOL)
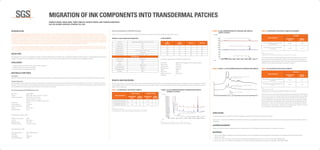
UPLC-MS was used to quantify polyamide due to lack of chromophores. The limit of de-
tection (LOD) and limit of quantification (LOQ) for the method is 0.1 and 0.3 µg/mL, re-
spectively and the spiked recovery is 89% for polyamide. The results were summarized
in Table 2 and the overlay chromatogram was shown in Figure 3.
SAMPLE DESCRIPTION
POLYAMIDE
CONCENTRATION
(μg/mL)
AMOUNT
(μg/PATCH) 2
Unprinted Patches stored at controlled
room temperature
< LOQ 1
< 2.0
Printed Patches stored at 40°C/75%RH
for 6 months
< LOQ 1
< 2.0
TABLE 2: LC-MS RESULTS FOR EXTRACT SAMPLES (POLYAMIDE)
Notes:
1 LOD (0.1 µg/mL); LOQ (0.3 µg/mL)
2 Calculation based on 20 mL extraction solvent and 3 patches were used (0.3 µg/mL x 20 mL / 3 patches)
FIGURE 3: FIGURE 3: LC-MS CHROMATOGRAM FOR STANDARD AND SAMPLES TABLE 3: ICP-OES RESULTS FOR EXTRACT SAMPLES
ICP-OES was used to quantify the calcium (Ca) element as represented for D&C Red col-
or dye. A known amount (~ 100 µg) of D&C Red color dye was prepared in concentrated
nitric acid and sulphuric acid. The percentage recovery was 94% for Ca (D&C Red color
dye). Since D&C Red color dye contains calcium (Ca) element, the result demonstrated
that the stoichiometric ratio between calcium (Ca) element and the D&C Red color dye
compound is 1:1 ratio. The limit of detection (LOD) and limit of quantification (LOQ) for
the method is 0.1 and 0.3 µg/mL, respectively. The spiked recovery was 97% for the cal-
cium (Ca) element. The results were summarized in Table 3.
SAMPLE DESCRIPTION
CALCIUM (Ca)
CONCENTRATION
(μg/mL)
AMOUNT
(μg/PATCH) 2
Unprinted Patches stored at controlled room
temperature
< LOD 1
< 0.7 2
Printed Patches stored at 40°C/75%RH for 6
months
< LOQ 1
< 2.0 3
Notes:
1 LOD (0.1 µg/mL); LOQ (0.3 µg/mL)
2 Calculation based on 20 mL extraction solvent and 3 patches were used (0.1 µg/mL x 20 mL / 3 patches)
3 Calculation based on 20 mL extraction solvent and 3 patches were used (0.3 µg/mL x 20 mL / 3 patches)
LOQ (0.6 ppm) Isopropyl Alcohol Polyamide
B
A
Unprinted Patches stored at controlled room temperature Polyamide
Printed Patches stored at 40°C/75%RH for 6 months
LOQ (0.6 ppm) Benzyl Alcohol Polyamide
Printed Patches stored at 40°C/75%RH for 6 months
< LOQ (0.3 ppm) Polyamide
Unprinted Patches stored at controlled room temperature
< LOQ (0.3 ppm) Polyamide
LOQ (0.3 ppm) Polyamide