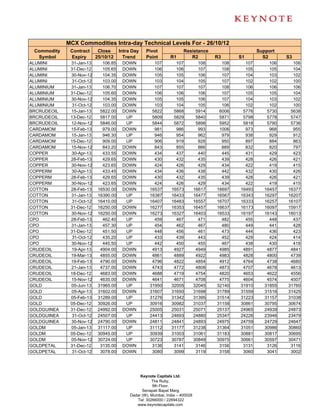
2. MCX Commodities Intra-day Technical Levels For - 26/10/12
Commodity Contract Close Intra Day Pivot Resistance Support
Symbol Expiry 25/10/12 Trend Point R1 R2 R3 S1 S2 S3
GOLDPETAL 30-Nov-12 3114.00 DOWN 3116 3121 3128 3140 3109 3104 3092
GOLDPTLDEL 30-Nov-12 3141.00 DOWN 3145 3169 3196 3247 3118 3094 3043
GOLDPTLDEL 31-Dec-12 3157.00 DOWN 3174 3205 3254 3334 3125 3094 3014
GOLDPTLDEL 31-Oct-12 3161.00 UP 3152 3195 3228 3304 3119 3076 3000
KAPAS 30-Mar-13 970.60 DOWN 971 980 989 1008 961 952 933
KAPAS 30-Apr-13 995.90 UP 996 1005 1014 1033 986 977 958
KAPASKHALI 28-Feb-13 1468.00 UP 1466 1477 1485 1504 1458 1447 1428
KAPASKHALI 31-Jan-13 1449.50 UP 1448 1458 1466 1483 1440 1431 1413
KAPASKHALI 31-Dec-12 1439.50 UP 1439 1447 1455 1471 1431 1423 1407
LEAD 31-Jan-13 109.45 DOWN 110 110 111 112 109 109 108
LEAD 31-Dec-12 109.15 DOWN 109 110 110 112 109 108 107
LEAD 30-Nov-12 108.80 DOWN 109 110 110 111 108 108 107
LEAD 31-Oct-12 108.40 DOWN 109 109 110 111 108 107 106
LEADMINI 31-Jan-13 109.60 DOWN 110 110 111 111 109 109 108
LEADMINI 31-Dec-12 109.20 DOWN 109 110 110 111 109 108 107
LEADMINI 30-Nov-12 108.85 DOWN 109 110 110 112 108 108 107
LEADMINI 31-Oct-12 108.40 DOWN 109 109 110 111 108 107 106
MENTHAOIL 31-Jan-13 1177.90 UP 1177 1186 1194 1211 1169 1160 1142
MENTHAOIL 31-Dec-12 1177.00 UP 1173 1184 1191 1210 1166 1154 1136
MENTHAOIL 30-Nov-12 1165.70 UP 1163 1171 1177 1191 1158 1149 1135
MENTHAOIL 31-Oct-12 1151.40 UP 1148 1158 1165 1181 1142 1132 1115
NATURALGAS 26-Dec-12 212.40 UP 212 215 217 222 210 207 202
NATURALGAS 27-Nov-12 204.50 UP 204 207 210 215 201 198 193
NATURALGAS 26-Oct-12 184.40 UP 184 187 190 196 181 178 172
NICKEL 31-Jan-13 899.50 DOWN 904 911 922 940 893 886 868
NICKEL 31-Dec-12 890.90 DOWN 895 903 914 933 884 877 858
NICKEL 30-Nov-12 879.60 DOWN 885 892 905 925 872 865 845
NICKEL 31-Oct-12 868.70 DOWN 875 882 896 917 861 854 833
NICKELM 31-Jan-13 900.40 DOWN 904 911 922 939 894 887 869
NICKELM 31-Dec-12 890.50 DOWN 895 903 915 935 883 876 856
NICKELM 30-Nov-12 879.80 DOWN 885 892 905 925 872 865 845
NICKELM 31-Oct-12 868.80 DOWN 875 883 896 918 861 853 832
POTATO 15-May-13 730.80 UP 730 735 739 747 726 722 713
POTATO 15-Mar-13 734.40 DOWN 735 738 742 749 731 727 720
POTATO 15-Apr-13 704.50 UP 704 706 707 710 703 702 699
SILVER 04-May-13 62862.00 UP 62831 63057 63252 63673 62636 62410 61989
SILVER 05-Mar-13 61303.00 UP 61233 61527 61750 62267 61010 60716 60199
SILVER 05-Dec-12 59449.00 UP 59407 59662 59876 60345 59193 58938 58469
SILVER1000 31-Oct-12 59026.00 UP 59010 59216 59405 59800 58821 58615 58220
SILVER1000 30-Nov-12 59406.00 DOWN 59419 59587 59769 60119 59237 59069 58719
SILVERM 30-Apr-13 62808.00 DOWN 62815 62999 63191 63567 62623 62439 62063
SILVERM 28-Feb-13 61324.00 UP 61277 61519 61714 62151 61082 60840 60403
SILVERM 30-Nov-12 59469.00 UP 59406 59704 59939 60472 59171 58873 58340
SILVERMIC 30-Apr-13 62861.00 UP 62794 63087 63314 63834 62567 62274 61754
SILVERMIC 28-Feb-13 61310.00 UP 61243 61542 61774 62305 61011 60712 60181
SILVERMIC 30-Nov-12 59474.00 UP 59405 59709 59945 60485 59169 58865 58325
Keynote Capitals Ltd.
The Ruby,
9th Floor,
Senapati Bapat Marg,
Dadar (W), Mumbai, India – 400028
Tel: 30266000 / 22694322
www.keynotecapitals.com
3. MCX Commodities Intra-day Technical Levels For - 26/10/12
Commodity Contract Close Intra Day Pivot Resistance Support
Symbol Expiry 25/10/12 Trend Point R1 R2 R3 S1 S2 S3
STEELRPR 18-Jan-13 31540.00 UP 31493 31697 31853 32213 31337 31133 30773
STEELRPR 20-Dec-12 31320.00 UP 31237 31493 31667 32097 31063 30807 30377
ZINC 31-Jan-13 102.35 DOWN 102 103 103 104 102 101 100
ZINC 31-Dec-12 100.55 DOWN 101 101 102 104 100 99 98
ZINC 30-Nov-12 99.00 DOWN 99 100 101 103 98 98 96
ZINC 31-Oct-12 97.30 DOWN 98 98 100 101 97 96 94
ZINCMINI 31-Jan-13 101.80 DOWN 102 103 103 105 101 101 100
ZINCMINI 31-Dec-12 100.45 DOWN 101 101 103 104 100 99 98
ZINCMINI 30-Nov-12 99.00 DOWN 99 100 101 103 98 98 96
ZINCMINI 31-Oct-12 97.30 DOWN 98 98 100 101 97 96 94
Sanjay Bhatia (AVP – Technical Research),
Email Id sanjay@keynotecapitals.net
Pivot Point: Intra- Day Trading Tool. - The key to the use of this tool is the use of Stop Loss
Intra Day Trend: It is valid only till the point where Price trades above Pivot Point. For Eg. “UP” would be valid till Price
remains above Pivot Point. It would become “DOWN” in event Price trades below Pivot Point.
Pivot Point (PP): This is a trigger point for Intra Day Buy / Sell based on the price range of the previous day.
R1: Resistance 1: 1st Resistance level over Pivot Point, R2: Resistance 2: Next Resistance level after R1.
R3: Resistance 3: Next Resistance level after R2.
S1: Support 1: 1st Support level after Pivot Point, S2: Support 2: Next Support level after S1.
S3: Support 3: Next Support level after S2.
Note: As per this tool, the trader should take BUY position just above the Pivot Point and keep the Pivot Point level as stop
loss and the first target would be R1 level (Resistance 1). If R1 is crossed then R2 (Resistance 2) becomes the next target
with the stop loss placed at R1 level. If R2 is crossed then R3 (Resistance 3) becomes the next target with the stop loss
placed at R2 level.
Similarly if price goes below the Pivot Point the trader should take a SELL position and keep the Pivot Point level as the
stop loss and the first target would be S1 level (Support 1). If S1 level is breached then S2 level (Support 2) becomes the
next target with the stop loss placed at S1 level. If S2 level is breached then S3 level (Support 3) becomes the next target
with the stop loss placed at S2 level.
Disclaimer: This document is not for public distribution and has been furnished to you solely for your information and must not be reproduced or
redistributed to any other person. Persons into whose possession this document may come are required to observe these restrictions. This material is
for the personal information of the authorized recipient, and we are not soliciting any action based upon it. This report is not to be construed as an offer
to sell or the solicitation of an offer to buy any security in any jurisdiction where such an offer or solicitation would be illegal. It is for the general
information of clients of Keynote Capitals Ltd. It does not constitute a personal recommendation or take into account the particular investment
objectives, financial situations, or needs of individual clients. We have reviewed the report, and in so far as it includes current or historical information,
it is believed to be reliable though its accuracy or completeness cannot be guaranteed. Neither Keynote Capitals Ltd., nor any person connected with
it, accepts any liability arising from the use of this document. The recipients of this material should rely on their own investigations and take their own
professional advice. Price and value of the investments referred to in this material may go up or down. Past performance is not a guide for future
performance. Certain transactions -including those involving futures, options and other derivatives as well as non-investment grade securities - involve
substantial risk and are not suitable for all investors. Reports based on technical analysis centers on studying charts of a stock’s price movement and
trading volume, as opposed to focusing on a company’s fundamentals and as such, may not match with a report on a company’s fundamentals.
Opinions expressed are our current opinions as of the date appearing on this material only. While we endeavor to update on a reasonable basis the
information discussed in this material, there may be regulatory, compliance, or other reasons that prevent us from doing so. Prospective investors and
others are cautioned that any forward-looking statements are not predictions and may be subject to change without notice. Our proprietary trading and
investment businesses may make investment decisions that are inconsistent with the recommendations expressed herein. We and our affiliates,
officers, directors, and employees world wide may: (a) from time to time, have long or short positions in, and buy or sell the securities thereof, of
company (ies) mentioned herein or (b) be engaged in any other transaction involving such securities and earn brokerage or other compensation or act
as a market maker in the financial instruments of the company (ies) discussed herein or act as advisor or lender / borrower to such company (ies) or
have other potential conflict of interest with respect to any recommendation and related information and opinions. The analyst for this report certifies
that all of the views expressed in this report accurately reflect his or her personal views about the subject company or companies and its or their
securities, and no part of his or her compensation was, is or will be, directly or indirectly related to specific recommendations or views expressed in this
report. No part of this material may be duplicated in any form and/or redistributed without Keynote Capitals Ltd’s., prior written consent.
Keynote Capitals Ltd.
The Ruby,
9th Floor,
Senapati Bapat Marg,
Dadar (W), Mumbai, India – 400028
Tel: 30266000 / 22694322
www.keynotecapitals.com