Church Building Grants To Assist With New Construction, Additions, And Restor...
Keynote technicals daily report for 030312
1. Daily Technical Outlook
3rd March 2012
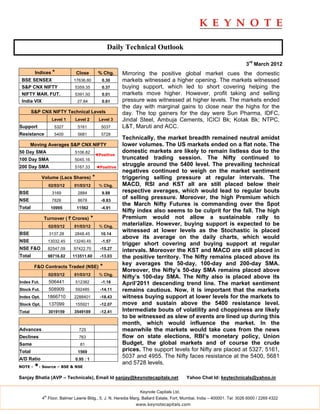
Indices * Close % Chg. Mirroring the positive global market cues the domestic
BSE SENSEX 17636.80 0.30 markets witnessed a higher opening. The markets witnessed
S&P CNX NIFTY 5359.35 0.37 buying support, which led to short covering helping the
NIFTY MAR. FUT. 5391.50 0.01 markets move higher. However, profit taking and selling
India VIX 27.84 0.61 pressure was witnessed at higher levels. The markets ended
the day with marginal gains to close near the highs for the
S&P CNX NIFTY Technical Levels day. The top gainers for the day were Sun Pharma, IDFC,
Level 1 Level 2 Level 3 Jindal Steel, Ambuja Cements, ICICI Bk; Kotak Bk; NTPC,
Support 5327 5161 5037 L&T, Maruti and ACC.
Resistance 5400 5681 5728
Technically, the market breadth remained neutral amidst
Moving Averages S&P CNX NIFTY lower volumes. The US markets ended on a flat note. The
50 Day SMA 5106.82 domestic markets are likely to remain listless due to the
◄Positive
100 Day SMA 5045.16 truncated trading session. The Nifty continued to
200 Day SMA 5167.33 ◄Positive
struggle around the 5400 level. The prevailing technical
negatives continued to weigh on the market sentiment
Volume (Lacs Shares) * triggering selling pressure at regular intervals. The
02/03/12 01/03/12 % Chg. MACD, RSI and KST all are still placed below their
BSE 3169 2884 9.88 respective averages, which would lead to regular bouts
NSE 7826 8678 -9.83
of selling pressure. Moreover, the high Premium which
the March Nifty Futures is commanding over the Spot
Total 10995 11562 -4.91
Nifty index also seems to be culprit for the fall. The high
Turnover ( ` Crores) * Premium would not allow a sustainable rally to
02/03/12 01/03/12 % Chg.
materialize. However, buying support is expected to be
witnessed at lower levels as the Stochastic is placed
BSE 3137.28 2848.45 10.14
above its average on the daily charts, which would
NSE 13032.45 13240.45 -1.57
trigger short covering and buying support at regular
NSE F&O 82547.09 97422.70 -15.27 intervals. Moreover the KST and MACD are still placed in
Total 98716.82 113511.60 -13.03 the positive territory. The Nifty remains placed above its
key averages the 50-day, 100-day and 200-day SMA.
F&O Contracts Traded (NSE) *
Moreover, the Nifty’s 50-day SMA remains placed above
02/03/12 01/03/12 % Chg.
Nifty’s 100-day SMA. The Nifty also is placed above its
Index Fut. 506441 512382 -1.16 April’2011 descending trend line. The market sentiment
Stock Fut. 508909 592485 -14.11 remains cautious. Now, it is important that the markets
Index Opt. 1866710 2288401 -18.43 witness buying support at lower levels for the markets to
Stock Opt. 137099 155921 -12.07 move and sustain above the 5400 resistance level.
Total 3019159 3549189 -12.41 Intermediate bouts of volatility and choppiness are likely
to be witnessed as slew of events are lined up during this
month, which would influence the market. In the
Advances 725 meanwhile the markets would take cues from the news
Declines 763 flow on state elections, RBI’s monetary policy, Union
Same 81 Budget, the global markets and of course the crude
Total 1569 prices. The support levels for Nifty are placed at 5327, 5161,
A/D Ratio 0.95 : 1
5037 and 4955. The Nifty faces resistance at the 5400, 5681
and 5728 levels.
NOTE - *- Source – BSE & NSE
Sanjay Bhatia (AVP – Technicals), Email Id sanjay@keynotecapitals.net Yahoo Chat Id: keytechnicals@yahoo.in
Keynote Capitals Ltd.
th
4 Floor, Balmer Lawrie Bldg., 5, J. N. Heredia Marg, Ballard Estate, Fort, Mumbai, India – 400001. Tel: 3026 6000 / 2269 4322
www.keynotecapitals.com
2. Short Term Trading Ideas Based On Technical Analysis (5 - 7 Days)
Stop
Initiation Stop Loss Target
Stock Close Action Price Loss * (%) Target (%) Remarks
ACC 1338.45 Buy Above 1345 1311.00 2.53 1421 5.65
Ambuja Cements 168.30 Buy Above 170 165.50 2.65 180 5.88
DLF 203.85 Sell Below 202 216.00 6.93 170 15.84
* Stop Losses are to be considered strictly on Closing basis.
Intra-day Resistance Intra-day Support
Indices Close Pivot Point R1 R2 R3 S1 S2 S3
BSE SENSEX 17637 17624 17744 17852 18079 17517 17397 17169
S&P CNX NIFTY 5359 5356 5396 5433 5511 5319 5278 5201
NIFTY MAR. FUT. 5392 5394 5436 5480 5567 5349 5307 5221
Keynote Capitals Ltd.
th
4 Floor, Balmer Lawrie Bldg., 5, J. N. Heredia Marg, Ballard Estate, Fort, Mumbai, India – 400001. Tel: 3026 6000 / 2269 4322
www.keynotecapitals.com
3. Disclaimer
This document is not for public distribution and has been furnished to you solely for your information and must not be
reproduced or redistributed to any other person. Persons into whose possession this document may come are
required to observe these restrictions.
This material is for the personal information of the authorized recipient, and we are not soliciting any action based
upon it. This report is not to be construed as an offer to sell or the solicitation of an offer to buy any security in any
jurisdiction where such an offer or solicitation would be illegal. It is for the general information of clients of Keynote
Capitals Ltd. It does not constitute a personal recommendation or take into account the particular investment
objectives, financial situations, or needs of individual clients.
We have reviewed the report, and in so far as it includes current or historical information, it is believed to be reliable
though its accuracy or completeness cannot be guaranteed. Neither Keynote Capitals Ltd., nor any person connected
with it, accepts any liability arising from the use of this document. The recipients of this material should rely on their
own investigations and take their own professional advice. Price and value of the investments referred to in this
material may go up or down. Past performance is not a guide for future performance. Certain transactions -including
those involving futures, options and other derivatives as well as non-investment grade securities - involve substantial
risk and are not suitable for all investors. Reports based on technical analysis centers on studying charts of a stock’s
price movement and trading volume, as opposed to focusing on a company’s fundamentals and as such, may not
match with a report on a company’s fundamentals.
Opinions expressed are our current opinions as of the date appearing on this material only. While we endeavor to
update on a reasonable basis the information discussed in this material, there may be regulatory, compliance, or
other reasons that prevent us from doing so. Prospective investors and others are cautioned that any forward-looking
statements are not predictions and may be subject to change without notice. Our proprietary trading and investment
businesses may make investment decisions that are inconsistent with the recommendations expressed herein.
We and our affiliates, officers, directors, and employees world wide may: (a) from time to time, have long or short
positions in, and buy or sell the securities thereof, of company (ies) mentioned herein or (b) be engaged in any other
transaction involving such securities and earn brokerage or other compensation or act as a market maker in the
financial instruments of the company (ies) discussed herein or act as advisor or lender / borrower to such company
(ies) or have other potential conflict of interest with respect to any recommendation and related information and
opinions.
The analyst for this report certifies that all of the views expressed in this report accurately reflect his or her personal
views about the subject company or companies and its or their securities, and no part of his or her compensation
was, is or will be, directly or indirectly related to specific recommendations or views expressed in this report.
No part of this material may be duplicated in any form and/or redistributed without Keynote Capitals Ltd’s., prior
written consent.
Keynote Capitals Ltd.
th
4 Floor, Balmer Lawrie Bldg., 5, J. N. Heredia Marg, Ballard Estate, Fort, Mumbai, India – 400001. Tel: 3026 6000 / 2269 4322
www.keynotecapitals.com