1. Daily Technical Outlook
3rd July 2012
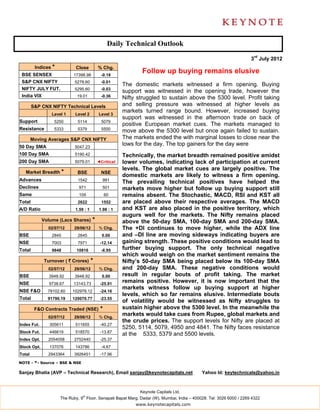
Indices * Close % Chg.
BSE SENSEX 17398.98 -0.18
Follow up buying remains elusive
S&P CNX NIFTY 5278.60 -0.01
The domestic markets witnessed a firm opening. Buying
NIFTY JULY FUT. 5295.60 -0.03
support was witnessed in the opening trade, however the
India VIX 19.01 -0.36 Nifty struggled to sustain above the 5300 level. Profit taking
S&P CNX NIFTY Technical Levels and selling pressure was witnessed at higher levels as
markets turned range bound. However, increased buying
Level 1 Level 2 Level 3
support was witnessed in the afternoon trade on back of
Support 5250 5114 5079
positive European market cues. The markets managed to
Resistance 5333 5379 5500 move above the 5300 level but once again failed to sustain.
Moving Averages S&P CNX NIFTY The markets ended the with marginal losses to close near the
50 Day SMA 5047.23
lows for the day. The top gainers for the day were
100 Day SMA 5190.42 Technically, the market breadth remained positive amidst
200 Day SMA 5079.01 ◄Critical lower volumes, indicating lack of participation at current
levels. The global market cues are largely positive. The
Market Breadth * BSE NSE
domestic markets are likely to witness a firm opening.
Advances 1542 991
The prevailing technical positives have helped the
Declines 971 501 markets move higher but follow up buying support still
Same 109 60 remains absent. The Stochastic, MACD, RSI and KST all
Total 2622 1552 are placed above their respective averages. The MACD
A/D Ratio 1.59 : 1 1.98 : 1 and KST are also placed in the positive territory, which
augurs well for the markets. The Nifty remains placed
Volume (Lacs Shares) * above the 50-day SMA, 100-day SMA and 200-day SMA.
02/07/12 29/06/12 % Chg. The +DI continues to move higher, while the ADX line
BSE 2845 2845 0.00 and –DI line are moving sideways indicating buyers are
NSE 7003 7971 -12.14 gaining strength. These positive conditions would lead to
Total 9848 10816 -8.95 further buying support. The only technical negative
which would weigh on the market sentiment remains the
Turnover ( ` Crores) * Nifty’s 50-day SMA being placed below its 100-day SMA
02/07/12 29/06/12 % Chg. and 200-day SMA. These negative conditions would
BSE 3948.92 3948.92 0.00 result in regular bouts of profit taking. The market
NSE 9738.67 13143.73 -25.91
remains positive. However, it is now important that the
markets witness follow up buying support at higher
NSE F&O 78102.60 102978.12 -24.16
levels, which so far remains elusive. Intermediate bouts
Total 91790.19 120070.77 -23.55
of volatility would be witnessed as Nifty struggles to
F&O Contracts Traded (NSE) * sustain higher above the 5300 level. In the meanwhile the
02/07/12 29/06/12 % Chg.
markets would take cues from Rupee, global markets and
the crude prices. The support levels for Nifty are placed at
Index Fut. 305611 511655 -40.27
5250, 5114, 5079, 4950 and 4841. The Nifty faces resistance
Stock Fut. 446619 518570 -13.87
at the 5333, 5379 and 5500 levels.
Index Opt. 2054058 2752440 -25.37
Stock Opt. 137076 143786 -4.67
Total 2943364 3926451 -17.96
NOTE - *- Source – BSE & NSE
Sanjay Bhatia (AVP – Technical Research), Email sanjay@keynotecapitals.net Yahoo Id: keytechnicals@yahoo.in
Keynote Capitals Ltd.
th
The Ruby, 9 Floor, Senapati Bapat Marg, Dadar (W), Mumbai, India – 400028. Tel: 3026 6000 / 2269 4322
www.keynotecapitals.com
2. Jaldi 5
(Short Term Technical Ideas for 5 Trading Days)
Stop
Initiation Stop Loss Target
Stock Close Action Price Loss * (%) Target (%) Remarks
ACC 1317.05 Buy Above 1320.00 1295 1.89 1375 4.17
Century Textiles 313.75 Buy Above 315.00 304 3.49 340 7.94
HDFC 661.00 Buy Above 664.00 643 3.16 710 6.93
* Stop Losses are to be considered strictly on closing basis.
Intra-day Resistance Intra-day Support
Indices Close Pivot Point R1 R2 R3 S1 S2 S3
BSE SENSEX 17399 17416 17469 17540 17663 17346 17293 17169
S&P CNX NIFTY 5279 5281 5299 5320 5359 5261 5243 5204
NIFTY JULY FUT. 5296 5300 5321 5346 5393 5274 5253 5206
Keynote Capitals Ltd.
th
The Ruby, 9 Floor, Senapati Bapat Marg, Dadar (W), Mumbai, India – 400028. Tel: 3026 6000 / 2269 4322
www.keynotecapitals.com
3. Stocks to watch out today
Aban, ACC, Adani Ports, Arvind, Asia Paints, Aurobindo Pharma, Axis Bank, Bajaj Hind; Bombay Dying, Century Textiles,
Delta Corp; Divis Labs, DLF, DR. Reddys, HDFC, HDFC Bank, IRB Infra, Jubilant Foods, Kotak Bank, LITL, M&M, McDowell,
NMDC, NTPC, Oriental Bank, Pantaloon Retail, Patel Engg; Tata Coffee, Tech Mahindra, Uco Bank, ZEEL
Ashok Leyland, HUL, ITC
Disclaimer
This document is not for public distribution and has been furnished to you solely for your information and must not be
reproduced or redistributed to any other person. Persons into whose possession this document may come are
required to observe these restrictions.
This material is for the personal information of the authorized recipient, and we are not soliciting any action based
upon it. This report is not to be construed as an offer to sell or the solicitation of an offer to buy any security in any
jurisdiction where such an offer or solicitation would be illegal. It is for the general information of clients of Keynote
Capitals Ltd. It does not constitute a personal recommendation or take into account the particular investment
objectives, financial situations, or needs of individual clients.
We have reviewed the report, and in so far as it includes current or historical information, it is believed to be reliable
though its accuracy or completeness cannot be guaranteed. Neither Keynote Capitals Ltd., nor any person connected
with it, accepts any liability arising from the use of this document. The recipients of this material should rely on their
own investigations and take their own professional advice. Price and value of the investments referred to in this
material may go up or down. Past performance is not a guide for future performance. Certain transactions -including
those involving futures, options and other derivatives as well as non-investment grade securities - involve substantial
risk and are not suitable for all investors. Reports based on technical analysis centers on studying charts of a stock’s
price movement and trading volume, as opposed to focusing on a company’s fundamentals and as such, may not
match with a report on a company’s fundamentals.
Opinions expressed are our current opinions as of the date appearing on this material only. While we endeavor to
update on a reasonable basis the information discussed in this material, there may be regulatory, compliance, or
other reasons that prevent us from doing so. Prospective investors and others are cautioned that any forward-looking
statements are not predictions and may be subject to change without notice. Our proprietary trading and investment
businesses may make investment decisions that are inconsistent with the recommendations expressed herein.
We and our affiliates, officers, directors, and employees world wide may: (a) from time to time, have long or short
positions in, and buy or sell the securities thereof, of company (ies) mentioned herein or (b) be engaged in any other
transaction involving such securities and earn brokerage or other compensation or act as a market maker in the
financial instruments of the company (ies) discussed herein or act as advisor or lender / borrower to such company
(ies) or have other potential conflict of interest with respect to any recommendation and related information and
opinions.
The analyst for this report certifies that all of the views expressed in this report accurately reflect his or her personal
views about the subject company or companies and its or their securities, and no part of his or her compensation
was, is or will be, directly or indirectly related to specific recommendations or views expressed in this report.
No part of this material may be duplicated in any form and/or redistributed without Keynote Capitals Ltd’s., prior
written consent.
Keynote Capitals Ltd.
th
The Ruby, 9 Floor, Senapati Bapat Marg, Dadar (W), Mumbai, India – 400028. Tel: 3026 6000 / 2269 4322
www.keynotecapitals.com