1. Daily Technical Outlook
24th January 2012
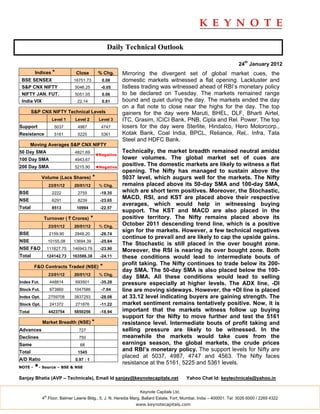
Indices * Close % Chg. Mirroring the divergent set of global market cues, the
BSE SENSEX 16751.73 0.08 domestic markets witnessed a flat opening. Lackluster and
S&P CNX NIFTY 5046.25 -0.05 listless trading was witnessed ahead of RBI’s monetary policy
NIFTY JAN. FUT. 5051.05 0.06 to be declared on Tuesday. The markets remained range
India VIX 22.14 0.81 bound and quiet during the day. The markets ended the day
on a flat note to close near the highs for the day. The top
S&P CNX NIFTY Technical Levels gainers for the day were Maruti, BHEL, DLF, Bharti Airtel,
Level 1 Level 2 Level 3 ITC, Grasim, ICICI Bank, PNB, Cipla and Rel. Power. The top
Support 5037 4987 4747 losers for the day were Sterlite, Hindalco, Hero Motorcorp.,
Resistance 5161 5225 5361 Kotak Bank, Coal India, BPCL, Reliance, Rel,. Infra, Tata
Steel and HDFC Bank.
Moving Averages S&P CNX NIFTY
50 Day SMA 4821.69 Technically, the market breadth remained neutral amidst
◄Negative
100 Day SMA 4943.67 lower volumes. The global market set of cues are
200 Day SMA 5215.90 ◄Negative
positive. The domestic markets are likely to witness a flat
opening. The Nifty has managed to sustain above the
Volume (Lacs Shares) * 5037 level, which augurs well for the markets. The Nifty
23/01/12 20/01/12 % Chg. remains placed above its 50-day SMA and 100-day SMA,
BSE 2222 2755 -19.35 which are short term positives. Moreover, the Stochastic,
NSE 6291 8239 -23.65
MACD, RSI, and KST are placed above their respective
averages, which would help in witnessing buying
Total 8513 10994 -22.57
support. The KST and MACD are also placed in the
Turnover ( ` Crores) * positive territory. The Nifty remains placed above its
23/01/12 20/01/12 % Chg.
October 2011 descending trend line, which is a positive
sign for the markets. However, a few technical negatives
BSE 2159.90 2948.20 -26.74
continue to prevail and are likely to cap the upside gains.
NSE 10155.08 13694.39 -25.84
The Stochastic is still placed in the over bought zone.
NSE F&O 111827.75 146943.79 -23.90 Moreover, the RSI is nearing its over bought zone. Both
Total 124142.73 163586.38 -24.11 these conditions would lead to intermediate bouts of
profit taking. The Nifty continues to trade below its 200-
F&O Contracts Traded (NSE) *
day SMA. The 50-day SMA is also placed below the 100-
23/01/12 20/01/12 % Chg.
day SMA. All these conditions would lead to selling
Index Fut. 448814 693501 -35.28 pressure especially at higher levels. The ADX line, -DI
Stock Fut. 973860 1047586 -7.04 line are moving sideways. However, the +DI line is placed
Index Opt. 2759708 3837293 -28.08 at 33.12 level indicating buyers are gaining strength. The
Stock Opt. 241372 271876 -11.22 market sentiment remains tentatively positive. Now, it is
Total 4423754 5850256 -18.94 important that the markets witness follow up buying
support for the Nifty to move further and test the 5161
Market Breadth (NSE) * resistance level. Intermediate bouts of profit taking and
Advances 727 selling pressure are likely to be witnessed. In the
Declines 750 meanwhile the markets would take cues from the
Same 68 earnings season, the global markets, the crude prices
Total 1545
and RBI’s monetary policy. The support levels for Nifty are
placed at 5037, 4987, 4747 and 4563. The Nifty faces
A/D Ratio 0.97 : 1
resistance at the 5161, 5225 and 5361 levels.
NOTE - *- Source – BSE & NSE
Sanjay Bhatia (AVP – Technicals), Email Id sanjay@keynotecapitals.net Yahoo Chat Id: keytechnicals@yahoo.in
Keynote Capitals Ltd.
th
4 Floor, Balmer Lawrie Bldg., 5, J. N. Heredia Marg, Ballard Estate, Fort, Mumbai, India – 400001. Tel: 3026 6000 / 2269 4322
www.keynotecapitals.com
2. Short Term Trading Ideas Based On Technical Analysis (5 - 7 Days)
Stop
Initiation Stop Loss Target
Stock Close Action Price Loss * (%) Target (%) Remarks
ABB 756.40 Buy Above 760.00 742.00 2.37 800 5.26
Cipla 341.65 Buy Above 344.00 336.75 2.11 360 4.65
DLF 219.30 Buy Above 221.00 208.40 5.70 249 12.67
* Stop Losses are to be considered strictly on Closing basis.
Intra-day Resistance Intra-day Support
Indices Close Pivot Point R1 R2 R3 S1 S2 S3
BSE SENSEX 16752 16732 16804 16856 16981 16679 16607 16482
S&P CNX NIFTY 5046 5042 5063 5081 5119 5025 5004 4966
NIFTY JAN. FUT. 5051 5049 5064 5077 5106 5036 5021 4993
Keynote Capitals Ltd.
th
4 Floor, Balmer Lawrie Bldg., 5, J. N. Heredia Marg, Ballard Estate, Fort, Mumbai, India – 400001. Tel: 3026 6000 / 2269 4322
www.keynotecapitals.com
3. Disclaimer
This document is not for public distribution and has been furnished to you solely for your information and must not be
reproduced or redistributed to any other person. Persons into whose possession this document may come are
required to observe these restrictions.
This material is for the personal information of the authorized recipient, and we are not soliciting any action based
upon it. This report is not to be construed as an offer to sell or the solicitation of an offer to buy any security in any
jurisdiction where such an offer or solicitation would be illegal. It is for the general information of clients of Keynote
Capitals Ltd. It does not constitute a personal recommendation or take into account the particular investment
objectives, financial situations, or needs of individual clients.
We have reviewed the report, and in so far as it includes current or historical information, it is believed to be reliable
though its accuracy or completeness cannot be guaranteed. Neither Keynote Capitals Ltd., nor any person connected
with it, accepts any liability arising from the use of this document. The recipients of this material should rely on their
own investigations and take their own professional advice. Price and value of the investments referred to in this
material may go up or down. Past performance is not a guide for future performance. Certain transactions -including
those involving futures, options and other derivatives as well as non-investment grade securities - involve substantial
risk and are not suitable for all investors. Reports based on technical analysis centers on studying charts of a stock’s
price movement and trading volume, as opposed to focusing on a company’s fundamentals and as such, may not
match with a report on a company’s fundamentals.
Opinions expressed are our current opinions as of the date appearing on this material only. While we endeavor to
update on a reasonable basis the information discussed in this material, there may be regulatory, compliance, or
other reasons that prevent us from doing so. Prospective investors and others are cautioned that any forward-looking
statements are not predictions and may be subject to change without notice. Our proprietary trading and investment
businesses may make investment decisions that are inconsistent with the recommendations expressed herein.
We and our affiliates, officers, directors, and employees world wide may: (a) from time to time, have long or short
positions in, and buy or sell the securities thereof, of company (ies) mentioned herein or (b) be engaged in any other
transaction involving such securities and earn brokerage or other compensation or act as a market maker in the
financial instruments of the company (ies) discussed herein or act as advisor or lender / borrower to such company
(ies) or have other potential conflict of interest with respect to any recommendation and related information and
opinions.
The analyst for this report certifies that all of the views expressed in this report accurately reflect his or her personal
views about the subject company or companies and its or their securities, and no part of his or her compensation
was, is or will be, directly or indirectly related to specific recommendations or views expressed in this report.
No part of this material may be duplicated in any form and/or redistributed without Keynote Capitals Ltd’s., prior
written consent.
Keynote Capitals Ltd.
th
4 Floor, Balmer Lawrie Bldg., 5, J. N. Heredia Marg, Ballard Estate, Fort, Mumbai, India – 400001. Tel: 3026 6000 / 2269 4322
www.keynotecapitals.com