1. Daily Technical Outlook
28th March 2012
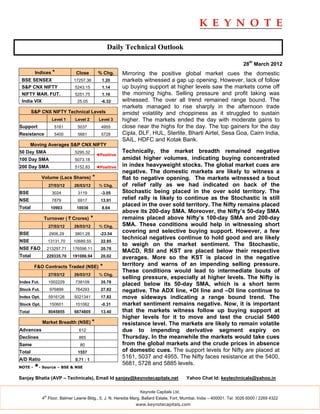
Indices * Close % Chg. Mirroring the positive global market cues the domestic
BSE SENSEX 17257.36 1.20 markets witnessed a gap up opening. However, lack of follow
S&P CNX NIFTY 5243.15 1.14 up buying support at higher levels saw the markets come off
NIFTY MAR. FUT. 5251.75 1.16 the morning highs. Selling pressure and profit taking was
India VIX 25.05 -6.32 witnessed. The over all trend remained range bound. The
markets managed to rise sharply in the afternoon trade
S&P CNX NIFTY Technical Levels amidst volatility and choppiness as it struggled to sustain
Level 1 Level 2 Level 3 higher. The markets ended the day with moderate gains to
Support 5161 5037 4955 close near the highs for the day. The top gainers for the day
Resistance 5400 5681 5728 Cipla, DLF, HUL, Sterlite, Bharti Airtel, Sesa Goa, Cairn India,
SAIL, HDFC and Kotak Bank.
Moving Averages S&P CNX NIFTY
50 Day SMA 5295.32 Technically, the market breadth remained negative
◄Positive
100 Day SMA 5073.18 amidst higher volumes, indicating buying concentrated
200 Day SMA 5152.83 ◄Positive in index heavyweight stocks. The global market cues are
negative. The domestic markets are likely to witness a
Volume (Lacs Shares) * flat to negative opening. The markets witnessed a bout
27/03/12 26/03/12 % Chg. of relief rally as we had indicated on back of the
BSE 3024 3119 -3.05 Stochastic being placed in the over sold territory. The
NSE 7879 6917 13.91 relief rally is likely to continue as the Stochastic is still
Total 10903 10036 8.64
placed in the over sold territory. The Nifty remains placed
above its 200-day SMA. Moreover, the Nifty’s 50-day SMA
Turnover ( ` Crores) * remains placed above Nifty’s 100-day SMA and 200-day
27/03/12 26/03/12 % Chg. SMA. These conditions would help in witnessing short
BSE 2906.29 3801.28 -23.54
covering and selective buying support. However, a few
technical negatives continue to hold good and are likely
NSE 13131.70 10689.55 22.85
to weigh on the market sentiment. The Stochastic,
NSE F&O 213297.71 176596.11 20.78
MACD, RSI and KST are placed below their respective
Total 229335.70 191086.94 20.02 averages. More so the KST is placed in the negative
F&O Contracts Traded (NSE) * territory and warns of an impending selling pressure.
These conditions would lead to intermediate bouts of
27/03/12 26/03/12 % Chg.
selling pressure, especially at higher levels. The Nifty is
Index Fut. 1002229 738109 35.78
placed below its 50-day SMA, which is a short term
Stock Fut. 976899 764293 27.82 negative. The ADX line, +DI line and –DI line continue to
Index Opt. 5916126 5021341 17.82 move sideways indicating a range bound trend. The
Stock Opt. 150601 151062 -0.31 market sentiment remains negative. Now, it is important
Total 8045855 6674805 13.40 that the markets witness follow up buying support at
higher levels for it to move and test the crucial 5400
Market Breadth (NSE) * resistance level. The markets are likely to remain volatile
Advances 612 due to impending derivative segment expiry on
Declines 865 Thursday. In the meanwhile the markets would take cues
Same 80 from the global markets and the crude prices in absence
Total 1557 of domestic cues. The support levels for Nifty are placed at
A/D Ratio 0.71 : 1
5161, 5037 and 4955. The Nifty faces resistance at the 5400,
5681, 5728 and 5885 levels.
NOTE - *- Source – BSE & NSE
Sanjay Bhatia (AVP – Technicals), Email Id sanjay@keynotecapitals.net Yahoo Chat Id: keytechnicals@yahoo.in
Keynote Capitals Ltd.
th
4 Floor, Balmer Lawrie Bldg., 5, J. N. Heredia Marg, Ballard Estate, Fort, Mumbai, India – 400001. Tel: 3026 6000 / 2269 4322
www.keynotecapitals.com
2. Short Term Trading Ideas Based On Technical Analysis (5 - 7 Days)
Stop
Initiation Stop Loss Target
Stock Close Action Price Loss * (%) Target (%) Remarks
Bombay Dying 563.90 Buy Above 566 550.00 2.83 600 6.01
Andhra Bank 119.40 Sell Below 117 120.25 2.43 110 6.30
BHEL 255.45 Sell Below 251 260.50 3.78 230 8.37
IRB Infra 177.70 Sell Below 175 179.50 2.87 164 6.02
* Stop Losses are to be considered strictly on closing basis.
Intra-day Resistance Intra-day Support
Indices Close Pivot Point R1 R2 R3 S1 S2 S3
BSE SENSEX 17257 17228 17396 17534 17840 17090 16923 16617
S&P CNX NIFTY 5243 5235 5286 5329 5422 5193 5142 5049
NIFTY MAR. FUT. 5252 5245 5302 5352 5459 5195 5138 5031
Keynote Capitals Ltd.
th
4 Floor, Balmer Lawrie Bldg., 5, J. N. Heredia Marg, Ballard Estate, Fort, Mumbai, India – 400001. Tel: 3026 6000 / 2269 4322
www.keynotecapitals.com
3. Disclaimer
This document is not for public distribution and has been furnished to you solely for your information and must not be
reproduced or redistributed to any other person. Persons into whose possession this document may come are
required to observe these restrictions.
This material is for the personal information of the authorized recipient, and we are not soliciting any action based
upon it. This report is not to be construed as an offer to sell or the solicitation of an offer to buy any security in any
jurisdiction where such an offer or solicitation would be illegal. It is for the general information of clients of Keynote
Capitals Ltd. It does not constitute a personal recommendation or take into account the particular investment
objectives, financial situations, or needs of individual clients.
We have reviewed the report, and in so far as it includes current or historical information, it is believed to be reliable
though its accuracy or completeness cannot be guaranteed. Neither Keynote Capitals Ltd., nor any person connected
with it, accepts any liability arising from the use of this document. The recipients of this material should rely on their
own investigations and take their own professional advice. Price and value of the investments referred to in this
material may go up or down. Past performance is not a guide for future performance. Certain transactions -including
those involving futures, options and other derivatives as well as non-investment grade securities - involve substantial
risk and are not suitable for all investors. Reports based on technical analysis centers on studying charts of a stock’s
price movement and trading volume, as opposed to focusing on a company’s fundamentals and as such, may not
match with a report on a company’s fundamentals.
Opinions expressed are our current opinions as of the date appearing on this material only. While we endeavor to
update on a reasonable basis the information discussed in this material, there may be regulatory, compliance, or
other reasons that prevent us from doing so. Prospective investors and others are cautioned that any forward-looking
statements are not predictions and may be subject to change without notice. Our proprietary trading and investment
businesses may make investment decisions that are inconsistent with the recommendations expressed herein.
We and our affiliates, officers, directors, and employees world wide may: (a) from time to time, have long or short
positions in, and buy or sell the securities thereof, of company (ies) mentioned herein or (b) be engaged in any other
transaction involving such securities and earn brokerage or other compensation or act as a market maker in the
financial instruments of the company (ies) discussed herein or act as advisor or lender / borrower to such company
(ies) or have other potential conflict of interest with respect to any recommendation and related information and
opinions.
The analyst for this report certifies that all of the views expressed in this report accurately reflect his or her personal
views about the subject company or companies and its or their securities, and no part of his or her compensation
was, is or will be, directly or indirectly related to specific recommendations or views expressed in this report.
No part of this material may be duplicated in any form and/or redistributed without Keynote Capitals Ltd’s., prior
written consent.
Keynote Capitals Ltd.
th
4 Floor, Balmer Lawrie Bldg., 5, J. N. Heredia Marg, Ballard Estate, Fort, Mumbai, India – 400001. Tel: 3026 6000 / 2269 4322
www.keynotecapitals.com