High Class Call Girls Nashik Maya 7001305949 Independent Escort Service Nashik
Keynote technicals intraday future levels for 031012
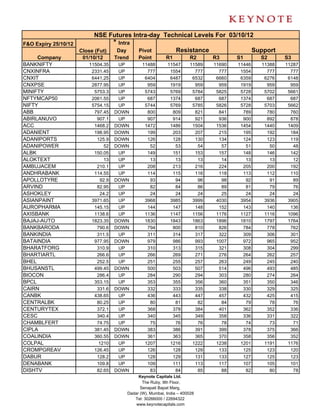
1. NSE Futures Intra-day Technical Levels For 03/10/12 _
F&O Expiry 25/10/12 * Intra
Close (Fut) Day Pivot Resistance Support
Company 01/10/12 Trend Point R1 R2 R3 S1 S2 S3
BANKNIFTY 11504.35 UP 11488 11547 11589 11690 11446 11388 11287
CNXINFRA 2331.45 UP 777 1554 777 777 1554 777 777
CNXIT 6441.25 UP 6404 6487 6532 6660 6359 6276 6148
CNXPSE 2877.95 UP 959 1919 959 959 1919 959 959
MINIFTY 5753.3 UP 5743 5769 5784 5825 5728 5702 5661
NFTYMCAP50 2061.55 UP 687 1374 687 687 1374 687 687
NIFTY 5754.15 UP 5744 5769 5785 5826 5728 5703 5662
ABB 797.45 DOWN 800 809 821 841 789 780 760
ABIRLANUVO 907.1 UP 907 914 921 936 900 892 878
ACC 1468.2 DOWN 1472 1486 1504 1536 1454 1440 1409
ADANIENT 198.95 DOWN 199 203 207 215 195 192 184
ADANIPORTS 125.9 DOWN 126 128 130 134 124 123 119
ADANIPOWER 52 DOWN 52 53 54 57 51 50 48
ALBK 150.05 UP 149 151 153 157 148 146 142
ALOKTEXT 13 UP 13 13 13 14 13 13 12
AMBUJACEM 210.1 UP 208 213 216 224 205 200 192
ANDHRABANK 114.55 UP 114 115 116 118 113 112 110
APOLLOTYRE 92.9 DOWN 93 94 96 98 92 91 89
ARVIND 82.95 UP 82 84 86 89 81 79 76
ASHOKLEY 24.2 UP 24 24 24 25 24 24 24
ASIANPAINT 3971.65 UP 3968 3985 3999 4030 3954 3936 3905
AUROPHARMA 145.15 UP 144 147 148 152 143 140 136
AXISBANK 1138.6 UP 1136 1147 1156 1176 1127 1116 1096
BAJAJ-AUTO 1823.35 DOWN 1830 1843 1863 1896 1810 1797 1764
BANKBARODA 790.6 DOWN 794 800 810 826 784 778 762
BANKINDIA 311.5 UP 311 314 317 322 309 306 301
BATAINDIA 977.95 DOWN 979 986 993 1007 972 965 952
BHARATFORG 310.9 UP 310 313 315 321 308 304 299
BHARTIARTL 266.6 UP 266 269 271 276 264 262 257
BHEL 252.5 UP 251 255 257 263 249 245 240
BHUSANSTL 499.45 DOWN 500 503 507 514 496 493 485
BIOCON 286.4 UP 284 290 294 303 280 274 264
BPCL 353.15 UP 353 355 356 360 351 350 346
CAIRN 331.6 DOWN 332 333 335 338 330 329 325
CANBK 438.65 UP 436 443 447 457 432 425 415
CENTRALBK 80.25 UP 80 81 82 84 79 78 76
CENTURYTEX 372.1 UP 368 378 384 401 362 352 336
CESC 340.4 UP 340 345 349 358 336 331 322
CHAMBLFERT 74.75 UP 75 76 76 78 74 73 71
CIPLA 381.45 DOWN 383 386 391 399 378 375 366
COALINDIA 360.55 DOWN 361 363 365 370 358 356 352
COLPAL 1210 UP 1207 1216 1222 1238 1201 1191 1176
CROMPGREAV 126.45 UP 126 128 129 133 125 123 120
DABUR 128.2 UP 128 129 131 133 127 125 123
DENABANK 109.8 UP 109 111 113 117 107 105 101
DISHTV 82.65 DOWN 83 84 85 88 82 80 78
Keynote Capitals Ltd.
The Ruby, 9th Floor,
Senapati Bapat Marg,
Dadar (W), Mumbai, India – 400028
Tel: 30266000 / 22694322
www.keynotecapitals.com
2. NSE Futures Intra-day Technical Levels For 03/10/12 _
F&O Expiry 25/10/12 * Intra
Close (Fut) Day Pivot Resistance Support
Company 01/10/12 Trend Point R1 R2 R3 S1 S2 S3
DIVISLAB 1125.9 UP 1115 1140 1154 1192 1101 1077 1038
DLF 230.65 DOWN 231 235 239 247 227 223 215
DRREDDY 1652.95 DOWN 1654 1664 1676 1697 1643 1633 1611
EXIDEIND 154.65 UP 154 156 158 162 153 150 147
FEDERALBNK 452.25 UP 451 454 456 460 449 447 442
FINANTECH 980.05 DOWN 981 991 1001 1021 971 962 942
GAIL 385.85 DOWN 386 389 391 397 383 381 375
GMRINFRA 24.95 UP 25 25 26 27 24 24 23
GODREJIND 289.35 UP 289 292 294 299 286 283 278
GRASIM 3415.2 UP 3386 3457 3498 3610 3345 3274 3162
GSPL 81.45 DOWN 82 82 83 84 81 81 80
GUJFLUORO 393.6 UP 393 402 409 426 385 376 359
GVKPIL 14.85 UP 15 15 15 16 15 14 14
HAVELLS 629.25 DOWN 630 634 638 646 626 623 615
HCLTECH 580.8 UP 578 585 590 602 574 567 555
HDFC 774.75 UP 775 778 781 788 771 768 762
HDFCBANK 627.6 DOWN 629 634 640 652 623 617 606
HDIL 100.35 UP 99 102 104 108 97 95 90
HEROMOTOCO 1849.35 UP 1848 1862 1875 1903 1835 1821 1794
HEXAWARE 122.95 DOWN 123 125 127 131 121 120 116
HINDALCO 123.4 UP 122 125 127 131 121 118 113
HINDPETRO 312.25 UP 311 315 317 323 309 305 300
HINDUNILVR 546.4 UP 546 549 551 556 544 542 537
HINDZINC 135.15 DOWN 136 137 138 141 134 133 130
IBREALEST 59.1 UP 59 60 61 62 58 57 55
ICICIBANK 1058.2 UP 1058 1065 1072 1086 1051 1044 1030
IDBI 102.65 UP 102 104 105 108 101 99 96
IDEA 84.4 DOWN 85 86 87 89 84 83 81
IDFC 155.7 UP 155 158 160 165 153 150 145
IFCI 31.25 DOWN 31 32 32 33 31 31 30
IGL 267.55 DOWN 268 271 274 280 265 262 256
INDHOTEL 68.65 DOWN 69 70 71 72 68 67 65
INDIACEM 98.05 DOWN 98 100 103 107 96 93 89
INDUSINDBK 365.45 UP 363 370 374 385 359 352 341
INFY 2603.25 UP 2579 2636 2668 2757 2547 2490 2402
IOB 82.3 UP 81 84 85 89 80 77 73
IOC 254.35 UP 254 255 256 259 253 251 248
IRB 155.3 UP 154 157 159 165 152 148 143
ITC 274.9 UP 274 277 279 283 273 270 266
IVRCLINFRA 48.95 UP 48 50 51 54 47 46 43
JINDALSTEL 438.85 UP 436 446 453 470 429 419 401
JISLJALEQS 70.5 UP 70 71 72 73 70 69 67
Keynote Capitals Ltd.
The Ruby, 9th Floor,
Senapati Bapat Marg,
Dadar (W), Mumbai, India – 400028
Tel: 30266000 / 22694322
www.keynotecapitals.com
3. NSE Futures Intra-day Technical Levels For 03/10/12 _
F&O Expiry 25/10/12 * Intra
Close (Fut) Day Pivot Resistance Support
Company 01/10/12 Trend Point R1 R2 R3 S1 S2 S3
JPASSOCIAT 85.65 UP 84 87 89 93 83 80 76
JPPOWER 35.65 UP 35 36 36 37 35 35 34
JSWENERGY 60.95 UP 61 62 62 64 60 59 58
JSWSTEEL 738.8 DOWN 745 758 777 809 726 713 681
JUBLFOOD 1356.25 DOWN 1363 1376 1396 1429 1343 1330 1298
KOTAKBANK 649.4 UP 649 655 660 672 643 637 626
KTKBANK 111.8 UP 112 114 117 122 109 106 101
LICHSGFIN 274.55 DOWN 277 282 289 301 270 265 253
LT 1615.4 UP 1608 1627 1638 1667 1597 1579 1549
LUPIN 602.95 UP 602 607 611 621 597 592 582
M&M 868.65 DOWN 869 875 881 893 863 857 845
MARUTI 1365.15 DOWN 1367 1382 1400 1432 1350 1335 1303
MCDOWELL-N 1248.55 UP 1247 1266 1283 1319 1230 1211 1175
MCLEODRUSS 329.7 UP 328 333 336 344 325 320 312
MPHASIS 417.15 UP 413 425 432 451 406 394 376
MRF 10317.95 DOWN 10339 10379 10439 10539 10279 10239 10139
NCC 48.95 UP 49 50 51 53 48 47 45
NHPC 19.95 UP 20 20 20 21 20 19 19
NMDC 193.5 DOWN 195 197 201 206 191 189 184
NTPC 170.8 UP 170 172 173 177 169 167 164
OFSS 3125.55 UP 3102 3172 3218 3334 3056 2986 2870
ONGC 280 DOWN 280 282 284 287 278 277 273
OPTOCIRCUI 130.2 DOWN 131 132 134 137 129 127 124
ORIENTBANK 298.2 DOWN 299 302 305 311 296 294 288
PANTALOONR 212.35 DOWN 212 215 218 224 209 207 201
PEL 465.85 DOWN 468 471 477 486 462 459 450
PETRONET 161.6 UP 161 163 164 168 160 158 154
PFC 189.1 UP 189 191 193 197 187 184 180
PNB 838.75 DOWN 841 847 855 868 833 827 813
POWERGRID 120.8 UP 121 122 123 125 120 118 116
PTC 70.8 DOWN 71 72 72 74 70 70 68
PUNJLLOYD 56.1 UP 56 57 58 60 55 54 52
RANBAXY 543.65 UP 541 550 555 570 535 526 511
RAYMOND 396.3 UP 396 399 401 406 393 390 385
RCOM 63.65 DOWN 64 65 66 69 63 62 60
RECLTD 216.15 DOWN 217 220 223 229 214 211 205
RELCAPITAL 442.3 UP 438 451 460 483 429 415 393
RELIANCE 840 DOWN 841 846 852 863 835 829 818
RELINFRA 557.5 UP 550 566 575 601 541 525 500
RENUKA 37.05 UP 37 37 38 39 36 36 35
RPOWER 99.25 UP 99 101 102 105 97 95 92
SAIL 86.7 DOWN 87 88 89 91 86 85 83
SBIN 2283.65 UP 2275 2301 2318 2361 2258 2232 2189
SCI 59.7 UP 60 61 61 63 59 58 56
Keynote Capitals Ltd.
The Ruby, 9th Floor,
Senapati Bapat Marg,
Dadar (W), Mumbai, India – 400028
Tel: 30266000 / 22694322
www.keynotecapitals.com
4. NSE Futures Intra-day Technical Levels For 03/10/12 _
F&O Expiry 25/10/12 * Intra
Close (Fut) Day Pivot Resistance Support
Company 01/10/12 Trend Point R1 R2 R3 S1 S2 S3
SESAGOA 174.75 UP 174 176 178 182 172 170 166
SIEMENS 715.35 UP 714 718 722 729 711 706 699
SINTEX 66.5 DOWN 67 68 69 70 66 65 63
SOUTHBANK 23.3 UP 23 24 24 24 23 23 22
SRTRANSFIN 626.3 UP 625 631 635 645 620 614 604
STER 101.1 UP 100 102 103 106 99 97 94
SUNPHARMA 698.2 DOWN 699 705 711 723 693 687 675
SUNTV 360.55 UP 358 364 368 378 355 349 339
SUZLON 18.05 UP 18 19 20 23 16 15 12
SYNDIBANK 113.65 UP 112 115 117 121 111 108 104
TATACHEM 323 DOWN 323 324 326 328 322 321 318
TATACOMM 245.5 UP 245 248 250 255 243 240 235
TATAGLOBAL 146.45 UP 146 148 150 154 144 142 138
TATAMOTORS 275.5 UP 274 279 282 289 271 266 258
TATAMTRDVR 166.3 UP 165 168 170 175 163 160 155
TATAPOWER 106.8 UP 107 108 109 111 106 105 103
TATASTEEL 400.35 UP 399 405 409 419 395 389 379
TCS 1311 UP 1309 1318 1326 1342 1302 1293 1276
TECHM 1007.35 UP 1002 1030 1053 1104 979 951 900
TITAN 262.7 UP 263 266 269 275 260 257 250
UCOBANK 80.1 UP 79 82 83 87 78 75 72
ULTRACEMCO 2022.2 UP 2005 2045 2068 2130 1983 1943 1881
UNIONBANK 209.05 UP 209 211 212 216 207 205 202
UNIPHOS 132.55 UP 132 134 135 137 131 130 128
UNITECH 24.95 UP 25 25 26 27 24 24 22
VIJAYABANK 58.35 UP 58 59 60 63 57 55 53
VOLTAS 123.05 DOWN 124 126 128 132 122 120 116
WELCORP 100.95 UP 101 103 105 110 99 96 91
WIPRO 385.95 UP 384 390 393 402 381 376 367
Keynote Capitals Ltd.
The Ruby, 9th Floor,
Senapati Bapat Marg,
Dadar (W), Mumbai, India – 400028
Tel: 30266000 / 22694322
www.keynotecapitals.com
5. NSE Futures Intra-day Technical Levels For 03/10/12 _
F&O Expiry 25/10/12 * Intra
Close (Fut) Day Pivot Resistance Support
Company 01/10/12 Trend Point R1 R2 R3 S1 S2 S3
YESBANK 395.95 UP 392 401 406 419 387 378 365
ZEEL 198.5 UP 198 200 202 206 197 195 191
Sanjay Bhatia (AVP – Technical Research), Email Id sanjay@keynotecapitals.net
Pivot Point: Intra- Day Trading Tool. - The key to the use of this tool is the use of Stop Loss
Intra Day Trend: It is valid only till the point where Price trades above Pivot Point. For Eg. “UP” would be valid till Price
remains above Pivot Point. It would become “DOWN” in event Price trades below Pivot Point.
Pivot Point (PP): This is a trigger point for Intra Day Buy / Sell based on the price range of the previous day.
R1: Resistance 1: 1st Resistance level over Pivot Point, R2: Resistance 2: Next Resistance level after R1.
R3: Resistance 3: Next Resistance level after R2.
S1: Support 1: 1st Support level after Pivot Point, S2: Support 2: Next Support level after S1.
S3: Support 3: Next Support level after S2.
Note: As per this tool, the trader should take BUY position just above the Pivot Point and keep the Pivot Point level as stop
loss and the first target would be R1 level (Resistance 1). If R1 is crossed then R2 (Resistance 2) becomes the next target
with the stop loss placed at R1 level. If R2 is crossed then R3 (Resistance 3) becomes the next target with the stop loss
placed at R2 level.
Similarly if price goes below the Pivot Point the trader should take a SELL position and keep the Pivot Point level as the
stop loss and the first target would be S1 level (Support 1). If S1 level is breached then S2 level (Support 2) becomes the
next target with the stop loss placed at S1 level. If S2 level is breached then S3 level (Support 3) becomes the next target
with the stop loss placed at S2 level.
Disclaimer: This document is not for public distribution and has been furnished to you solely for your information and must not be reproduced
or redistributed to any other person. Persons into whose possession this document may come are required to observe these restrictions. This
material is for the personal information of the authorized recipient, and we are not soliciting any action based upon it. This report is not to be
construed as an offer to sell or the solicitation of an offer to buy any security in any jurisdiction where such an offer or solicitation would be
illegal. It is for the general information of clients of Keynote Capitals Ltd. It does not constitute a personal recommendation or take into account
the particular investment objectives, financial situations, or needs of individual clients. We have reviewed the report, and in so far as it includes
current or historical information, it is believed to be reliable though its accuracy or completeness cannot be guaranteed. Neither Keynote
Capitals Ltd., nor any person connected with it, accepts any liability arising from the use of this document. The recipients of this material should
rely on their own investigations and take their own professional advice. Price and value of the investments referred to in this material may go up
or down. Past performance is not a guide for future performance. Certain transactions -including those involving futures, options and other
derivatives as well as non-investment grade securities - involve substantial risk and are not suitable for all investors. Reports based on technical
analysis centers on studying charts of a stock’s price movement and trading volume, as opposed to focusing on a company’s fundamentals and
as such, may not match with a report on a company’s fundamentals. Opinions expressed are our current opinions as of the date appearing on
this material only. While we endeavor to update on a reasonable basis the information discussed in this material, there may be regulatory,
compliance, or other reasons that prevent us from doing so. Prospective investors and others are cautioned that any forward-looking
statements are not predictions and may be subject to change without notice. Our proprietary trading and investment businesses may make
investment decisions that are inconsistent with the recommendations expressed herein. We and our affiliates, officers, directors, and
employees world wide may: (a) from time to time, have long or short positions in, and buy or sell the securities thereof, of company (ies)
mentioned herein or (b) be engaged in any other transaction involving such securities and earn brokerage or other compensation or act as a
market maker in the financial instruments of the company (ies) discussed herein or act as advisor or lender / borrower to such company (ies) or
have other potential conflict of interest with respect to any recommendation and related information and opinions. The analyst for this report
certifies that all of the views expressed in this report accurately reflect his or her personal views about the subject company or companies and
its or their securities, and no part of his or her compensation was, is or will be, directly or indirectly related to specific recommendations or views
expressed in this report. No part of this material may be duplicated in any form and/or redistributed without Keynote Capitals Ltd’s., prior written
consent.
Keynote Capitals Ltd.
The Ruby, 9th Floor,
Senapati Bapat Marg,
Dadar (W), Mumbai, India – 400028
Tel: 30266000 / 22694322
www.keynotecapitals.com