Optimal Capital Structure Analysis & Valuation Sensitivity Analysis
•
2 j'aime•1,353 vues

Optimal Capital Structure Analysis & Valuation Sensitivity Analysis

Recommandé
Contenu connexe
Plus de Leon Liang
Plus de Leon Liang (20)
Optimal Capital Structure Analysis & Valuation Sensitivity Analysis
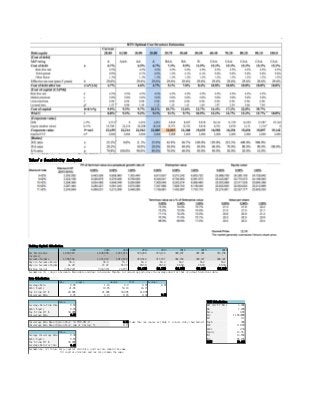
- 1. Yahoo's Sensitivity Analysis Working Capital Calculation 2009 2010 2011 2012 2013 2014 2015 2016 Net Receivables 1,003,362 1,028,900 1,037,474 346,200 353,124 360,187 367,391 374,738 Inventory - - - - - - - - Accounts Payable 1,306,584 1,371,216 1,012,639 369,840 377,237 384,782 392,477 400,327 Days in Accounts Receivable 58.3 58.6 75.7 64.2 64.2 64.2 64.2 64.2 Days in Accounts Payable 41.20 77.27 87.29 68.59 68.59 68.59 68.59 68.59 Working Capital (303,222) (342,316) 24,835 (23,640) (24,113) (24,595) (25,087) (25,589) Assumption (1) : days in Accounts Receivable and days in Accounts Payable in forcasting period are the average days for that of actual historical data. Beta Calculation eBay google amazon IACI Average Leverage Beta 0.96 1.18 0.9 0.45 0.87 Debt/ Equity 21.66 10.05 53.43 44.74 Tax % from 10- K 20.00% 21.00% 35.00% 41.00% Unleverage Beta 0.05 0.13 0.03 0.02 0.06 Yahoo WACC Calculation Leverage Beta From Yahoo 0.87 Rrf (10-Y T-Bill) 4.50% Debt/ Equity 0.85 Rm 7.20% Tax % from 10- K 30.00% Beta 0.91 Unleverage Beta 0.55 Rcs 11.05200% Rd 0.1 Unleverage Beta Mean (Option One)= (0.55+0.06)/2= 0.30 (take this one causes we think it is more risky than before) Tax% 30% Unleverage Beta Mean (Option Two)= sum of 5 betas/ 5= 0.15 D/E 0.1792 Debt 2.54 Yahoo Equity 14.56 Average Unleverage Beta 0.30 Wd 14.85% Debt/ Equity 0.85 Wcs 85.15% Tax % from 10- K 30.00% WACC 10.44% Leverage Beta for this Case 0.48 Assumptions: (2) future beta, capital structure, and tax rate remain the same (3) capital structure and tax rate remain the same
- 2. FCF Calculatioin 2009 2010 2011 2012 2013 2014 2015 2016 Revenue 6,460,315 6,324,651 4,984,199 5,083,883 5,185,561 5,289,272 5,395,057 5,502,958 COGS 2,871,746 2,627,545 1,502,650 1,968,223 2,007,588 2,047,740 2,088,694 2,130,468 EBIT 574,220 1,070,393 827,516 718,782 733,158 747,821 762,778 778,033 CSGS/ Revenue 44.45% 41.54% 30.15% 38.71% 38.71% 38.71% 38.71% 38.71% EBITDA/ Revenue 20.33% 27.30% 29.16% 25.60% 25.60% 25.60% 25.60% 25.60% Capex/ Revenue 6.71% 11.29% 11.90% 9.97% 9.97% 9.97% 9.97% 9.97% EBIT/ Revenue 8.89% 16.92% 16.60% 14.14% 14.14% 14.14% 14.14% 14.14% EBITDA 1,313,075 1,726,790 1,453,380 1,301,263 1,327,288 1,353,834 1,380,910 1,408,529 Less D & A (738,855) (656,397) (625,864) (582,480) (594,130) (606,013) (618,133) (630,496) EBIT 574,220 1,070,393 827,516 718,782 733,158 747,821 762,778 778,033 Provision for Taxes (30%) (219,321) (221,523) (241,767) (215,635) (219,947) (224,346) (228,833) (233,410) NOPAT 354,899 848,870 585,749 503,148 513,211 523,475 533,944 544,623 Plus D & A 738,855 656,397 625,864 582,480 594,130 606,013 618,133 630,496 Less Change in Net W/C 1,211,775 39,094 (367,151) 48,475 473 482 492 502 Less Capex (433,795) (714,078) (593,294) (506,840) (516,977) (527,317) (537,863) (548,620) FCF 1,871,734 830,283 251,168 627,263 590,836 602,653 614,706 627,000 Assumptions: (4) Revenue has 2% growth in future (5) COGS, EBITDA, Capex, EBIT all have fixed multiple with revenue; multiples are the average of historical mean (6) tax rate remain as 30% Terminal Value Multiple Method PV of TV at 2011 EBITDA EV Discount Rate (WACC) PV of FCFs 0.3 0.35 0.4 0.3 0.35 0.4 9.94% 2,324,277 4,388,124 5,119,478 5,850,832 6,712,401 7,443,755 8,175,109 10.19% 2,309,471 4,280,426 4,993,831 5,707,235 6,589,897 7,303,301 8,016,706 10.44% 2,294,816 4,177,889 4,874,204 5,570,518 6,472,704 7,169,019 7,865,334 10.69% 2,280,310 4,080,149 4,760,174 5,440,198 6,360,459 7,040,483 7,720,508 10.94% 2,265,951 3,986,877 4,651,357 5,315,837 6,252,829 6,917,308 7,581,788 TV/ EV Value per Share 0.3 0.35 0.4 0.3 0.35 0.4 65% 69% 72% 5.74 6.36 6.99 65% 68% 71% 5.63 6.24 6.85 65% 68% 71% 5.53 6.13 6.72 64% 68% 70% 5.44 6.02 6.60 64% 67% 70% 5.34 5.91 6.48 Assumptions: (7) All FCFs flow in at each year end (8) multiple is low for the reason of FCF/ TV= 5%- 10% (9) capital structure, cash, and shares outstanding remain the same (10) adjustment on minority interest is same as pepetuity growth method as follows Adjustment on Equity by Cash, Debt, and Minority Inerest Alibaba Interest (42%) 2,522 Less Mino. Int. -40,280 Less Alibaba Repo (20%) 1,201 Less Debt (3) Gain on Alibaba Contract 4,500,000 Plus Cash 1,562,390 Adjustment on Equity Value 4,498,799 Plus Adjustment 4,498,799 Total Net Adjust. 6,020,907 Shares On Hand 1,170,000 Pepetual Growth % 2.00% Assumptions: (11) Pepetual growth of 2% revenue forecast Perpetuity Growth Method Mid- Year PV of TV at 2011 EBITDA EV Discount Rate (WACC) PV of FCFs 0.01% 0.05% 0.10% 0.01% 0.05% 0.10% 9.94% 2,324,277 6,317,232 6,345,329 6,380,771 8,641,509 8,669,606 8,705,048 10.19% 2,309,471 6,162,036 6,188,827 6,222,615 8,471,507 8,498,298 8,532,086 10.44% 2,294,816 6,014,283 6,039,860 6,072,110 8,309,099 8,334,676 8,366,926 10.69% 2,280,310 5,873,450 5,897,896 5,928,714 8,153,759 8,178,206 8,209,024 10.94% 2,265,951 5,739,061 5,762,452 5,791,934 8,005,012 8,028,403 8,057,885 TV/ EV Value per Share 0.01% 0.05% 0.10% 0.01% 0.05% 0.10% 73% 73% 73% 7.39 7.41 7.44 73% 73% 73% 7.24 7.26 7.29 72% 72% 73% 7.10 7.12 7.15 72% 72% 72% 6.97 6.99 7.02 72% 72% 72% 6.84 6.86 6.89 Assumptions: (12) pepetual growth rate is low for FCF/TV= 5%- 10%