90 day-ma-gold mnt-regression
•
1 like•356 views

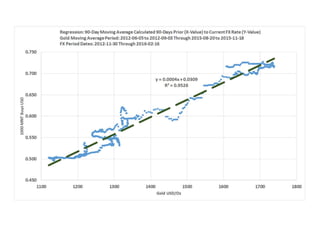
This chart plots the 90-pay prior Moving Average price of Gold, 90-days prior to the Mongolian Tugrik spot price. In other words, it plots the average gold price from 180 to 90 pays prior of the day's gold price. The regression fit is perhaps too close to be coincidental, with an R-Value (Pearson Correlation) of 0.97 .