LEG101G USP Convention Members Infographic Factsheet
1. www.usp.orgLEG101G_2015-10
Canada (11)
Argentina (3)
Australia (1)
Brazil (7)
China (3)
Egypt (1)
Ethiopia (1)
France (1)
Turkey (1)
Ghana (1)
Nigeria (1)
India
(4)
Jordan (2)
Saudi
Arabia (1)
Kazakhstan (1)
Uzbekistan (1)
Mexico (3)
Colombia (1)
Morocco (1)
Russia (2)
Sierra Leone
(1)
Sweden (1)
Switzerland (2)
U.K. (2)
Belgium (2)
Tanzania (1)Uganda (1)
Ukraine (2)
Belarus (1)
Peru (1)
Chile (1)
South Korea (1)
Indonesia
(1)
Thailand
(1)
Japan (1)
Philippines (1)
Taiwan (1)
Vietnam (1)
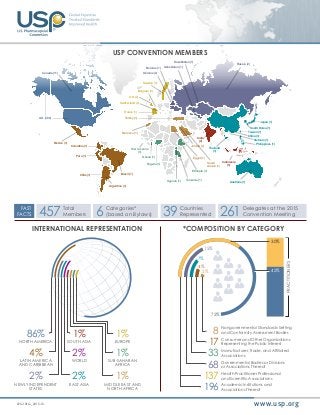
U.S. (388)
FAST
FACTS
Total
Members457 Countries
Represented39 Delegates at the 2015
Convention Meeting261Categories*
(based on Bylaws)6
USP CONVENTION MEMBERS
INTERNATIONAL REPRESENTATION *COMPOSITION BY CATEGORY
86%
NORTH AMERICA
4%
LATIN AMERICA
AND CARIBBEAN
2%
NEWLY INDEPENDENT
STATES
1%
SOUTH ASIA
2%
WORLD
2%
EAST ASIA
1%
EUROPE
1%
SUB-SAHARAN
AFRICA
1%
MIDDLE EAST AND
NORTH AFRICA
Nongovernmental Standards-Setting
and Conformity Assessment Bodies
Consumer and Other Organizations
Representing the Public Interest
Manufacturer, Trade, and Affiliated
Associations
Governmental Bodies or Divisions
or Associations Thereof
Health Practitioner Professional
and Scientific Associations
Academic Institutions and
Associations Thereof
8
17
33
68
137
196
72%
15%
2%
4%
7%
30%
42%
PRACTITIONERS