Outlook for Week of December 3, 2018
•
0 likes•3,045 views

Free weekly newsletter with outlook and brief comments for world stock markets. Weekly reversal levels for stocks, gold and currencies. This method was designed to keep you on the right side of the market most of the time, letting the winners run while avoiding big losses.

Recommended
Recommended
More Related Content
More from LunaticTrader
More from LunaticTrader (17)
Recently uploaded
Recently uploaded (20)
Outlook for Week of December 3, 2018
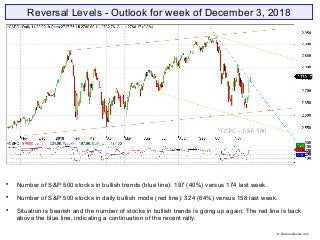
- 1. Reversal Levels - Outlook for week of December 3, 2018 Number of S&P 500 stocks in bullish trends (blue line): 197 (40%) versus 174 last week. Number of S&P 500 stocks in daily bullish mode (red line): 324 (64%) versus 158 last week. Situation is bearish and the number of stocks in bullish trends is going up again. The red line is back above the blue line, indicating a continuation of the recent rally. © Reversallevels.com
- 2. ELC: down. BMO: up. Blue snake: down. Bearish but bouncing back above the Repellor line. BMO is turning up from a very oversold low, making it increasingly likely that we have seen the bottom for at least a while. © Reversallevels.com S&P 500 Weekly chart
- 3. Speculative Buy signal for Australia AOI. Most major markets are in ongoing bearish trends. Bovespa is bullish with upward MoM. Bonds TLT are weak bearish with upward MoM. May have bottomed. Gold is weak bearish, but needs urgent follow through to avoid a bearish continuation if MoM turns back down. EURUSD stays fully bearish with downward MoM. Oil is in a bearish trend with no signs of a bottom. Down 25% since our weekly Sell signal 5 weeks ago. Wheat is holding the 500 level and changes to weak bearish with upward MoM. © Reversallevels.com Major indices
- 4. Bullish divergence for Turkey BIST100. MoM is turning up for a lot of markets. That suggests the recent declines are over or on hold. We can become a bit more optimistic for short to medium term, but I would still wait for Buy signals. World markets © Reversallevels.com
- 5. Weak Buy signal for V. Possible fake-out move. Partial profits signal for WBA. A 23% gain in 18 weeks. 15 stocks bullish, up from 14 last week. Below 15 = mild bearish market. See article: Keeping an eye on the Dow stocks Number of bullish stocks gets back to 15. We want to see more than 20 bullish stocks to put the recent declines behind us. . 30 Dow Jones Industrials stocks © Reversallevels.com
- 6. Sell signal for USDINR. Bearish divergence for USDCHF. Currencies tend to make long trending moves, so we don’t get weekly Buy or Sell signals so often. For daytraders or swing traders: if you do your trading in the direction of the weekly trend you are likely to do well in the long run. So, try to buy the pullbacks in currencies pairs that are in weekly bullish trends and sell the rips during weekly bearish trends. Forex & Crypto © Reversallevels.com
- 7. On Twitter: http://twitter.com/lunatictrader1 On Facebook: https://wwww.facebook/Reversallevels/ On Stocktwits: http://stocktwits.com/LunaticTrader Website: Reversallevels.com For daily comments and questions you can find us here: © Reversallevels.com Disclaimer Investing in stocks, forex or commodities is risky. No guarantee can be given that the opinions or predictions given in this presentation will be correct. Reversallevels.com cannot in any way be responsible for eventual losses you may incur if you trade based on the given information. Simulated trading programs in general are subject to the fact that they are designed with the benefit of hindsight. No representation is being made that any account will or is likely to achieve profits or losses similar to those shown. Trade at your own risk and responsibility. Subscription service Daily reversal levels for over 3000 stocks and ETF are available by monthly subscription. For less than $1 a day you can become a more efficient investor: 1 Month ($22) 6 Months ($110) 1 Year ($199) Comes with full instructions and strategies for using the reversal levels and MoM indicator in your own trading. This is an honest method with limited risk, not a get rick quick formula. Give it a try.