SlideShare a Scribd company logo
1 of 30
Download to read offline
3,300
3,400
3,500
3,600
4,200
4,300
4,400
4,500
U.S. Department of the Interior
U.S. Geological Survey
Scientific Investigations Report 2013­­–5131
Characterization of the Marcellus Shale Based on
Computer-Assisted Correlation of Wireline Logs
in Virginia and West Virginia
Cover.  An example of correlation strength between two well logs (each with accompanying gamma-ray and
bulk-density data), determined using the Correlator 5.2 program. Colors indicate correlation strength in percent,
blue to orange being weakest to strongest, respectively.
Characterization of the Marcellus Shale Based on
Computer-Assisted Correlation of Wireline Logs
in Virginia and West Virginia
By Catherine B. Enomoto, Ricardo A. Olea, and James L. Coleman, Jr.
Scientific Investigations Report 2013–5131
U.S. Department of the Interior
U.S. Geological Survey
U.S. Department of the Interior
SALLY JEWELL, Secretary
U.S. Geological Survey
Suzette M. Kimball, Acting Director
U.S. Geological Survey, Reston, Virginia: 2014
For more information on the USGS—the Federal source for science about the Earth, its natural and living
resources, natural hazards, and the environment, visit http://www.usgs.gov or call 1–888–ASK–USGS.
For an overview of USGS information products, including maps, imagery, and publications,
visit http://www.usgs.gov/pubprod
To order this and other USGS information products, visit http://store.usgs.gov
Any use of trade, firm, or product names is for descriptive purposes only and does not imply endorsement by the
U.S. Government.
Although this information product, for the most part, is in the public domain, it also may contain copyrighted materials
as noted in the text. Permission to reproduce copyrighted items must be secured from the copyright owner.
Suggested citation:
Enomoto, C.B., Olea, R.A., and Coleman, J.L., Jr., 2014, Characterization of the Marcellus Shale based on computer-
assisted correlation of wireline logs in Virginia and West Virginia: U.S. Geological Survey Scientific Investigations
Report 2013–5131, 21 p., available at http://dx.doi.org/10.3133/sir20135131.
ISSN 2328-0328 (online)
iii
Contents
Abstract............................................................................................................................................................1
Introduction ....................................................................................................................................................1
Stratigraphy............................................................................................................................................4
Structural Geology.................................................................................................................................7
Exploration and Production History in the Study Area....................................................................8
Procedures......................................................................................................................................................9
Results and Analyses...................................................................................................................................13
Conclusions...................................................................................................................................................18
Acknowledgments........................................................................................................................................18
References Cited..........................................................................................................................................18
Figures
	 1.  Map of the study area showing the assessment units from the recent
assessment of undiscovered oil and gas resources in the Devonian
Marcellus Shale, the thickness of radioactive black shale in the undivided
Marcellus Shale and Skaneateles Shale, and the apparent thickness of
the Millboro Shale interpreted from the nine wireline logs included in this study.............2
	 2.  Photograph of a third-order fold in the Brallier Formation in Hampshire
County, West Virginia....................................................................................................................3
	 3.  Map showing regional structural geology of eastern West Virginia and
western Virginia, including major tectonic features, the location of the
cross section shown on figure 4, and the location of the study area
shown in figure 7............................................................................................................................5
	 4.  Cross section across Broadtop synclinorium and Nittany anticlinorium
illustrating first- and third-order folds within middle and lower
Paleozoic strata.............................................................................................................................6
Plates
[As separate files; click link to access]
	 1.  Wireline well logs through Middle Devonian shales in Highland and Rockingham
Counties, Virginia, and Pendleton and Hardy Counties, West Virginia
	 2.  Cross section created by the Correlator program on the basis of calculated correlation
strength between well wireline logs through Middle Devonian shales in Highland and
Rockingham Counties, Virginia, and Pendleton and Hardy Counties, West Virginia
	 3.  Cross section created by the Correlator program by recoding correlation strength in
plate 2 to denote stratigraphic intervals using well wireline logs through Middle Devo-
nian shales in Highland and Rockingham Counties, Virginia, and Pendleton and Hardy
Counties, West Virginia
	 4.  Cross section created by the Correlator program on the basis of persistent correlation
strength between well wireline logs through Middle Devonian shales in Highland and
Rockingham Counties, Virginia, and Pendleton and Hardy Counties, West Virginia
iv
	 5.  Schematic stratigraphic chart showing Lower Devonian to Upper
Devonian strata of the central Valley and Ridge and Appalachian
Plateaus provinces in western Virginia and eastern West Virginia......................................7
	 6.  Digital wireline log curves for the Fulk No. 1 well illustrating the initial
interpretation for locating the tops of the Millboro Shale, Needmore
Shale, and Oriskany Sandstone using the criteria described in the text...........................10
	 7.  Map of study area showing the outcrop area of the Middle Devonian
Marcellus Shale or Millboro Shale with Needmore Shale or Huntersville
Chert, regional faults, and the locations of the nine wells used in this
study and the cross sections.....................................................................................................11
	 8.  Wireline log showing gamma-ray and dipmeter measurements in
well HI–0004, Highland County, Virginia...................................................................................16
Tables
	 1.  Wells used in this study................................................................................................................3
	 2.  Apparent thickness of interpreted intervals estimated from wireline logs.........................4
	 3.  Percentage of the interval where correlation strength between well pairs
exceeded 60 percent...................................................................................................................14
	 4.  Mean gamma-ray values, calculated for each interval........................................................14
	 5.  Mean bulk-density values calculated for each interval.......................................................14
Conversion Factors
Multiply By To obtain
Length
foot (ft) 0.3048 meter (m)
meter (m) 3.281 foot (ft)
kilometer (km) 0.6214 mile (mi)
Volume
cubic foot (ft3
) 0.02832 cubic meter (m3
)
Density
gram per cubic centimeter (g/cm3
,
or g/cc)
62.4220 pound per cubic foot (lb/ft3
)
Gas volume measurements are shown using the standard industry abbreviations of
MMCF (millions of cubic feet) or BCF (billions of cubic feet).
Abstract
The Middle Devonian Marcellus Shale in the Appala-
chian basin extends from central Ohio on the west to eastern
New York on the east, and from north-central New York on
the north to northern Tennessee on the south. Its thickness
ranges from 0 feet (ft) where it pinches out to the west to
as much as 700 ft in its eastern extent. Within the Broadtop
synclinorium, the thickness of the Marcellus Shale ranges
from 250 to 565 ft. Although stratigraphic complexities have
been documented, a significant range in thickness most likely
is because of tectonic thickening from folds and thrust faults.
Outcrop studies in the Valley and Ridge and Appalachian
Plateaus provinces illustrate the challenges of interpreting the
relation of third-order faults, folds, and “disturbed” zones to
the regional tectonic framework. Recent field work within the
Valley and Ridge province determined that significant faulting
and intraformational deformation are present within the Mar-
cellus Shale at the outcrop scale. In an attempt to determine
if this scale of deformation is detectable with conventional
wireline logs, petrophysical properties (primarily mineralogy
and porosity) were measured by interpretation of gamma-ray
and bulk-density logs. The results of performing a statisti-
cal correlation of wireline logs from nine wells indicated that
there are discontinuities within the Millboro Shale (undiffer-
entiated Marcellus Shale and Mahantango Formation) where
there are significant thickness differences between wells. Also,
some intervals likely contain mineralogy that makes these
zones more prone to layer-shortening cleavage duplexes. The
Correlator program proved to be a useful tool in a region of
contractional deformation.
Introduction
Many of the geologists who mapped the eastern Appa-
lachian basin collectively described the Marcellus Shale as a
dark-gray to black, thinly laminated, fissile, pyritic shale with
interbeds of dark-gray, argillaceous limestone or calcareous
shale, containing limestone concretions and sparse fossils
(Dean and others, 1985; Hasson and Dennison, 1988; Schultz,
1997; Rader and Gathright, 2001). The regional thickness of
the Marcellus Shale ranges from 0 feet (ft) where it pinches
out in east-central Ohio and western West Virginia to as much
as 700 ft in southeastern New York (Roen, 1984; Milici and
Swezey, 2006; Boyce and Carr, 2009; Ohio Department of
Natural Resources, 2010; Smith and Leone, 2010). Within
the Broadtop synclinorium (Jacobeen and Kanes, 1974),
geologists estimated that the thickness of the Marcellus Shale
ranged from 250 to 565 ft (Rader and Gathright, 2001; Rader
and others, 2001; Enomoto, 2009) (fig. 1). The range of the
measurements is most likely the result of folding and fault-
ing within the Middle to Upper Devonian shale, especially
within the Valley and Ridge province (fig. 2); also, Roen
(1984) reported the thickness of radioactive black shale in
the undivided Skaneateles Shale and Marcellus Shale (fig. 1),
whereas Enomoto (2009) reported the uncorrected wireline log
thickness of the Millboro Shale (tables 1, 2).
The Valley and Ridge province of the central Appalachian
basin is characterized by thin-skinned structural deformation
(Rich, 1934; Rodgers, 1949, 1963); the locations of two of the
major décollements underlying the Valley and Ridge are inter-
preted to be within shale of the Lower Cambrian Rome For-
mation and Upper Ordovician Martinsburg Formation (Harris
and Milici, 1977). Another major décollement exists southwest
of the study area in Middle to Upper Devonian shale (Rich,
1934; Harris and Milici, 1977; Kulander and Dean, 1986). The
regional map showing structural features and the cross section
of Kulander and Dean (1986) (figs. 3, 4) depict the overall
structural style of the western Valley and Ridge province. The
cross section traverses west to east from Pocahontas County,
West Virginia, to Augusta County, Virginia, and provides a
point of reference for the structural features included in the
study area.
Formations consisting of mostly shale and mudstone and
commonly exhibiting structures indicative of ductile deforma-
tion are associated with the major folds caused by the move-
ment on these décollement surfaces. Nickelsen (1963) defined
folds with wavelengths between 7 and 10 miles (mi) as “first-
order folds,” folds with wavelengths between 1.5 and 2 mi as
Characterization of the Marcellus Shale Based on
Computer-Assisted Correlation of Wireline Logs
in Virginia and West Virginia
By Catherine B. Enomoto, Ricardo A. Olea, and James L. Coleman, Jr.
2   Characterization of the Marcellus Shale Based on Compter-Assisted Correlation of Wireline Logs in Virginia and West Virginia
468
520
563
317
445
251
564
458
447
0
25
50
75
100
100
100
50
125
150
200
200
125
75
125
100
75
0 100 KILOMETERS25 50 75
0 25 50 75 100 MILES
VIRGINIA
WEST
VIRGINIA
OHIO
KENTUCKY
MARYLAND
Washington, D.C.
PENNSYLVANIA
NEW YORK
NEW
JERSEY
DELAWARE
UNITED STATES
CANADA
Lake Erie
AtlanticOcean
42°
82° 80° 78° 76°
40°
38°
EXPLANATION
Foldbelt Marcellus AU—A few to more than 350 feet thick
Interior Marcellus AU—More than 50 feet thick
Western Margin Marcellus AU—Less than 50 feet
thick
Isoline showing thickness of Marcellus Shale and
Skaneateles Shale (undivided)—Contour interval
is 25 feet
Well—Number indicates thickness of Millboro Shale,
in feet (see tables 1 and 2)
Assessment unit (AU)
100
445
Base from ESRI digital data, 2007, 1:500,000
Geographic projection
North American Datum of 1983
Figure 1.  Map of the study area showing the assessment units from the recent assessment of undiscovered oil and gas resources
in the Devonian Marcellus Shale (Coleman and others, 2011; U.S. Geological Survey, 2011), the thickness of radioactive black shale
in the undivided Marcellus Shale and Skaneateles Shale (Roen, 1984), and the apparent thickness of the Millboro Shale interpreted
from the nine wireline logs included in this study (Enomoto, 2009). Contour lines are in feet (ft).
Introduction   3
Figure 2.  Photograph of a third-order fold in the Brallier Formation in Hampshire County, West
Virginia. This fold is typical of those found in Devonian shale in the Valley and Ridge province. The
location is approximately 350 feet northeast of the ford over the Cacapon River by Dave Mooreland
Road, approximately 2 miles from the village of Levels (approximate location lat 39°28'17"N.,
long 78°31'27"W.).
Table 1.  Wells used in this study.
Regulatory
number
API number Operator Well name State Latitude Longitude
HI–0003 4509123504 Cabot Oil & Gas
Corp.
George Washington
National Forest
No. 1
Virginia 38°20'0.24" 79°44'43.80"
HI–0001 4509120036 Pennzoil United,
Inc.
Bertha Smith No. 1 Virginia 38°24'50.76" 79°20'21.12"
RO–0018 4516520171 Crab Run Gas
Co.
George Washington
National Forest
No. 3
Virginia 38°30'23.40" 79°9'16.20"
RO–0024 4516520384 Merrill Natural
Resources, Inc.
Floyd Fulk No. 1 Virginia 38°39'5.76" 78°59'33.72"
RO–0021 4516520373 Yankee Explora-
tion, Inc.
Moyers No. 1 Virginia 38°48'21.96" 78°56'41.64"
HD–0015 4703100015 United Fuel Gas William J.B. Orr
No. 1
West Virginia 39°1'31.15" 78°49'3.29"
PD–0010 4707100010 Union Drilling
Co.
Monongahela
National Forest
No. 1
West Virginia 38°54'36.50" 79°20'50.82"
PD–0011 4707100011 Berea Oil & Gas
Corp.
R.C. & M.M. Hed-
rick No. 1
West Virginia 38°50'42.36" 79°31'28.74"
HI–0004 4509123522 Cabot Oil & Gas
Corp.
Red Oak Ranch
No. 1
Virginia 38°27'40.68" 79°40'3.72"
4   Characterization of the Marcellus Shale Based on Compter-Assisted Correlation of Wireline Logs in Virginia and West Virginia
“second-order folds,” and folds with wavelengths less than 0.5
mi as “third-order folds.” “Disturbed” zones were documented
in western Maryland and eastern West Virginia by Jacobeen
and Kanes (1974); in central Pennsylvania, western Mary-
land, and northern West Virginia by Pohn and Purdy (1988);
and in northern West Virginia by Schultz (1997). Shumaker
(1980) proposed that fractures observed in highly organic-
rich portions of Devonian shale in oriented cores from wells
in Kentucky and West Virginia have a limited stratigraphic
extent and are related to stress resulting from their preferen-
tial orientation. The cleavage duplexes studied by Nickelsen
(1986) showed significant layer-parallel shortening, but no
details were given to explain how the shortening affected the
thickness measurements of the formation in which the cleav-
age duplexes occurred. An example of the third-order folding
is illustrated in figure 2.
The objective of this study was to test whether the third-
order folds observed in outcrop were discernible in the sub-
surface by correlating wireline logs using a computer program
not used previously in this tectonic setting. The correlation
of nine wireline logs containing gamma-ray and bulk-density
curves showed variations in thickness that likely were caused
by third-order structural features. Traditional well-log cor-
relation commonly results in the interpretation of absent and
repeated sections and selects the location of the fault planes in
the subsurface at these interpreted intervals. This study used
Correlator 5.2, a computer program originally designed to
correlate wireline logs in extensional regimes, such as the U.S.
Gulf Coast (Olea, 2002a) and mid-continent regions (Watney
and others, 1999; Olea and Guy, 2000; Olea, 2000b). In this
study, the program was used for the first time to correlate wire-
line logs in a contractional tectonic regime. The program was
used to infer the locations of discontinuities in the subsurface
that may have caused the “disturbed” zones, which were evi-
dent in outcrop.
Stratigraphy
The stratigraphic succession in the study area in eastern
West Virginia and western Virginia consists of Cambrian
through Lower Mississippian sedimentary rocks, including
thick carbonate sequences in the Ordovician, Silurian, and
Lower Mississippian and siliciclastic sequences in the Lower
and Middle Cambrian, and Devonian. The primary strati-
graphic units in this study are the Lower and Middle Devo-
nian mudstone and shale within the Needmore Shale and the
Middle Devonian Marcellus Shale and Mahantango Forma-
tion. Where the Marcellus Shale and Mahantango Formation
cannot be differentiated, they are mapped as one unit and
referred to as the Millboro Shale in westernmost Virginia and
easternmost West Virginia (de Witt and others, 1993; Rader
and Evans, 1993) (fig. 5).
The Needmore Shale overlies the Lower Devonian
Oriskany Sandstone in most of the study area where the Lower
and Middle Devonian Onondaga Limestone is not present or
discernible. The Needmore Shale is a dark-gray, silty shale,
typically with subtle to distinct laminations in outcrop. The
regionally extensive Middle Devonian Tioga Ash Bed, which
consists of brownish-gray to brownish-black, highly mica-
ceous ash and chert, occurs at the top of the Needmore Shale
(or the Onondaga Limestone, where the Needmore Shale is
absent), separating it from the Marcellus Shale. The Tioga Ash
Bed rarely is exposed in the study area because it is highly
susceptible to weathering.
The Marcellus Shale in the study area is typically a dark-
gray to black mudstone or shale with a high organic-material
content, weathers to gray or brown chips on outcrop, and
contains pyritic zones and zones of calcareous concretions and
limestone beds. The Marcellus Shale commonly exhibits well-
developed jointing in three directions, chaotic bedding, shear
zones, pencil fracturing, and fractures that contain calcite
and pyrite.
Table 2.  Apparent thickness of interpreted intervals estimated from wireline logs.
Regulatory
number
API number
Millboro Shale
interval 1
(feet)
Millboro Shale
interval 2
(feet)
Millboro Shale
interval 3
(feet)
Millboro Shale
total thickness
(feet)
Needmore Shale
total thickness
(feet)
HI–0003 4509123504 99 211 137 447 143
HI–0001 4509120036 96 202 147 445 149
RO–0018 4516520171 64 162 91 317 163
RO–0024 4516520384 141.5 294 127 562.5 103
RO–0021 4516520373 165 279 76 520 96.5
HD–0015 4703100015 58.5 231.5 177 467 127
PD–0010 4707100010 78 120 53 251 181.5
PD–0011 4707100011 108 329 126.5 563.5 154.5
HI–0004 4509123522 103 245 109.5 457.5 171.5
Minimum 58.5 120 53 251 96.5
Maximum 165 329 177 563.5 181.5
Introduction   5
Allegheny
Plateau
Cumberland
Plateau
WEST VIRGINIA
VIRGINIA
PENNSYLVANIA
Study area
Portion of cross section 5 in figure 6
of Kulander and Dean (1986), shown
in figure 4 of this report
KENTUCKY
OHIO
Blue
Ridge
anticlinorium
TENNESSEE NORTH CAROLINA
Central
Appalachians
Southern
Appalachians
Pine
Mountain
sheet
Pulaski
sheet
Pulaski
sheet
St. Paul-Honaker sheet
Copper Creek sheet
Mountain City
window
Holston Mountain
sheet
Cove Mountain
sheet
Richlands
sheet
Zone
Transition
Style
Structural
Saltville
sheet
St.
Clair
Narrows
sheet
Intraplateau str
ucturalfront
MARYLAND
Nittany
Broadtop
Folded
plateau
anticlinorium
anticlinorium
M
assanutten
-
Bl
ue
Ridge
sheet
M
assanutten
synclinorium
Mead
ow
Branch
synclinorium
Caca
pon
M
ountain-AdamsRunanticlinorium
Alleghenystructuralfront
83°
39°
38°
37°
82° 81° 80° 79° 78°
0 50 KILOMETERS10 20 30 40
0
Base from U.S. Geological Survey digital data, 2005, 1:2,000,000
Albers Equal-Area Conic projection
Standard parallels 29°30' and 45°30'
Central meridian -96°, latitude of origin 23°
North American Datum of 1983
10 20 30 40 50 MILES
EXPLANATION
Thrust fault
Fault
Structural province boundary
Boundary between southern
and central Appalachians
Trace of structural front
Cross section
Figure 3.  Map showing regional structural geology of eastern West Virginia and western Virginia, including major tectonic
features, the location of the cross section shown on figure 4, and the location of the study area shown in figure 7. Modified from
Kulander and Dean (1986); used by permission of the American Association of Petroleum Geologists, whose permission is required
for further use.
6   Characterization of the Marcellus Shale Based on Compter-Assisted Correlation of Wireline Logs in Virginia and West Virginia
Thrustfault—Arrowshowsrelativemotion.
Dashedwhereapproximatelylocated
Otherfault
Contact
Feet
0
5,000
10,000
15,000
20,000
25,000
30,000
m
m
u
l
Ol
Om
Om
Ou
m
u
Ol
Ou
S
S
Ol
Ou
DlDl
SS
S
DmDu
m
u
Ol
Om
u
m
Dl
SDm
Du
ll
DlDl
DmS
S
Om
Ol
u
m
SS
S
Ou
Ou
l
Du
u
Dl
Om
Om
u
Ol
Om
Om
S
Dm
OmOl
S
Ou
Om
Ol
S
S
Dm
S
Om
Ol
m
NittanyanticlinoriumBroadtopsynclinorium
HIGHLAND
COUNTY
AUGUSTA
COUNTY
HIGHLAND
COUNTY
WillsMountain
anticline
WarmSprings
anticline
NorthwestSoutheast
Allegheny
structural
front
McClung
syncline
Rangeoftypicalthird-orderfold
Rangeoftypicalfirst-orderfold
EXPLANATION
Décollement
Precambrianrocks(undivided)
UpperCambrianrocks(undivided)
mMiddleCambrianrocks(undivided)
lLowerCambrianrocks(undivided)
OlLowerOrdovicianrocks(undivided)
05KILOMETERS1234
012345MILES
DuUpperDevonianrocks(undivided)
DmMiddleDevonianrocks(undivided)
DlLowerDevonianrocks(undivided)
SSilurianrocks(undivided)
OuUpperOrdovicianrocks(undivided)
OmMiddleOrdovicianrocks(undivided)
Figure4. CrosssectionacrossBroadtopsynclinoriumandNittanyanticlinoriumillustratingfirst-andthird-orderfoldswithinmiddleandlowerPaleozoicstrata.Modifiedfrom
KulanderandDean(1986);usedbypermissionoftheAmericanAssociationofPetroleumGeologists,whosepermissionisrequiredforfurtheruse.
Introduction   7
Conformably overlying the Marcellus Shale is the
Mahantango Formation, a dark-gray to gray shale and silty
shale. The Mahantango Formation typically has low organic-
material content and minimal chaotic bedding and internal
deformation. Concretions are absent to rare. Where the
Mahantango Formation cannot be differentiated from the
Marcellus Shale, the two formations are mapped collectively
as the Millboro Shale in Virginia and West Virginia (de Witt
and others, 1993; Rader and Evans, 1993). The Mahantango
Formation grades upward into the Upper Devonian Brallier
Formation, the base of which is its lowest siltstone bed. The
Brallier Formation extends upward to the base of the Upper
Devonian Foreknobs Formation, which is a mixed greenish-
gray and red sandstone and shale interval formerly referred to
as the Chemung Formation (Rader and Evans, 1993).
The Marcellus Shale is recognized on gamma-ray
wireline logs as one or more highly radioactive zones approxi-
mately 100 to 200 ft above the top of the Oriskany Sandstone
(Piotrowski and Krajewski, 1977a,b; Schwietering, 1980;
Roen and de Witt, 1984; de Witt and others, 1993). These
radioactive zones have the highest total organic carbon content
and are the objective zones for drilling and production of
natural gas in the Marcellus Shale gas play. The distinctive log
character of the Marcellus Shale facilitates well-log correla-
tions in the structurally complex Valley and Ridge province.
The total thickness of radioactive Marcellus Shale ranges from
0 ft where it pinches out to the west to over 700 ft in south-
eastern New York (Piotrowski and Harper, 1979; Erenpreiss
and others, 2011); however, Smith and others (2009) reported
that the thickening that may result from thrust faults may be
overlooked easily in typical wireline logs, even though such
thrust faults are recognizable in outcrop and high-resolution
borehole image logs. Detailed wireline log correlations by
Enomoto (2009) suggest that thickness variations within
the study area may result from structural deformation in the
organic-rich shale intervals. In the study area, the Marcellus
Shale and the Mahantango Formation are not differentiated
on published geologic maps; therefore, the term “Millboro
Shale” was used in the annotation of the formation tops on the
wireline well logs and in the accompanying figures.
Structural Geology
The study area is mostly within the western part of the
Valley and Ridge province, including portions of the Broadtop
Figure 5.  Schematic stratigraphic chart showing Lower Devonian to Upper
Devonian strata of the central Valley and Ridge and Appalachian Plateaus
provinces in western Virginia and eastern West Virginia. Modified from Kulander
and Dean (1986), Flaherty (1996), and Milici and Swezey (2006).
West Virginia and Virginia
Mahantango Formation
Marcellus Shale
Onondaga
Limestone Huntersville
Chert Needmore
Shale
Oriskany Sandstone
DEVONIAN
MiddleLowerUpper
Brallier Formation
Tioga
Ash Bed
Millboro Shale
Foreknobs Formation (formerly Chemung Formation)
Series
System
Stratigraphic unit
West East
EXPLANATION
Ash bed
Chert
Limestone and (or) dolomite
Sandstone
Shale
8   Characterization of the Marcellus Shale Based on Compter-Assisted Correlation of Wireline Logs in Virginia and West Virginia
synclinorium and the Nittany anticlinorium (figs. 3, 4; Kulander
and Dean, 1986); however, the locations of four of the wells
used in the study are west of the Allegheny structural front
(ASF). In the study area, stratigraphic units at the surface
typically range from Lower Devonian to Upper Devonian,
with thin intervals of Mississippian strata present in the core
of the deepest synclines (Schultz, 1997; Dicken and others,
2005; Nicholson and others, 2005). In some places, Silurian
and older Paleozoic rocks reach the surface in the cores of
anticlines. The study area is bordered on the northwest by
the Appalachian Plateaus province and on the southeast by
the North Mountain fault, which brings the lower Paleozoic
carbonate strata that floor the Shenandoah Valley into jux-
taposition with Devonian strata. According to Jacobeen and
Kanes (1974), who used two-dimensional seismic data, sample
descriptions of cuttings, and wireline well logs to interpret the
subsurface, the thrust faults are rooted in the Ordovician Mar-
tinsburg Formation tens of thousands of feet below the surface.
This interpretation is used by Kulander and Dean (1986) in
their subregional analysis, where they depict regional thrust
faults rising out of the Lower Cambrian shale on a structural
ramp up into the Ordovician Martinsburg Formation from
which the deformation within the Lower and Middle Devonian
shale is derived (fig. 4).
Deep, regionally extensive second-order folds associ-
ated with the major faults are developed in the lower Paleo-
zoic intervals (Kulander and Dean, 1986; Schultz, 1997) and
extend upward into the overlying Devonian strata; the result-
ing regional anticlines and synclines are manifest in the Devo-
nian strata. A common structural style displayed in outcrops,
primarily in the Marcellus Shale, is one of disharmonic folding
within the surface and near-surface structures, which pro-
duces relatively small folds and local thrust faults. Examples
of these smaller, third-order folds are illustrated in Jacobeen
and Kanes (1974), Nickelsen (1986), Pohn and Purdy (1988),
and Schultz (1997). The variety of vergence directions of the
third-order folds suggests that a throughgoing, upper-level
décollement zone is not present within the Needmore and
Marcellus Shales of the Broadtop synclinorium (Schultz,
1997). Pohn and Purdy (1988) suggested that disharmonic
folding and “disturbed” zones are common in incompetent for-
mations, such as the Marcellus Shale, whereas the same stress
resulted in wedge faults in competent formations, such as the
Oriskany Sandstone.
The study area is located in a structurally complex
region near documented lineaments, cross-strike structural
discontinuities (CSD) and the ASF. Lineaments are surface
features defined by discontinuities or linear features that may
be related to subsurface phenomenon (O’Leary and others,
1976) and have an orientation oblique to surrounding features.
CSDs are structural features aligned at a high angle to regional
strike-parallel patterns, but are defined by surface and sub-
surface geologic phenomenon (Wheeler, 1980) and thus are
better defined and mapped than lineaments. In the study area,
the strike of at least three structural features (including the
Petersburg CSD) is approximately N. 85° E., the strike of
about six structural features is approximately N. 80° W., and
the strike of at least eight structural features (including the
Parsons CSD) is about N. 50° W. (Wheeler, 1980; Wilson,
1980). The strike of the ASF in Highland County, Virginia,
is approximately N. 35° E., which is parallel to the strike of
the regional anticlines, synclines, and thrust faults (Rader
and Wilkes, 2001). Southworth (1986) concluded that lat-
eral ramps coincided with 32 percent of the lineaments and
70 percent of the cross-strike structural discontinuities that
have been studied, suggesting that the lineaments and CSDs
may be surface expressions of lateral ramps in the allochtho-
nous cover rocks of the Appalachians. Wilson (1980) noted
that splay faults within the Parsons CSD cut the Silurian to
Devonian structural lithic unit, transferring the slip along the
faults into the Middle Devonian shale, which caused thicken-
ing in that sequence. In units where the slip along the fault had
been transferred from one detachment horizon to another, such
as in the Middle Devonian shale, the unit showed thicken-
ing in the hinges of folds and thinning on the limbs of folds
(Wilson, 1980). Wilson (1980) also reported that the rocks
within the Parsons CSD were more intensely folded with a
related increase in joint intensity compared to rocks outside
the CSD. Detailed mapping by previous workers also noted a
transfer of slip in the Silurian to Devonian sequence along the
Petersburg CSD (Wilson, 1980).
Multiple joint sets generated by multiple episodes and
directions of stress were described by Dean and others (1983)
and Evans (1994) from surface and subsurface data. Cross-
strike structural discontinuities were described from surface
mapping (Wheeler and others, 1979; Wheeler, 1983) and
have been interpreted to extend up to 4 kilometers (km) into
the subsurface (Wheeler, 1980; Wilson and Shumaker, 1992).
The wells in this study were spaced far enough apart that the
features described in these reports may affect the results of this
analysis.
Exploration and Production History in the Study
Area
Petroleum exploration in the 1950s and 1960s led to the
discovery of several gas fields within the study area (Energy
Information Administration (EIA), 2010). In southern Penn-
sylvania, natural gas was discovered in the Devonian Oriskany
Sandstone in the Purcell, Five Forks, and Artemas fields in
1957, 1962, and 1963, respectively. They were abandoned in
1974, 1972, and 1972, respectively, after cumulative produc-
tion of almost 21 billion cubic feet of (BCF) of gas from the
Oriskany Sandstone (Harper and Patchen, 1996).
In Hampshire and Hardy Counties in eastern West Virginia,
there is a northeast-southwest-trending line of gas fields that
also produced from the Oriskany Sandstone. They include the
Creekvale (Gore), Little Cacapon, Augusta, Inkerman, and
Lost River fields. The Creekvale (Gore) discovery consisted of
two successful wells that were completed, but for which there
are no cumulative production data available (Cardwell, 1982).
Procedures  9
The Little Cacapon field, discovered in 1965, produced about
1 BCF of gas. In 1971, the field was converted to a gas storage
facility (Cardwell, 1982). The Augusta field produced 1 BCF
of gas from 1953 to 1971 before it, too, was converted to a gas
storage facility (Cardwell, 1982). The Inkerman (Whip Cove
West) field produced 4.8 BCF of gas from 1966 to 1973 and
the Lost River (Whip Cove East) field produced 9.1 BCF of
gas from 1962 to 1973 (Cardwell and Avary, 1982).
In western Virginia, the Bergton field was discovered
in 1935 and lies at the southwestern end of this series of gas
fields in the Oriskany Sandstone. Several drilling campaigns
took place between 1935 and 1980, when a pipeline was built
to a nearby interstate pipeline system to establish commercial
production. The last reported production from Rockingham
County, where the Bergton field is located, was in 1986.
During two periods of production, the field produced slightly
over 200 million cubic feet (MMCF) of gas (Milici, 1990).
In Pocahontas County, West Virginia, the Thornwood
field was discovered in 1961, and development drilling con-
tinued until 1964, but the amount of gas produced from the
Oriskany Sandstone during that time is not available (Cardwell
and Avary, 1982). In 1996, Cabot Oil recompleted several
wells and produced 3.28 BCF of gas through 2010, the last
date for which production data are available (WVGES, 2010).
Finally, one of the wells used in this study (PD–0010,
table 1) appears to be the southernmost productive gas well
in the Jordan Run field in Grant County, West Virginia. Over
41 MMCF of gas has been produced from this well from the
Oriskany Sandstone since the PD–0010 well was drilled in
1983. This well has been operated by Chesapeake Energy
since 2005.
Procedures
The wells in this study were chosen in an area approxi-
mately 50 mi wide by 50 mi long where published digital
geologic maps were available. Nine wells were identified
that penetrated as deep as the Oriskany Sandstone and have
wireline gamma-ray and bulk-density logs through the Upper
to Lower Devonian interval (table 1, plate 1). The regulatory
number listed in the first column in table 1 was used as the
identifier for each well in the text, figures, and plates of this
report. On the basis of the compilation of geologic map-
ping completed in the study area (Dicken and others, 2005;
Nicholson and others, 2005), wells PD–0010, PD–0011,
HI–0004, and HI–0003 are located on the western side of the
ASF and wells HI–0001, RO–0018, RO–0024, RO–0021,
and HD–0015 are located on the eastern side of the ASF. This
positional relation led to the assumption that the strata in the
wells west of the ASF are likely to be less deformed and have
greater petrophysical consistency than the wells east of the
ASF. In order to test this assumption, the petrophysical proper-
ties measured on the wireline logs were analyzed for evidence
of variability that might indicate the presence of third-order
folds. Digital images of wireline logs were downloaded from
the West Virginia Geological and Economic Survey (2010)
and Virginia Division of Gas and Oil (2010) Web sites. The
logs were digitized to create log ASCII1
standard (LAS) files
that contain gamma-ray and bulk-density curves. Most of the
wells had bulk-density curves available, but two logs which
had only formation density and density porosity available were
converted to bulk-density so that the same log suite and scales
could be used for all wells. The LAS files were used as input
to the Correlator program.
Drilling reports submitted by the well operators were
obtained for the nine wells; these reports included the depths
of the tops of formations. Descriptions of drill cuttings were
available for four of the nine wells in the study. Using these
data as the starting point, IHS Kingdom™ software was used
to facilitate the correlation of the wireline logs. The wireline
logs provided gamma-ray (GR) measurements in American
Petroleum Institute (API) units, which indicate relative radio-
activity. Bulk-density measurements were provided in grams
per cubic centimeter (g/cc; also denoted as RHOB (rho B) in
oil and gas industry wireline logs, and in the figures and plates
in this report). The term “excursion” is used here to indicate
the movement of either the gamma-ray or bulk-density curve
to the right or left relative to an axis on the log.
The depths to the tops of the Millboro Shale, Needmore
Shale, and Oriskany Sandstone in the wireline log for the
Fulk No. 1 well (RO–0024; fig. 6) were selected on the basis
of traditional pattern recognition. The top of the Oriskany
Sandstone was chosen at an excursion of the gamma-ray curve
to the left with increasing depth (indicating 50 API units or
less) and an excursion of the bulk-density curve to the right
with increasing depth (indicating values of 2.65 g/cc or higher
below the top). These measurements indicated the presence
of a clean sandstone with little to no clay content. The top of
the Needmore Shale was chosen at the lowest excursion of the
gamma-ray curve to the right with decreasing depth (indicat-
ing values greater than 160 API units above this depth) and an
excursion of the bulk-density curve to the left with decreas-
ing depth (indicating values less than 2.60 g/cc). The top of
the Millboro Shale was chosen at the second excursion of the
gamma-ray curve to the left, at the top of the second radioac-
tive interval above the Oriskany Sandstone and Needmore
Shale (indicating values decreasing to 160 API units or less),
and an excursion of the bulk-density curve to the right with
decreasing depth (indicating values increasing to 2.60 g/cc or
greater above this depth).
The tops of the selected formations were entered into the
Correlator program on the basis of the above criteria to initiate
correlations of the digital wireline logs. In Correlator, two log
curves per well were used to compare the amount of shale in a
specified interval, and the variability of a second petrophysical
property (such as bulk density) was analyzed. The compari-
sons were done simultaneously using both logs. In this study,
1
American Standard Code for Information Interchange
10   Characterization of the Marcellus Shale Based on Compter-Assisted Correlation of Wireline Logs in Virginia and West Virginia
3,2003,3003,4003,5003,6003,7003,8003,900
Base of Brallier Formation
and top of Millboro Shale
Top of Needmore Shale
Top of Oriskany Sandstone
Measured depth,
in feet
Gamma ray (GR) Bulk density (RHOB)
0 200 2.50 2.90
4,000
Figure 6.  Digital wireline log curves for the Fulk No. 1 well (RO–0024) illustrating the initial interpretation
for locating the tops of the Millboro Shale, Needmore Shale, and Oriskany Sandstone using the criteria
described in the text. Gamma-ray (GR) intensity measurements, which indicate relative radioactivity, are in
American Petroleum Institute (API) units; bulk-density (ρB, or RHOB) measurements are in grams per cubic
centimeter (g/cc). The GR curve wraps on the log scale when API units exceed 200.
Procedures  11
a correlation interval of 15 ft was chosen for the calculations
(although the program allows for any interval length to be
chosen). The program was implemented in such a way that
attention was fixed at a given interval in the well to the left
and comparisons were made with multiple possible intervals in
the second well on the right. Initially, a few correlations at the
maximum variability intervals were obtained using a search
interval of 400 ft. These first correlations were used to guide
the final correlation within a search interval of only 20 ft.
There was a sequential progression of correlations performed
between the top of the Millboro Shale and the top of the Oris-
kany Sandstone between pairs of wells until logs of all nine
wells were correlated. In map view, a line connecting the nine
wells in this study formed a closed polygon (fig. 7). The cross
sections shown in plates 1 through 4 display the nine wells in
the sequence in which they were correlated.
PD–0011
HI–0001
HI–0003
RO–0018
RO–0024
RO–0021
HD–0015
Alleghenystructuralfront
ROCKINGHAM
SHENANDOAH
PAGE
HARDY
GRANT
TUCKER
AUGUSTA
HIGHLAND
POCAHONTAS
RANDOLPH
BARBOUR
PENDLETON
Harrisonburg
WESTVIRGINIA
VIRGINIA
BATH
HI–0004
0 20 KILOMETERS5 10 15
0 5 10 15 20 MILES
PD–0010
EXPLANATION
Fault
Marcellus Shale or Millboro Shale with Needmore
Shale or Huntersville Chert, undivided (Middle
Devonian)
Well and number
Well and number with dipmeter data available—
See figure 8, parts A and B, and text for detailed
information
Line of section used for correlation
HI–0001
HI–0004
38°20'
39°00'
38°40'
79°40' 79°20' 78°40'79°00'
Base from ESRI digital data, 2007, 1:500,000
Geographic projection
North American Datum of 1983
Figure 7.  Map of study area showing the outcrop area of the Middle Devonian Marcellus Shale or Millboro Shale with
Needmore Shale or Huntersville Chert (undivided), regional faults, and the locations of the nine wells used in this study (including
the well with the dipmeter; see figure 8) and the cross sections (see plates 1 through 4). Geology modified from 1:500,000-scale
mapping by Dicken and others (2005) and Nicholson and others (2005).
12   Characterization of the Marcellus Shale Based on Compter-Assisted Correlation of Wireline Logs in Virginia and West Virginia
For the Correlator calculations, depth is denoted in terms
of the sequential number of the log readings in the matching
well to the right. For example, if the reading for the reference
well starts at 850 ft and the sampling interval is 0.5 ft, then the
sequential number 1 represents a depth of 850 ft, 2 represents
850.5 ft, and so on; thus, even deeper, the sequential number
for 900 ft would be 101. Tracking the depth measurements in
the matching log is done relative to the starting point of the
reference log. In general,
depth d spacing i= + ⋅ −0 1( ) (1)
where
	 depth	 is the depth below a reference datum, such as
sea level or the kelly bushing;
	d0	
is the depth of the uppermost wireline log
reading;
	spacing	is the digitization interval; and
	i	is the sequential number of log reading
The calculations performed by the Correlator program
were as follows (see Olea, 2002b, 2004, for more details):
α
λ λ
λ λ
λ λ
1 3
1 1
1 1
3
1
1
2 1
,
min
, ;i k n
n
j jshale
shale
shal
( ) = −
⋅ +
( )−
−
−
( )− ee
shalej n
i n
3
3 31 λ λmin −= −
+
∑
		
(2)
where
	 α	 is the coefficient that measures the similarity
in shale content;α varies from 0 to 1,
with 1 being the best or an exactly equal
amount of shale in the reference and
matching wells;
	 1	 used as a subscript, refers to the reference
shale log;
	 3	 used as a subscript, refers to the matching
shale log;
	i	is the depth at the center of the correlation
interval in the reference well;
	j	is the depth at the center of the correlation
interval in the matching well;
	k	is the difference between the reference and
matching well (i minus j); for example, if
i=50 and j=150, then k=100.
	n	is the number of depth measurements to each
side of the correlation interval’s center;
	 λ	 is a wireline log reading;
	shale	is the reading of the shale log; and
	min	is the minimum value.
r i k n
i k n
s i n s i k n
2 4
2 4
2 4
,
,
, ;
cov , ;
; , ;
( ) =
( )
( )⋅ ( )
(3)
where
	r	is the correlation coefficient between the other
correlation log curves;
	 2	 used as a subscript, refers to the reference log;
	 4	 used as a subscript, refers to the matching log;
	i	is the depth at the center of the correlation
interval in the reference well;
	k	is the offset for the difference between the
reference and matching well; see equation
2) above;
	n	is the number of depth measurements to each
side of the correlation interval’s center;
	 cov	 is the covariance between depths in the
reference and matching wells; and
	s	is the standard deviation.
The correlation wireline logs are bulk-density logs in this
study. The correlation coefficient, r, measures the similarity
in signature; that is, the ability of one log curve to follow the
other log curve. This comparison is scale independent, varies
from −1 to 1, and is calculated by the following:
w i k n i k n r i k n1 2 3 4 1 3 2 4, , , , ,, ; , ; , ;( ) = ( )⋅ ( )α (4)
where
	w	is the product of α and r, providing a weighted
correlation that simultaneously measures
the similarity in signature and shale
content. Varies from −1 to 1. Only positive
and high correlations are used;
	 1	 refers to the reference shale wireline log;
	 2	 refers to the reference correlation wireline
log;
	 3	 refers to the matching shale wireline log;
	 4	 refers to the matching correlation wireline
log;
	i	is the depth at the center of the correlation
interval in the reference well;
	k	is the offset for the difference between the
reference and matching well; see equation
(2) above;
	n	is the number of depth measurements to each
side of the correlation interval’s center.
The Correlator program used the change in absolute
measurements on the gamma-ray and bulk-density digital log
curves to calculate the weighted correlation coefficient, w,
between two wells. This process is similar to the way geolo-
gists visually correlate wireline logs as they use changes in
Results and Analyses   13
measurements with depth to recognize patterns. The program
used the selected correlation interval and search window
parameters to determine the best matching correlation, which
was defined by the weighted correlation coefficient in equa-
tion 4 (plate 2). Only intervals with a weighted correlation
coefficient of 0.60 or higher between two wells were dis-
played and used in further calculations. In the case of the nine
study wells, most intervals displayed a correlation strength
of 0.60 to 0.68 (blue). No intervals displayed a correlation
strength greater than 0.92 (red). The color bar in plate 2
indicates the correlation strength. With the exception of the
USGS-standardized index map and explanation, each cross
section on plates 1 through 4 is the graphical output from the
Correlator program.
Results and Analyses
The Correlator program calculated the degree of similar-
ity between two logs using specified search parameters. The
similarities are discussed below as are some suggested pos-
sible reasons for them.
The cross section illustrated in plates 2 through 4 used
the top of the Millboro Shale as the datum so that the varia-
tion in the thickness of the Millboro Shale would be readily
apparent. Another practical consideration was the use of a
vertical exaggeration. One vertical scale and another hori-
zontal scale were systematically used in all displays. The log
curves of well HI–0003 were chosen arbitrarily to initiate the
use of the Correlator program for extending correlations of
the tops of the three formations to the other eight wells in the
sequential correlation process described above. Because of this
choice and the standard operating procedure of the Correlator
program, well HI–0003 is displayed at both ends of plates 1
through 4. Because well HI–0003 was compared to a different
well at the left side (well HI–0001) of each plate versus the
right side (well HI–0004), the results were slightly different
and therefore the display looks slightly different at each end
of each cross section. During the iterative correlation process,
the Millboro Shale was divided into three intervals based on
the gamma-ray and bulk-density measurements. The entire
Needmore Shale was represented by one undivided interval.
From the top of the Millboro Shale to its bottom, the intervals
were designated as Millboro Shale interval 1, 2, or 3. These
three intervals were identified by color, as shown on plate 3, if
the values exceeded the correlation strength of 0.60. Millboro
Shale intervals 1 and 3 yielded the highest gamma-ray mea-
surements and probably represent the most organic-rich zones
of the Millboro Shale. These two intervals were separated
by interval 2, which had lower gamma-ray and higher bulk-
density measurements, perhaps representing the calcareous
shale and calcareous concretion horizons studied in outcrop.
In the final iteration in the nine wells, Millboro Shale interval
1 ranged from 58 to 165 ft thick, Millboro Shale interval 2
ranged from 120 to 329 ft thick, and Millboro Shale interval
3 ranged from 53 to 177 ft thick. The Needmore Shale ranged
from 96 to 182 ft thick in the same wells (table 2).
On the basis of the program calculations, intervals that
yielded correlation strengths of 60 percent or higher in all
nine wells were isolated (plate 4). Four intervals persisted in
all nine wells, each with a thickness ranging from 2 to 16 ft.
These intervals, which exhibited regional continuity, were
located near the tops of Millboro Shale interval 2, Millboro
Shale interval 3, and the Needmore Shale. A fourth zone that
exhibited regional continuity was located within Millboro
Shale interval 2.
The measured percentage of each correlated interval
that yielded a correlation strength equal to or greater than
60 percent was recorded for each well pair. For each interval,
the mean of the percentage was calculated (table 3). The high-
est mean percentage (71.2 percent) was found in the Need-
more Shale, which indicates that this formation had the most
consistent wireline-log character in the study area. Within
the Millboro Shale, interval 2 yielded a mean percentage of
66.9 percent, which was the highest of all correlated intervals,
and therefore indicated that its wireline-log character was the
most regionally consistent in the Millboro Shale on the basis
of gamma-ray and bulk-density logs. Millboro Shale interval 1
yielded the lowest mean percentage (51.8 percent), which indi-
cated that the wireline-log character of this interval was the
least consistent of the four intervals studied. As noted above,
the top portion of Millboro Shale interval 1 was not among the
four regionally persistent zones in the wells studied.
Mean gamma-ray values (in API units) were calculated
for each of the four intervals, and a mean for each interval
was calculated for all wells (table 4). Millboro Shale interval
3 yielded the highest mean gamma-ray value for all of the
wells (213.0 API units), which was the highest in six of the
nine wells. The Needmore Shale and Millboro Shale interval 2
yielded the lowest mean gamma-ray values for all of the wells
(147.6 and 127.7 API units, respectively).
Mean bulk-density (RHOB) values (in g/cc) were
calculated for each of the four intervals, and a mean for each
interval was calculated for all wells (table 5). The Needmore
Shale and Millboro Shale interval 2 yielded the highest mean
values (2.72 and 2.69 g/cc, respectively). The gamma-ray and
bulk-density values for these two intervals likely reflect their
lithologies, suggesting that they contain less clay and perhaps
more calcium carbonate or silica. Millboro Shale interval
1 yielded the lowest mean RHOB value for all of the wells
(2.62 g/cc) and yielded the second highest mean gamma-ray
value (191.8 API units). The low mean bulk-density values
may indicate a lack of limestone or thin siltstone beds in this
interval, and the high mean gamma-ray values may indicate
high organic matter content. These properties may have
facilitated plastic deformation as a result of stress on this
interval. This interval may be the best candidate to exhibit
short-wavelength folds and closely spaced thrust faults that
may not be observed in more competent formations above
and below.
14   Characterization of the Marcellus Shale Based on Compter-Assisted Correlation of Wireline Logs in Virginia and West Virginia
Table 3.  Percentage of the interval where correlation strength between well pairs exceeded 60 percent.
Stratigraphic
interval
Percentage of interval where correlation strength between well pairs exceeded 60 percent
Mean
(percent)HI–0003:
HI–0001
HI–0001:
RO–0018
RO–0018:
RO–0024
RO–0024:
RO–0021
RO–0021:
HD–0015
HD–0015:
PD–0010
PD–0010:
PD–0011
PD–0011:
HI–0004
HI–0004:
HI–0003
Millboro Shale
interval 1
84.8 31.9 46 55.5 47.2 47.5 14.6 82.9 55.8 51.8
Millboro Shale
interval 2
74.9 79.6 79.9 86.3 63.7 34.6 56.7 56.2 69.9 66.9
Millboro Shale
interval 3
81.3 51.4 55.5 62.6 60.9 0 53.7 63.5 65.2 54.9
Needmore Shale 87.2 77.5 29.9 54.5 72.5 82.7 67.7 98.4 70.4 71.2
Table 4.  Mean gamma-ray values, calculated for each interval.
[API, American Petroleum Institute]
Stratigraphic
interval
Mean gamma-ray intensity (API units) for each interval Mean
(API units)HI–0003 HI–0001 RO–0018 RO–0024 RO–0021 HD–0015 PD–0010 PD–0011 HI–0004
Millboro Shale
interval 1
151.8 259.3 184.3 234.3 204.1 120.9 201.6 184.7 185.0 191.8
Millboro Shale
interval 2
127.1 106.6 99.8 126.3 138.6 96.2 123.1 180.6 151.2 127.7
Millboro Shale
interval 3
198.9 230.3 162.9 193.0 268.4 146.2 263.7 244.3 209.6 213.0
Needmore
Shale
126.9 159.1 115.7 175.0 186.2 107.1 153.4 154.9 149.9 147.6
Table 5.  Mean bulk-density values calculated for each interval.
[g/cc, grams per cubic centimeter]
Stratigraphic
interval
Mean bulk density (g/cc) calculated for each interval Mean
(g/cc)HI–0003 HI–0001 RO–0018 RO–0024 RO–0021 HD–0015 PD–0010 PD–0011 HI–0004
Millboro Shale
interval 1
2.61 2.55 2.52 2.67 2.71 2.61 2.66 2.61 2.61 2.62
Millboro Shale
interval 2
2.72 2.63 2.58 2.70 2.72 2.85 2.68 2.66 2.70 2.69
Millboro Shale
interval 3
2.62 2.57 2.58 2.66 2.63 2.81 2.58 2.56 2.63 2.63
Needmore
Shale
2.68 2.71 2.68 2.72 2.72 2.88 2.71 2.64 2.71 2.72
Results and Analyses   15
Millboro Shale interval 3 yielded the second lowest
mean percentage of correlated intervals for all of the wells
(54.9 percent) and the second lowest mean bulk-density value
for all of the wells (2.63 g/cc). The low mean bulk-density
values may indicate a lack of limestone or thin siltstone beds
in this interval, and the high mean gamma-ray values may
indicate high organic matter content. As with Millboro Shale
interval 1, these properties may have facilitated plastic defor-
mation as a result of stress on this interval.
On the basis of the data on mean gamma-ray and bulk-
density values, there seems to be an association between low
percentages of correlated intervals and ductile lithologies.
Millboro Shale intervals 1 and 3 yielded the lowest mean
percentage of correlated interval, may contain the most clay-
or organic-rich material, and therefore may have been most
affected by third-order folding and (or) faulting.
Well HI–0004 is located west of the ASF and was the
only well of the nine studied with a dipmeter log available
(fig. 8A,B). The log takes the form of a “tadpole” plot where
solid tadpoles indicate sufficient correlation of the acquired
resistivity data to determine an attitude of the beds, and hol-
low tadpoles indicate minimal correlation of the acquired
resistivity data. Between 6,125 and 6,210 ft measured depth
(MD) in this well, in an interval above the Millboro Shale
described as dark-gray, platy, slightly calcareous shale on
the mud log, the tadpole plot indicated 2° to 5° of dip to the
north, northwest, east, and southeast; this interval is marked
as ‘a’ in figure 8A. Within Millboro Shale interval 1, from
6,260 to 6,300 ft MD, the dip was about 2° to the east and
southeast (b in figure 8A). From 6,300 to 6,344 ft MD, still
within Millboro Shale interval 1, most of the tadpoles were
hollow (c in figure 8A). and the dip magnitude varied from
2° to greater than 60° to the west, northeast, and southeast.
Within Millboro Shale interval 2, from 6,354 to 6,452 ft MD,
the dips ranged from 2° to 22° to the southeast, southwest,
northwest, and west (d in figure 8A). Between 6,456 ft and
6,580 ft MD, the solid tadpoles indicated dips from 5° to 50°
to the southwest, southeast, east, northeast, and northwest
(e in figure 8A,B). Rarely were there two solid tadpoles within
a 4-ft interval indicating the same magnitude or direction of
dip. Lastly, within Millboro Shale interval 3, the dip directions
and magnitudes were extremely variable between 6,590 and
6,682 ft MD, with the few solid tadpoles indicating dips to
the east and southeast with magnitudes between 16° and 54°
and hollow tadpoles indicating dips up to 75° to the south-
west, west, northwest, northeast, and east (f in figure 8B).
Near the base of Millboro Shale interval 3, between 6,684
and 6,700 ft MD, the dip varied between 10° and 22° to the
southeast (g in figure 8B). Within the Needmore Shale, from
6,700 to 6,812 ft MD, the concentration of solid tadpoles was
high and the dips varied from 8° to 28°, mostly to the south-
east (h in figure 8B). The consistent dip direction exhibited on
the dipmeter in well HI–0004 within the Needmore Shale and
in portions of Millboro Shale interval 2 seems to indicate that
these intervals were more competent and less likely to exhibit
plastic deformation as a result of tectonic stress compared to
Millboro Shale intervals 1 and 3. The variable dip magnitude
and direction throughout the Millboro Shale intervals 1 and 3
may be explained by intraformational folding, shearing, and
(or) faulting.
Millboro Shale interval 1 yielded only a 14.6 percent cor-
relation value between wells PD–0010 and PD–0011 (table 3).
Well PD–0010 contained the thinnest Millboro Shale interval
3 and thinnest total Millboro Shale, whereas well PD–0011
contained the thickest Millboro Shale interval 2 and thick-
est total Millboro Shale (table 2). Conversely, well PD–0010
contained the thickest Needmore Shale of the nine wells
(table 2). Wells PD–0010 and PD–0011 were among the most
closely spaced pairs, but well PD–0010 is located between the
traces of the Mathias lineament (Pohn, 2000) and the Parsons
lineament (Southworth, 1986). According to Pohn (2000),
the identifying characteristics of the Mathias lineament (a
lateral ramp) include an abrupt change in fold wavelengths, a
change in fault frequency at the surface, and an abrupt change
in facies thickness. Among other characteristics, the high
frequency of “disturbed” zones north of the Mathias linea-
ment and documented by field investigations (Pohn, 2000)
may explain why well PD–0010 yielded some of the lowest
correlation interval values between it and adjacent wells for all
three Millboro Shale intervals.
A correlation of 34.6 percent of the interval between
wireline logs of wells PD–0010 and HD–0015 was the low-
est of all well pairs in Millboro Shale interval 2 and was 0 in
Millboro Shale interval 3 (table 3, plates 2, 3). These wells are
on opposite sides of the ASF and are on opposite sides of the
Mathias lineament; well HD–0015 lies near the interpreted
position of the Petersburg lineament (Southworth, 1986), and
well PD–0010 is located near the trace of the Mathias linea-
ment as well as the ASF. The lineaments and lateral ramps
described by Pohn (2000) are the result of contractional
tectonic stress; therefore, it is likely that these major structural
features caused discontinuities within the relatively incompe-
tent Millboro Shale.
The correlation of over 80 percent between wells
HI–0003 and HI–0001 was among the highest for Millboro
Shale intervals 1 and 3 and for the Needmore Shale; in Mill-
boro Shale interval 2, the correlation between the same wells
was 74.9 percent (table 3). The Correlator program determined
similar weighted correlation coefficients (w), which indicated
a similarity in shale content and bulk-density signature in the
specified search windows between the well pairs. Because
these wells are on opposite sides of the ASF and there is
significant distance between them, the results were surprising.
Therefore, regardless of the distance between wells HI–0003
and HI–0001 and their apparent relationship to the ASF, the
petrophysical properties in the studied intervals in each well
were determined to be similar.
16   Characterization of the Marcellus Shale Based on Compter-Assisted Correlation of Wireline Logs in Virginia and West Virginia
Figure 8.  Wireline log showing gamma-ray and dipmeter measurements in well HI–0004, Highland County,
Virginia. The “tadpoles” in the rightmost column point in the direction of dip, with north at the top of the log.
Tadpoles are located on a scale of 0° to 90° to illustrate dip magnitude. A, from 6,100 to 6,490 feet. B, from
6,490 feet to 6,880 feet.
Base of Brallier Formation
and top of Millboro Shale
interval 1
Top of Millboro Shale
interval 2
Measured depth,
in feet
6,100
0 200 0 90
6,2006,3006,4006,500 a
b
c
c
Gamma-ray
intensity, in API
units
Dip angle, in
degrees
EXPLANATION
“Tadpole” showing attitude of bedding where
sufficient correlation of resistivity data exists,
in degrees—Scale at top of column. North is
top of page
“Tadpole” showing attitude of bedding where
insufficient correlation of resistivity data exists,
in degrees—Scale at top of column. North is
top of page
Stratigraphic interval boundary—Between
formations or between intervals within the
Millboro Shale
Area of interest detailed in text and identifier
d
e
A
Results and Analyses   17
Figure 8.  Wireline log showing gamma-ray and dipmeter measurements in well HI–0004, Highland County,
Virginia. The “tadpoles” in the rightmost column point in the direction of dip, with north at the top of the log.
Tadpoles are located on a scale of 0° to 90° to illustrate dip magnitude. A, from 6,100 to 6,490 feet. B, from
6,490 feet to 6,880 feet.­—Continued
Top of Millboro Shale
interval 3
Top of Needmore Shale
Top of Oriskany Sandstone
Measured depth,
in feet
g
Gamma-ray
intensity, in API
units
Dip angle, in
degrees
EXPLANATION
“Tadpole” showing attitude of bedding where
sufficient correlation of resistivity data exists,
in degrees—Scale at top of column. North is
top of page
“Tadpole” showing attitude of bedding where
insufficient correlation of resistivity data exists,
in degrees—Scale at top of column. North is
top of page
Stratigraphic interval boundary—Between
formations or between intervals within the
Millboro Shale
Area of interest detailed in text and identifier
6,5006,6006,7006,800
0 200 0 90
h
g
f
e
B
18   Characterization of the Marcellus Shale Based on Compter-Assisted Correlation of Wireline Logs in Virginia and West Virginia
Conclusions
A statistical correlation of strata in the Millboro Shale
and Needmore Shale was achieved using the Correlator pro-
gram, which suggests that it can be a useful correlation tool in
regions of contractional deformation. The results of the objec-
tive correlation performed by Correlator and illustrated by the
“persistent correlations” shown on plate 4 are very similar to
the correlations created by a visual inspection of the wireline
logs before using the program. The results indicate that the
petrophysical properties (primarily mineralogy and porosity)
measured by gamma-ray and bulk-density (RHOB) logs are
fairly consistent across the study area.
Although the Millboro Shale generally exhibited con-
sistent petrophysical properties, the results of performing a
statistical correlation between wireline logs from these nine
wells indicated that there are discontinuities within the Mill-
boro Shale where there are significant thickness differences
between wells. The measured difference in the correlation
strength of Millboro Shale interval 2 between wells com-
pared with that of Millboro Shale intervals 1 and 3 suggests
that intervals 1 and 3 may contain more third-order folds and
sheared or “disturbed” zones than interval 2. Millboro Shale
intervals 1 and 3 likely contain mineralogy that make these
zones more prone to layer-shortening cleavage duplexes and
(or) disharmonic folding than Millboro Shale interval 2 and
the Needmore Shale; however, the discontinuities, which
were indicated by variations in the mathematical correlation
strength, were not specific enough to locate these zones in the
wells that contain third-order folds or duplexes.
Acknowledgments
Reviews by David Houseknecht and Robert Milici of
the U.S. Geological Survey improved the manuscript. The
well-location data and log raster files were acquired from
the Virginia Division of Gas and Oil and the West Virginia
Geological and Economic Survey. The authors thank Patrick
Niemeyer, who digitized the log raster files and created the
LAS files that were used in this study.
References Cited
Boyce, M.L., and Carr, T.R., 2009, Lithostratigraphy and
petrophysics of the Devonian Marcellus interval in West
Virginia and southwestern Pennsylvania, in Carr, Tim,
D’Agostino, Tony, Ambrose, William, Pashin, Jack, and
Rosen, N.C., eds., Unconventional energy resources;
Making the unconventional conventional; Proceedings,
29th Annual Gulf Coast Section SEPM Foundation Bob F.
Perkins Research Conference, Houston, Tex., December
6–8, 2009: Houston, Tex., Gulf Coast Section of Society for
Sedimentary Geology (SEPM), p. 254−281.
Cardwell, D.H., 1982, Oriskany and Huntersville gas fields of
West Virginia (and deep well and structural geologic map):
West Virginia Geological and Economic Survey Mineral
Resources Series MRS–5A, 180 p., 2 pls., scale 1:250,000.
Cardwell, D.H., and Avary, K.L., 1982, Oil and gas fields of
West Virginia: West Virginia Geological and Economic
Survey Mineral Resources Series MRS–7B, 171 p., 2 pls.,
scale 1:250,000.
Coleman, J.L., Milici, R.C., Cook, T.A., Charpentier, R.R.,
Kirschbaum, Mark, Klett, T.R., Pollastro, R.M., and
Schenk, C.J., 2011, Assessment of undiscovered oil and gas
resources of the Devonian Marcellus Shale of the Appala-
chian Basin Province, 2011: U.S. Geological Survey Fact
Sheet 2011–3092, 2 p., http://pubs.usgs.gov/fs/2011/3092/.
Dean, S.L., Baranoski, M., Bertoli, L., Kribbs, G., Stephens,
T., Kulander, B., Lockman, D., and Mumpower, D., 1983,
Regional fracture analysis in western Valley and Ridge
and adjoining plateau, West Virginia and Maryland [abs.]:
American Association of Petroleum Geologists Bulletin, v.
67, no. 3, p. 448, http://archives.datapages.com/data/
bulletns/1982-83/data/pg/0067/0003/0400/0448.htm.
Dean, S.L., Kulander, B.R., and Lessing, P., 1985, Geol-
ogy of the Capon Springs, Mountain Falls, Wardensville,
Woodstock, and Yellow Spring quadrangles, Hampshire and
Hardy Counties, West Virginia: West Virginia Geological
and Economic Survey Map–WV26, 1 sheet, scale 1:24,000.
de Witt, Wallace, Jr., Roen, J.B., and Wallace, L.G., 1993,
Stratigraphy of Devonian black shales and associated rocks
in the Appalachian Basin, in Roen, J.B., and Kepferle, R.C.
eds., Petroleum geology of the Devonian and Mississip-
pian black shale of eastern North America: U.S. Geological
Survey Bulletin 1909, p. B1–B57, http://pubs.er.usgs.gov/
publication/b1909.
References Cited  19
Dicken, C.L., Nicholson, S.W., Horton, J.D., Kinney, S.A.,
Gunther, Gregory, Foose, M.P., and Mueller, J.A.L., 2005,
Preliminary integrated geologic map databases for the
United States; Delaware, Maryland, New York, Pennsyl-
vania, and Virginia: U.S. Geological Survey Open-File
Report 2005–1325, 45 p., database, http://pubs.usgs.gov/
of/2005/1325/.
Energy Information Agency, 2010, Shapefile for the Appala-
chian Basin, in Natural gas; Maps; Exploration, resources,
reserves, and production: Energy Information Agency Web
page accessed March 29, 2013 at http://www.eia.doe.gov/
pub/oil_gas/natural_gas/analysis_publications/maps/
maps.htm.
Enomoto, C.B., 2009, Hydrocarbon potential of the Devo-
nian Millboro (Marcellus) Shale in the Valley and Ridge
Province of Virginia [abs.], in Abstracts, AAPG Eastern
Section Meeting, Evansville, Indiana, September 20–22,
2009: Tulsa, Okla., American Association of Petroleum
Geologists, p. 36−37, http://www.searchanddiscovery.net/
abstracts/html/2009/eastern/abstracts/enomoto.htm.
Erenpreiss, M.S., Wickstrom, L.H., Perry, C.J., Riley, R.A.,
Martin, D.R., and others, 2011, Organic thickness map
of the “Marcellus” modified from Harper and Kostelnik
(2011), Pennsylvania Geological Survey; Kristin Carter
(2008), Pennsylvania MRCSP; James Leone, New York;
and Eric Lewis (2011), West Virginia: Pennsylvania Depart-
ment of Conservation and Natural Resources Web page
accessed May 16, 2013, at http://www.dcnr.state.pa.us/cs/
groups/public/documents/document/dcnr_007597.pdf.
Evans, M.A., 1994, Joints and décollement zones in Middle
Devonian shales; Evidence for multiple deformation
events in the central Appalachian Plateau: Geological
Society of America Bulletin, v. 106, no. 4, p. 447–460,
doi:10.1130/0016-7606(1994)106<0447:JADCZI>
2.3.CO;2.
Flaherty, K.J., 1996, Play Dho; Fractured Middle Devonian
Huntersville Chert and Lower Devonian Oriskany Sand-
stone, in Roen, J.B., and Walker, B.J., eds., 1996, The atlas
of major Appalachian gas plays: West Virginia Geological
and Economic Survey Publication V–25, p. 103–108.
Harper, J.A., and Patchen, D.G., 1996, Play Dos: Lower Devo-
nian Oriskany sandstone structural play, in Roen, J.B., and
B.J., Walker, eds., The atlas of major Appalachian gas plays:
West Virginia Geological and Economic Survey Publication
V–25, p. 109–117.
Harris, L.D., and Milici, R.C., 1977, Characteristics of
thin-skinned style of deformation in the southern Appala-
chians, and potential hydrocarbon traps: U.S. Geological
Survey Professional Paper 1018, 45 p. (Also available at
http://pubs.er.usgs.gov/publication/pp1018.)
Hasson, K.O., and Dennison, J.M., 1988, Devonian shale
lithostratigraphy, central Appalachians, U.S.A., in McMil-
lan, N.J., Embry, A.F., and Glass, D.J., eds., Devonian of the
World: Proceedings of the Second International Symposium
on the Devonian System, Calgary, Canada; v. II; Sedimenta-
tion: Canadian Society of Petroleum Geologists Memoir 14,
p. 157–177.
Jacobeen, Frank, Jr., and Kanes, W.H., 1974, Structure of
Broadtop synclinorium and its implications for Appalachian
structural style: American Association of Petroleum Geolo-
gists Bulletin, v. 58, no. 3, p. 362–375. (Also available at
http://archives.datapages.com/data/bulletns/1974-76/data/
pg/0058/0003/0350/0362.htm.)
Kulander, B.R., and Dean, S.L., 1986, Structure and tectonics
of central and southern Appalachian Valley and Ridge and
Plateau Provinces, West Virginia and Virginia: American
Association of Petroleum Geologists Bulletin v. 70, no. 11,
p. 1674–1684. (Also available at http://archives.datapages.
com/data/bulletns/1986-87/data/pg/0070/0011/1650/
1674.htm.)
Milici, R.C., 1990, Oil and gas exploration and development
in Virginia, 1979–1988: Virginia Minerals, v. 36, no. 1,
p. 1–6.
Milici, R.C. and Swezey, C.S., 2006, Assessment of Appala-
chian Basin oil and gas resources; Devonian Shale–Middle
and Upper Paleozoic Total Petroleum System: U.S. Geolog-
ical Survey Open-File Report 2006–1237, 70 p., available
only at http://pubs.usgs.gov/of/2006/1237/.
Nicholson, S.W., Dicken, C.L., Horton, J.D., Labay, K.A.,
Foose, M.P., and Mueller, J.A.L., 2005, Preliminary inte-
grated geologic map databases for the United States; Ken-
tucky, Ohio, Tennessee, and West Virginia: U.S. Geological
Survey Open-File Report 2005–1324, available only at
http://pubs.usgs.gov/of/2005/1324/.
Nickelsen, R.P., 1963, Fold patterns and continuous defor-
mation mechanisms of the central Pennsylvania folded
Appalachians, in Wagner, W.R., and Nickelsen, R.P., eds.,
Tectonics and Cambrian-Ordovician stratigraphy, central
Appalachians of Pennsylvania, Guidebook, Pittsburgh Geo-
logical Society and Appalachian Geological Society field
trip, September 19–21, 1963: Pittsburgh, Pa., Pittsburgh
Geological Society, p. 13–29. (Also available at http://
archives.datapages.com/data/appalachian/tectonics_camb_
ordostrat63/nickelsen.pdf.)
Nickelsen, R.P., 1986, Cleavage duplexes in the Marcellus
Shale of the Appalachian foreland: Journal of Structural
Geology, v. 8, no. 3/4, p. 361–371, doi:10.1016/0191-
8141(86)90055-6.
20   Characterization of the Marcellus Shale Based on Compter-Assisted Correlation of Wireline Logs in Virginia and West Virginia
Ohio Department of Natural Resources, 2010, Stratigraphic
cross section trending northwest-southeast (along dip)
illustrating the Devonian Shale interval in eastern Ohio and
west-central West Virginia: Columbus, Ohio, Ohio Depart-
ment of Natural Resources, Division of Geological Survey,
Web page accessed March 29, 2013, at http://ohiodnr.com/
OhioGeologicalSurvey/tabid/23014/Default.aspx.
Olea, R.A., 2002a, Correlator, an interactive computer
program for high-resolution, lithostratigraphic, well-log
correlation: Kansas Geological Survey Open-File Report
2002–51, http://www.kgs.ku.edu/Publications/OFR/2002/
OFR02_51/ManualOFR2002-51.pdf.
Olea, R.A., 2002b, CORRELATOR cross section from Gove
to Harper Counties, Kansas: Kansas Geological Survey
Technical Series 16, 2 pls.
Olea, R.A., 2004, Correlator 5.2—a program for interactive
lithostratigraphic correlation of wireline logs: Comput-
ers & Geosciences, v. 30, p. 561–567, doi:10.1016/j.
cageo.2004.01.006.
Olea, R.A., and Guy, W.J., 2000, Subsurface geology of the
Schaben field, Ness County, Kansas: Kansas Geological
Survey Open-File Report 2000−52, 10 p., http://www.kgs.
ku.edu/PRS/publication/2000/ofr52/index.html.
O’Leary, D.W., Friedman, J.D., and Pohn, H.A., 1976,
Lineaments, linear, lineation; Some proposed new stan-
dards for old terms: Geological Society of America
Bulletin, v. 87, no. 10, p. 1463–1469, doi:10.1130/0016-
7606(1976)87<1463:LLLSPN>2.0.CO;2.
Piotrowski, R.G., and Harper, J.A., 1979, Black shale and
sandstone facies of the Devonian “Catskill” clastic wedge
in the subsurface of western Pennsylvania: U.S. Department
of Energy Morgantown Energy Technology Center, Eastern
Gas Shales Project Series. 13, 40 p., 39 pls. (Also available
at http://www.dcnr.state.pa.us/topogeo/econresource/oiland-
gas/marcellus/marcellus_egsp/index.htm.)
Piotrowski, R.G., and Krajewski, S.A., 1977a, Preliminary
stratigraphic cross section (C4
-D4
) showing radioactive
black shale zones and sandstones in the middle and upper
Devonian, western Pennsylvania: U.S. Department of
Energy Morgantown Energy Technology Center, Eastern
Gas Shales Project Series 5, 2 sheets.
Piotrowski, R.G., and Krajewski, S.A., 1977b, Preliminary
stratigraphic cross section (B1
-B4
) showing radioactive
black shale zones and sandstones in the middle and upper
Devonian, western Pennsylvania: Department of Energy
Morgantown Energy Technology Center Eastern Gas Shales
Project Series 7, 2 sheets.
Pohn, H.A., 2000, Lateral ramps in the folded Appalachians
and in overthrust belts worldwide—A fundamental ele-
ment of thrust-belt architecture: U.S. Geological Survey
Bulletin 2163, 71 p. (Also available at http://pubs.er.usgs.
gov/publication/b2163.)
Pohn, H.A., and Purdy, T.L., 1988, Disturbed zones; Indica-
tors of subsurface faults and possible hydrocarbon traps in
the Valley and Ridge and Appalachian Plateau provinces of
Pennsylvania, Maryland, Virginia, and West Virginia, chap.
C of Schultz, A.P., ed., Evolution of sedimentary basins:
U.S. Geological Survey Bulletin 1839–A–D, p. C1–C11.
(Also available at http://pubs.er.usgs.gov/publication/
b1839AD.)
Rader, E.K., and Evans, N.H., eds., 1993, Geologic map of
Virginia; expanded explanation: Virginia Division of Min-
eral Resources, 80 p.
Rader, E.K., and Gathright, T.M., II, comps., 2001, Geo-
logic map of the Front Royal 30 × 60 minute quadrangle:
Portions of Clarke, Page, Rockingham, Shenandoah, and
Warren Counties, Virginia: Virginia Division of Mineral
Resources Publication 162, 1 sheet, scale 1:100,000. (Also
available at http://www.dmme.virginia.gov/commercedocs/
PUB_162.pdf.)
Rader, E.K., and Wilkes, G.P., comps., 2001, Geologic map of
the Virginia portion of the Staunton 30 × 60 minute quad-
rangle: Virginia Division of Mineral Resources Publication
163, 1 sheet, scale 1:100,000. (Also available at http://www.
dmme.virginia.gov/commercedocs/PUB_163.pdf.)
Rader, E.K., McDowell, R.C., Gathright, T.M., II, and
Orndorff, R.C., 2001, Geologic map of the Virginia portion
of the Winchester 30 × 60 minute quadrangle: Virginia Divi-
sion of Mineral Resources Publication 161, 1 sheet, scale
1:100,000. (Also available at http://www.dmme.virginia.gov/
commercedocs/PUB_161.pdf.)
Rich, J.L., 1934, Mechanics of low-angle overthrust faulting as
illustrated by Cumberland thrust block, Virginia, Kentucky,
and Tennessee: American Association of Petroleum Geolo-
gists Bulletin, v. 18, no. 12, p. 1584–1596. (Also available at
http://archives.datapages.com/data/bulletns/1931-37/data/
pg/0018/0012/1550/1584.htm.)
Rodgers, John, 1949, Evolution of thought on structure of
middle and southern Appalachians: American Association of
Petroleum Geologists Bulletin v. 33, no. 10, p. 1643–1654.
(Also available at http://archives.datapages.com/data/
bulletns/1949-52/data/pg/0033/0010/1600/1643.htm.)
Rodgers, John, 1963, Mechanics of Appalachian foreland fold-
ing in Pennsylvania and West Virginia: American Associa-
tion of Petroleum Geologists Bulletin v. 47, no. 8, p. 1527–
1536. (Also available at http://archives.datapages.com/data/
bulletns/1961-64/data/pg/0047/0008/1500/1527.htm.)
References Cited  21
Roen, J.B., 1984, Geology of the Devonian black shales of the
Appalachian Basin: Organic Geochemistry v. 5, no. 4,
p. 241–254, doi:10.1016/0146-6380(84)90011-1.
Roen, J.B., and de Witt, Wallace, Jr., 1984, Stratigraphic
framework of the Devonian black shales of the Appalachian
basin: U.S. Geological Survey Open-File Report 84–111,
71 p. (Also available at http://pubs.er.usgs.gov/publication/
ofr84111.)
Schultz, A.P., 1997, Geology of the Broadtop Synclinorium
in the Winchester 30′ × 60′ quadrangle, West Virginia: U.S.
Geological Survey Open-File Report 97–143, 42 p., 1 pl.,
scale 1:100,000. (Also available at http://pubs.er.usgs.gov/
usgspubs/ofr/ofr97143.)
Schwietering, J.F., 1980, Preliminary cross section (C-C′) of
middle and upper Devonian in West Virginia: Department
of Energy Morgantown Energy Technology Center, Eastern
Gas Shales Project (EGSP) Series 210, 2 sheets.
Shumaker, R.C., 1980, Porous fracture facies in the Devonian
shales of eastern Kentucky and West Virginia, in Wheeler,
R.L., and Dean, C.S., eds., Proceedings, Western limits of
detachment and related structures in the Appalachian fore-
land; Southeastern Section Geological Society of America
meeting, Chattanooga, Tenn., April 6, 1978: U.S. Depart-
ment of Energy Report DOE/METC/SP-80/23, p. 124–132.
(Also available at http://www.netl.doe.gov/kmd/cds/disk7/
disk1/EGS%5CProceedings,%20Western%20Limits%20
of%20Detachment%20&%20Related%20Structur.pdf.)
Smith, G.J., Jacobi, R.D., Loewenstein, Stu, and Seever,
J.L., 2009, The influence of basement structures on Devo-
nian black shale thicknesses in the northern Appalachian
foreland basin [abs.], in AAPG annual convention abstracts,
Denver, Colo., June 7–9, 2009: Tulsa, Okla., American
Association of Petroleum Geologists, 1 CD-ROM. (Also
available at http://aapg09.mapyourshow.com/2_1/sessions/
session.cfm?ScheduledSessionID=1626.)
Smith, L.B., and Leone, James, 2010, Integrated character-
ization of Utica and Marcellus black shale gas plays, New
York State, in AAPG annual convention abstracts, New
Orleans, La., April 11–14, 2010: Tulsa, Okla., American
Association of Petroleum Geologists, 36 p., 1 CD-ROM.
(Also available at http://www.searchanddiscovery.com/
documents/2010/50289smith/ndx_smith.pdf.)
Southworth, C.S., 1986, Side-looking airborne radar image
map showing cross-strike structural discontinuities and
lineaments of the central Appalachians: U.S. Geological
Survey Miscellaneous Field Studies Map MF–1891, 14 p.,
1 sheet. (Also available at http://pubs.er.usgs.gov/
publication/mf1891.)
U.S. Geological Survey, 2011, Devonian Marcellus
Shale assessment units: U.S. Geological Survey data-
base accessed June 8, 2012, at http://energy.usgs.gov/
OilGas/AssessmentsData/NationalOilGasAssessment/
USBasinSummaries.aspx?theTab=dataTab&provcode=5067
Virginia Division of Gas and Oil, 2010, Division of Gas and
Oil: Virginia Division of Oil and Gas Web page accessed
June 11, 2013, at http://www.dmme.virginia.gov/DGO/
DgoLandingPage.shtml.
Watney, W.L., Olea, R.A., and Davis, J.C., 1999, Regional
stratigraphic analysis of a Pennsylvanian carbonate shelf
and margin in Kansas, in Transactions, American Associa-
tion of Petroleum Geologists Mid-Continent Section Meet-
ing, Wichita, Kans., August 29–31, 1999: Lawrence, Kans.,
Kansas Geological Survey, p. 52–62, http://www.kgs.ku.edu/
Conferences/midcont99/watney1.html.
West Virginia Geological and Economic Survey, 2010, Pipe-
line Plus: West Virginia Geological and Economic Survey
database accessed April 1, 2013 at http://www.wvgs.wvnet.
edu/pipe2/OGWISHelp.aspx.
Wheeler, R.L., 1980, Cross-strike structural discontinuities;
Possible exploration tool for natural gas in Appalachian
overthrust belt: American Association of Petroleum Geolo-
gists Bulletin, v. 64, no. 12, p. 2166–2178. (Also available
at http://archives.datapages.com/data/bulletns/1980-81/
data/pg/0064/0012/2150/2166.htm.)
Wheeler, R.L., 1983, Stratigraphic evidence for Devonian
tectonism on lineaments at Allegheny front, West Virginia—
Supporting material: U.S. Geological Survey Open-File
Report 83–243, 25 p. (Also available at http://pubs.er.usgs.
gov/publication/ofr83243.)
Wheeler, R.L., Winslow, Margaret, Horne, R.R., Dean, Stuart,
Kulander, Byron Drahovzal, J.A., Gold, D.P., Gilbert, O.E.,
Jr., Werner, Eberhard, Sites, Roy, and Perry, W.J., Jr., 1979,
Cross-strike structural discontinuities in thrust belts, mostly
Appalachian: Southeastern Geology, v. 20, no. 3,
p. 193–203.
Wilson, T.H., 1980, Cross-strike structural discontinuities;
Tear faults and transfer zones in the central Appalachians
of West Virginia: Morgantown, W. Va., West Virginia
University, Department of Geology and Geography, 147 p.
[Prepared under contract to U.S. Department of Energy,
Morgantown Energy Technology Center Report DE–AC21–
76ET12138.]
Wilson, T.H., and Shumaker, R.C., 1992, Broad Top thrust
sheet; An extensive blind thrust in the central Appala-
chians: American Association of Petroleum Geologists
Bulletin, v. 76, no. 9, p. 1310–1324. (Also available at
http://techplace.datapages.com/data/bulletns/1992-93/
data/pg/0076/0009/0000/1310.htm.)
Manuscript approved on July 1, 2013
For additional information regarding this
publication, contact:
Center Director, Eastern Energy Resources
Science Center
U.S. Geological Survey
12201 Sunrise Valley Drive
956 National Center
Reston, VA 20192
(703) 648-6401
Or visit the Eastern Energy Resources Science 	
Center Web site at:
http://energy.usgs.gov/GeneralInfo/
ScienceCenters/Eastern.aspx
Prepared by USGS Science Publishing Network staff:
James E. Banton, layout
Jeffrey Hartley, cartographer/illustrator
Elizabeth D. Koozmin, editor
Enomotoandothers—CharacterizationoftheMarcellusShaleinVirginiaandWestVirginia—ScientificInvestigationsReport2013–5131
ISSN 2328-0328 (online)
http://dx.doi.org/10.3133/sir20135131

More Related Content

Similar to How Thick is the Marcellus? USGS Report

Paleofluvial mega canyon_beneath_the_central_greenland_ice_sheet
Paleofluvial mega canyon_beneath_the_central_greenland_ice_sheetPaleofluvial mega canyon_beneath_the_central_greenland_ice_sheet
Paleofluvial mega canyon_beneath_the_central_greenland_ice_sheet
Sérgio Sacani
 
New_Specimens_of_Microraptor_zhaoianus_Theropoda_D.pdf
New_Specimens_of_Microraptor_zhaoianus_Theropoda_D.pdfNew_Specimens_of_Microraptor_zhaoianus_Theropoda_D.pdf
New_Specimens_of_Microraptor_zhaoianus_Theropoda_D.pdf
BraydenStoch2
 
From creekology to rocket science the evolution of remote sensing gis in oilg...
From creekology to rocket science the evolution of remote sensing gis in oilg...From creekology to rocket science the evolution of remote sensing gis in oilg...
From creekology to rocket science the evolution of remote sensing gis in oilg...
Texas Natural Resources Information System
 
FYFE_L_MSC_IPG_FINAL_PROJECT
FYFE_L_MSC_IPG_FINAL_PROJECTFYFE_L_MSC_IPG_FINAL_PROJECT
FYFE_L_MSC_IPG_FINAL_PROJECT
Laura-Jane Fyfe
 
Ancient aqueous environments_at_endeavour_crater_mars
Ancient aqueous environments_at_endeavour_crater_marsAncient aqueous environments_at_endeavour_crater_mars
Ancient aqueous environments_at_endeavour_crater_mars
Sérgio Sacani
 
Integrated Geophysical Investigation of a Suspected Spring in Igbokoran, Ikar...
Integrated Geophysical Investigation of a Suspected Spring in Igbokoran, Ikar...Integrated Geophysical Investigation of a Suspected Spring in Igbokoran, Ikar...
Integrated Geophysical Investigation of a Suspected Spring in Igbokoran, Ikar...
iosrjce
 
Xray diffraction results_from_msl_mineralogy_of_rocknest_at_gale_crater
Xray diffraction results_from_msl_mineralogy_of_rocknest_at_gale_craterXray diffraction results_from_msl_mineralogy_of_rocknest_at_gale_crater
Xray diffraction results_from_msl_mineralogy_of_rocknest_at_gale_crater
Sérgio Sacani
 

Similar to How Thick is the Marcellus? USGS Report (20)

Combined Dissertation
Combined DissertationCombined Dissertation
Combined Dissertation
 
Maths geology
Maths geologyMaths geology
Maths geology
 
USGS Study on Affects of Shale Fracking on Water Wells in Fayetteville Shale
USGS Study on Affects of Shale Fracking on Water Wells in Fayetteville ShaleUSGS Study on Affects of Shale Fracking on Water Wells in Fayetteville Shale
USGS Study on Affects of Shale Fracking on Water Wells in Fayetteville Shale
 
PAPER TECTONICA DE PLACAS
PAPER TECTONICA DE PLACASPAPER TECTONICA DE PLACAS
PAPER TECTONICA DE PLACAS
 
of_7948
of_7948of_7948
of_7948
 
USGS Pre-Fracking Water Well Study in Wayne County, PA
USGS Pre-Fracking Water Well Study in Wayne County, PAUSGS Pre-Fracking Water Well Study in Wayne County, PA
USGS Pre-Fracking Water Well Study in Wayne County, PA
 
Paleofluvial mega canyon_beneath_the_central_greenland_ice_sheet
Paleofluvial mega canyon_beneath_the_central_greenland_ice_sheetPaleofluvial mega canyon_beneath_the_central_greenland_ice_sheet
Paleofluvial mega canyon_beneath_the_central_greenland_ice_sheet
 
Evaluation of Heterogeneous Aquifers in Crystalline Rocks from Resistivity So...
Evaluation of Heterogeneous Aquifers in Crystalline Rocks from Resistivity So...Evaluation of Heterogeneous Aquifers in Crystalline Rocks from Resistivity So...
Evaluation of Heterogeneous Aquifers in Crystalline Rocks from Resistivity So...
 
Describing polar marine microbial communities by their metabolic structure
Describing polar marine microbial communities by their metabolic structureDescribing polar marine microbial communities by their metabolic structure
Describing polar marine microbial communities by their metabolic structure
 
New_Specimens_of_Microraptor_zhaoianus_Theropoda_D.pdf
New_Specimens_of_Microraptor_zhaoianus_Theropoda_D.pdfNew_Specimens_of_Microraptor_zhaoianus_Theropoda_D.pdf
New_Specimens_of_Microraptor_zhaoianus_Theropoda_D.pdf
 
From creekology to rocket science the evolution of remote sensing gis in oilg...
From creekology to rocket science the evolution of remote sensing gis in oilg...From creekology to rocket science the evolution of remote sensing gis in oilg...
From creekology to rocket science the evolution of remote sensing gis in oilg...
 
FYFE_L_MSC_IPG_FINAL_PROJECT
FYFE_L_MSC_IPG_FINAL_PROJECTFYFE_L_MSC_IPG_FINAL_PROJECT
FYFE_L_MSC_IPG_FINAL_PROJECT
 
ES_1976_BSc_Allen_Ralph_P (1)
ES_1976_BSc_Allen_Ralph_P (1)ES_1976_BSc_Allen_Ralph_P (1)
ES_1976_BSc_Allen_Ralph_P (1)
 
Ancient aqueous environments_at_endeavour_crater_mars
Ancient aqueous environments_at_endeavour_crater_marsAncient aqueous environments_at_endeavour_crater_mars
Ancient aqueous environments_at_endeavour_crater_mars
 
Integrated Geophysical Investigation of a Suspected Spring in Igbokoran, Ikar...
Integrated Geophysical Investigation of a Suspected Spring in Igbokoran, Ikar...Integrated Geophysical Investigation of a Suspected Spring in Igbokoran, Ikar...
Integrated Geophysical Investigation of a Suspected Spring in Igbokoran, Ikar...
 
Xray diffraction results_from_msl_mineralogy_of_rocknest_at_gale_crater
Xray diffraction results_from_msl_mineralogy_of_rocknest_at_gale_craterXray diffraction results_from_msl_mineralogy_of_rocknest_at_gale_crater
Xray diffraction results_from_msl_mineralogy_of_rocknest_at_gale_crater
 
The Impact of Seismic Facies Analysis on the Reservoir Architecture of “CHARL...
The Impact of Seismic Facies Analysis on the Reservoir Architecture of “CHARL...The Impact of Seismic Facies Analysis on the Reservoir Architecture of “CHARL...
The Impact of Seismic Facies Analysis on the Reservoir Architecture of “CHARL...
 
USGS Study Identifying Best Sources for Groundwater for Use in NY Fracking Op...
USGS Study Identifying Best Sources for Groundwater for Use in NY Fracking Op...USGS Study Identifying Best Sources for Groundwater for Use in NY Fracking Op...
USGS Study Identifying Best Sources for Groundwater for Use in NY Fracking Op...
 
Peterschmidt_Final_Paper
Peterschmidt_Final_PaperPeterschmidt_Final_Paper
Peterschmidt_Final_Paper
 
Chapter 14
Chapter 14Chapter 14
Chapter 14
 

More from Marcellus Drilling News

More from Marcellus Drilling News (20)

Five facts about shale: it’s coming back, and coming back strong
Five facts about shale: it’s coming back, and coming back strongFive facts about shale: it’s coming back, and coming back strong
Five facts about shale: it’s coming back, and coming back strong
 
Quarterly legislative action update: Marcellus and Utica shale region (4Q16)
Quarterly legislative action update: Marcellus and Utica shale region (4Q16)Quarterly legislative action update: Marcellus and Utica shale region (4Q16)
Quarterly legislative action update: Marcellus and Utica shale region (4Q16)
 
Access Northeast Pipeline Project - Dec 2016 Update
Access Northeast Pipeline Project - Dec 2016 UpdateAccess Northeast Pipeline Project - Dec 2016 Update
Access Northeast Pipeline Project - Dec 2016 Update
 
Rover Pipeline Letter to FERC Requesting Final Certificate
Rover Pipeline Letter to FERC Requesting Final CertificateRover Pipeline Letter to FERC Requesting Final Certificate
Rover Pipeline Letter to FERC Requesting Final Certificate
 
DOE Order Granting Elba Island LNG Right to Export to Non-FTA Countries
DOE Order Granting Elba Island LNG Right to Export to Non-FTA CountriesDOE Order Granting Elba Island LNG Right to Export to Non-FTA Countries
DOE Order Granting Elba Island LNG Right to Export to Non-FTA Countries
 
LSE Study: Fracking is Revitalizing U.S. Manufacturing
LSE Study: Fracking is Revitalizing U.S. ManufacturingLSE Study: Fracking is Revitalizing U.S. Manufacturing
LSE Study: Fracking is Revitalizing U.S. Manufacturing
 
Letter From 24 States Asking Trump & Congress to Withdraw the Unlawful Clean ...
Letter From 24 States Asking Trump & Congress to Withdraw the Unlawful Clean ...Letter From 24 States Asking Trump & Congress to Withdraw the Unlawful Clean ...
Letter From 24 States Asking Trump & Congress to Withdraw the Unlawful Clean ...
 
Report: New U.S. Power Costs: by County, with Environmental Externalities
Report: New U.S. Power Costs: by County, with Environmental ExternalitiesReport: New U.S. Power Costs: by County, with Environmental Externalities
Report: New U.S. Power Costs: by County, with Environmental Externalities
 
U.S. Crude Oil and Natural Gas Proved Reserves, Year-end 2015
U.S. Crude Oil and Natural Gas Proved Reserves, Year-end 2015U.S. Crude Oil and Natural Gas Proved Reserves, Year-end 2015
U.S. Crude Oil and Natural Gas Proved Reserves, Year-end 2015
 
U.S. EIA's Drilling Productivity Report - December 2015
U.S. EIA's Drilling Productivity Report - December 2015U.S. EIA's Drilling Productivity Report - December 2015
U.S. EIA's Drilling Productivity Report - December 2015
 
Velocys Plan to "Build the Business" - Gas-to-Liquids Plants
Velocys Plan to "Build the Business" - Gas-to-Liquids PlantsVelocys Plan to "Build the Business" - Gas-to-Liquids Plants
Velocys Plan to "Build the Business" - Gas-to-Liquids Plants
 
PA DEP Revised Permit for Natural Gas Compression Stations, Processing Plants...
PA DEP Revised Permit for Natural Gas Compression Stations, Processing Plants...PA DEP Revised Permit for Natural Gas Compression Stations, Processing Plants...
PA DEP Revised Permit for Natural Gas Compression Stations, Processing Plants...
 
PA DEP Permit for Unconventional NatGas Well Site Operations and Remote Piggi...
PA DEP Permit for Unconventional NatGas Well Site Operations and Remote Piggi...PA DEP Permit for Unconventional NatGas Well Site Operations and Remote Piggi...
PA DEP Permit for Unconventional NatGas Well Site Operations and Remote Piggi...
 
PA DEP: Methane Reduction Strategies for Natural Gas Operations
PA DEP: Methane Reduction Strategies for Natural Gas OperationsPA DEP: Methane Reduction Strategies for Natural Gas Operations
PA DEP: Methane Reduction Strategies for Natural Gas Operations
 
US EIA's December 2016 Short-Term Energy Outlook
US EIA's December 2016 Short-Term Energy OutlookUS EIA's December 2016 Short-Term Energy Outlook
US EIA's December 2016 Short-Term Energy Outlook
 
Northeast Gas Association's 2016 Statistical Guide
Northeast Gas Association's 2016 Statistical GuideNortheast Gas Association's 2016 Statistical Guide
Northeast Gas Association's 2016 Statistical Guide
 
PA PUC Responses to Auditor General's Act 13 Impact Fee Audit
PA PUC Responses to Auditor General's Act 13 Impact Fee AuditPA PUC Responses to Auditor General's Act 13 Impact Fee Audit
PA PUC Responses to Auditor General's Act 13 Impact Fee Audit
 
Pennsylvania Public Utility Commission Act 13/Impact Fees Audit by PA Auditor...
Pennsylvania Public Utility Commission Act 13/Impact Fees Audit by PA Auditor...Pennsylvania Public Utility Commission Act 13/Impact Fees Audit by PA Auditor...
Pennsylvania Public Utility Commission Act 13/Impact Fees Audit by PA Auditor...
 
Clyde Mine Discharge/Tenmile Creek Water Quality Final Report
Clyde Mine Discharge/Tenmile Creek Water Quality Final ReportClyde Mine Discharge/Tenmile Creek Water Quality Final Report
Clyde Mine Discharge/Tenmile Creek Water Quality Final Report
 
FERC Order Denying Stay of Kinder Morgan's Broad Run Expansion Project
FERC Order Denying Stay of Kinder Morgan's Broad Run Expansion ProjectFERC Order Denying Stay of Kinder Morgan's Broad Run Expansion Project
FERC Order Denying Stay of Kinder Morgan's Broad Run Expansion Project
 

Recently uploaded

₹5.5k {Cash Payment} Independent Greater Noida Call Girls In [Delhi INAYA] 🔝|...
₹5.5k {Cash Payment} Independent Greater Noida Call Girls In [Delhi INAYA] 🔝|...₹5.5k {Cash Payment} Independent Greater Noida Call Girls In [Delhi INAYA] 🔝|...
₹5.5k {Cash Payment} Independent Greater Noida Call Girls In [Delhi INAYA] 🔝|...
Diya Sharma
 

Recently uploaded (20)

Busty Desi⚡Call Girls in Sector 62 Noida Escorts >༒8448380779 Escort Service
Busty Desi⚡Call Girls in Sector 62 Noida Escorts >༒8448380779 Escort ServiceBusty Desi⚡Call Girls in Sector 62 Noida Escorts >༒8448380779 Escort Service
Busty Desi⚡Call Girls in Sector 62 Noida Escorts >༒8448380779 Escort Service
 
Gujarat-SEBCs.pdf pfpkoopapriorjfperjreie
Gujarat-SEBCs.pdf pfpkoopapriorjfperjreieGujarat-SEBCs.pdf pfpkoopapriorjfperjreie
Gujarat-SEBCs.pdf pfpkoopapriorjfperjreie
 
Defensa de JOH insiste que testimonio de analista de la DEA es falso y solici...
Defensa de JOH insiste que testimonio de analista de la DEA es falso y solici...Defensa de JOH insiste que testimonio de analista de la DEA es falso y solici...
Defensa de JOH insiste que testimonio de analista de la DEA es falso y solici...
 
04052024_First India Newspaper Jaipur.pdf
04052024_First India Newspaper Jaipur.pdf04052024_First India Newspaper Jaipur.pdf
04052024_First India Newspaper Jaipur.pdf
 
America Is the Target; Israel Is the Front Line _ Andy Blumenthal _ The Blogs...
America Is the Target; Israel Is the Front Line _ Andy Blumenthal _ The Blogs...America Is the Target; Israel Is the Front Line _ Andy Blumenthal _ The Blogs...
America Is the Target; Israel Is the Front Line _ Andy Blumenthal _ The Blogs...
 
Enjoy Night ≽ 8448380779 ≼ Call Girls In Palam Vihar (Gurgaon)
Enjoy Night ≽ 8448380779 ≼ Call Girls In Palam Vihar (Gurgaon)Enjoy Night ≽ 8448380779 ≼ Call Girls In Palam Vihar (Gurgaon)
Enjoy Night ≽ 8448380779 ≼ Call Girls In Palam Vihar (Gurgaon)
 
BDSM⚡Call Girls in Indirapuram Escorts >༒8448380779 Escort Service
BDSM⚡Call Girls in Indirapuram Escorts >༒8448380779 Escort ServiceBDSM⚡Call Girls in Indirapuram Escorts >༒8448380779 Escort Service
BDSM⚡Call Girls in Indirapuram Escorts >༒8448380779 Escort Service
 
Julius Randle's Injury Status: Surgery Not Off the Table
Julius Randle's Injury Status: Surgery Not Off the TableJulius Randle's Injury Status: Surgery Not Off the Table
Julius Randle's Injury Status: Surgery Not Off the Table
 
Nara Chandrababu Naidu's Visionary Policies For Andhra Pradesh's Development
Nara Chandrababu Naidu's Visionary Policies For Andhra Pradesh's DevelopmentNara Chandrababu Naidu's Visionary Policies For Andhra Pradesh's Development
Nara Chandrababu Naidu's Visionary Policies For Andhra Pradesh's Development
 
06052024_First India Newspaper Jaipur.pdf
06052024_First India Newspaper Jaipur.pdf06052024_First India Newspaper Jaipur.pdf
06052024_First India Newspaper Jaipur.pdf
 
Verified Love Spells in Little Rock, AR (310) 882-6330 Get My Ex-Lover Back
Verified Love Spells in Little Rock, AR (310) 882-6330 Get My Ex-Lover BackVerified Love Spells in Little Rock, AR (310) 882-6330 Get My Ex-Lover Back
Verified Love Spells in Little Rock, AR (310) 882-6330 Get My Ex-Lover Back
 
Embed-2 (1).pdfb[k[k[[k[kkkpkdpokkdpkopko
Embed-2 (1).pdfb[k[k[[k[kkkpkdpokkdpkopkoEmbed-2 (1).pdfb[k[k[[k[kkkpkdpokkdpkopko
Embed-2 (1).pdfb[k[k[[k[kkkpkdpokkdpkopko
 
Enjoy Night ≽ 8448380779 ≼ Call Girls In Gurgaon Sector 46 (Gurgaon)
Enjoy Night ≽ 8448380779 ≼ Call Girls In Gurgaon Sector 46 (Gurgaon)Enjoy Night ≽ 8448380779 ≼ Call Girls In Gurgaon Sector 46 (Gurgaon)
Enjoy Night ≽ 8448380779 ≼ Call Girls In Gurgaon Sector 46 (Gurgaon)
 
Busty Desi⚡Call Girls in Vasundhara Ghaziabad >༒8448380779 Escort Service
Busty Desi⚡Call Girls in Vasundhara Ghaziabad >༒8448380779 Escort ServiceBusty Desi⚡Call Girls in Vasundhara Ghaziabad >༒8448380779 Escort Service
Busty Desi⚡Call Girls in Vasundhara Ghaziabad >༒8448380779 Escort Service
 
Kishan Reddy Report To People (2019-24).pdf
Kishan Reddy Report To People (2019-24).pdfKishan Reddy Report To People (2019-24).pdf
Kishan Reddy Report To People (2019-24).pdf
 
WhatsApp 📞 8448380779 ✅Call Girls In Chaura Sector 22 ( Noida)
WhatsApp 📞 8448380779 ✅Call Girls In Chaura Sector 22 ( Noida)WhatsApp 📞 8448380779 ✅Call Girls In Chaura Sector 22 ( Noida)
WhatsApp 📞 8448380779 ✅Call Girls In Chaura Sector 22 ( Noida)
 
₹5.5k {Cash Payment} Independent Greater Noida Call Girls In [Delhi INAYA] 🔝|...
₹5.5k {Cash Payment} Independent Greater Noida Call Girls In [Delhi INAYA] 🔝|...₹5.5k {Cash Payment} Independent Greater Noida Call Girls In [Delhi INAYA] 🔝|...
₹5.5k {Cash Payment} Independent Greater Noida Call Girls In [Delhi INAYA] 🔝|...
 
BDSM⚡Call Girls in Sector 143 Noida Escorts >༒8448380779 Escort Service
BDSM⚡Call Girls in Sector 143 Noida Escorts >༒8448380779 Escort ServiceBDSM⚡Call Girls in Sector 143 Noida Escorts >༒8448380779 Escort Service
BDSM⚡Call Girls in Sector 143 Noida Escorts >༒8448380779 Escort Service
 
Group_5_US-China Trade War to understand the trade
Group_5_US-China Trade War to understand the tradeGroup_5_US-China Trade War to understand the trade
Group_5_US-China Trade War to understand the trade
 
05052024_First India Newspaper Jaipur.pdf
05052024_First India Newspaper Jaipur.pdf05052024_First India Newspaper Jaipur.pdf
05052024_First India Newspaper Jaipur.pdf
 

How Thick is the Marcellus? USGS Report

  • 1. 3,300 3,400 3,500 3,600 4,200 4,300 4,400 4,500 U.S. Department of the Interior U.S. Geological Survey Scientific Investigations Report 2013­­–5131 Characterization of the Marcellus Shale Based on Computer-Assisted Correlation of Wireline Logs in Virginia and West Virginia
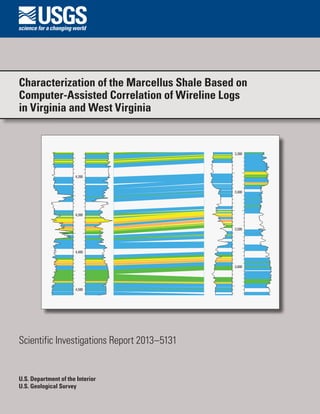
  • 2. Cover.  An example of correlation strength between two well logs (each with accompanying gamma-ray and bulk-density data), determined using the Correlator 5.2 program. Colors indicate correlation strength in percent, blue to orange being weakest to strongest, respectively.
  • 3. Characterization of the Marcellus Shale Based on Computer-Assisted Correlation of Wireline Logs in Virginia and West Virginia By Catherine B. Enomoto, Ricardo A. Olea, and James L. Coleman, Jr. Scientific Investigations Report 2013–5131 U.S. Department of the Interior U.S. Geological Survey
  • 4. U.S. Department of the Interior SALLY JEWELL, Secretary U.S. Geological Survey Suzette M. Kimball, Acting Director U.S. Geological Survey, Reston, Virginia: 2014 For more information on the USGS—the Federal source for science about the Earth, its natural and living resources, natural hazards, and the environment, visit http://www.usgs.gov or call 1–888–ASK–USGS. For an overview of USGS information products, including maps, imagery, and publications, visit http://www.usgs.gov/pubprod To order this and other USGS information products, visit http://store.usgs.gov Any use of trade, firm, or product names is for descriptive purposes only and does not imply endorsement by the U.S. Government. Although this information product, for the most part, is in the public domain, it also may contain copyrighted materials as noted in the text. Permission to reproduce copyrighted items must be secured from the copyright owner. Suggested citation: Enomoto, C.B., Olea, R.A., and Coleman, J.L., Jr., 2014, Characterization of the Marcellus Shale based on computer- assisted correlation of wireline logs in Virginia and West Virginia: U.S. Geological Survey Scientific Investigations Report 2013–5131, 21 p., available at http://dx.doi.org/10.3133/sir20135131. ISSN 2328-0328 (online)
  • 5. iii Contents Abstract............................................................................................................................................................1 Introduction ....................................................................................................................................................1 Stratigraphy............................................................................................................................................4 Structural Geology.................................................................................................................................7 Exploration and Production History in the Study Area....................................................................8 Procedures......................................................................................................................................................9 Results and Analyses...................................................................................................................................13 Conclusions...................................................................................................................................................18 Acknowledgments........................................................................................................................................18 References Cited..........................................................................................................................................18 Figures 1.  Map of the study area showing the assessment units from the recent assessment of undiscovered oil and gas resources in the Devonian Marcellus Shale, the thickness of radioactive black shale in the undivided Marcellus Shale and Skaneateles Shale, and the apparent thickness of the Millboro Shale interpreted from the nine wireline logs included in this study.............2 2.  Photograph of a third-order fold in the Brallier Formation in Hampshire County, West Virginia....................................................................................................................3 3.  Map showing regional structural geology of eastern West Virginia and western Virginia, including major tectonic features, the location of the cross section shown on figure 4, and the location of the study area shown in figure 7............................................................................................................................5 4.  Cross section across Broadtop synclinorium and Nittany anticlinorium illustrating first- and third-order folds within middle and lower Paleozoic strata.............................................................................................................................6 Plates [As separate files; click link to access] 1.  Wireline well logs through Middle Devonian shales in Highland and Rockingham Counties, Virginia, and Pendleton and Hardy Counties, West Virginia 2.  Cross section created by the Correlator program on the basis of calculated correlation strength between well wireline logs through Middle Devonian shales in Highland and Rockingham Counties, Virginia, and Pendleton and Hardy Counties, West Virginia 3.  Cross section created by the Correlator program by recoding correlation strength in plate 2 to denote stratigraphic intervals using well wireline logs through Middle Devo- nian shales in Highland and Rockingham Counties, Virginia, and Pendleton and Hardy Counties, West Virginia 4.  Cross section created by the Correlator program on the basis of persistent correlation strength between well wireline logs through Middle Devonian shales in Highland and Rockingham Counties, Virginia, and Pendleton and Hardy Counties, West Virginia
  • 6. iv 5.  Schematic stratigraphic chart showing Lower Devonian to Upper Devonian strata of the central Valley and Ridge and Appalachian Plateaus provinces in western Virginia and eastern West Virginia......................................7 6.  Digital wireline log curves for the Fulk No. 1 well illustrating the initial interpretation for locating the tops of the Millboro Shale, Needmore Shale, and Oriskany Sandstone using the criteria described in the text...........................10 7.  Map of study area showing the outcrop area of the Middle Devonian Marcellus Shale or Millboro Shale with Needmore Shale or Huntersville Chert, regional faults, and the locations of the nine wells used in this study and the cross sections.....................................................................................................11 8.  Wireline log showing gamma-ray and dipmeter measurements in well HI–0004, Highland County, Virginia...................................................................................16 Tables 1.  Wells used in this study................................................................................................................3 2.  Apparent thickness of interpreted intervals estimated from wireline logs.........................4 3.  Percentage of the interval where correlation strength between well pairs exceeded 60 percent...................................................................................................................14 4.  Mean gamma-ray values, calculated for each interval........................................................14 5.  Mean bulk-density values calculated for each interval.......................................................14 Conversion Factors Multiply By To obtain Length foot (ft) 0.3048 meter (m) meter (m) 3.281 foot (ft) kilometer (km) 0.6214 mile (mi) Volume cubic foot (ft3 ) 0.02832 cubic meter (m3 ) Density gram per cubic centimeter (g/cm3 , or g/cc) 62.4220 pound per cubic foot (lb/ft3 ) Gas volume measurements are shown using the standard industry abbreviations of MMCF (millions of cubic feet) or BCF (billions of cubic feet).
  • 7. Abstract The Middle Devonian Marcellus Shale in the Appala- chian basin extends from central Ohio on the west to eastern New York on the east, and from north-central New York on the north to northern Tennessee on the south. Its thickness ranges from 0 feet (ft) where it pinches out to the west to as much as 700 ft in its eastern extent. Within the Broadtop synclinorium, the thickness of the Marcellus Shale ranges from 250 to 565 ft. Although stratigraphic complexities have been documented, a significant range in thickness most likely is because of tectonic thickening from folds and thrust faults. Outcrop studies in the Valley and Ridge and Appalachian Plateaus provinces illustrate the challenges of interpreting the relation of third-order faults, folds, and “disturbed” zones to the regional tectonic framework. Recent field work within the Valley and Ridge province determined that significant faulting and intraformational deformation are present within the Mar- cellus Shale at the outcrop scale. In an attempt to determine if this scale of deformation is detectable with conventional wireline logs, petrophysical properties (primarily mineralogy and porosity) were measured by interpretation of gamma-ray and bulk-density logs. The results of performing a statisti- cal correlation of wireline logs from nine wells indicated that there are discontinuities within the Millboro Shale (undiffer- entiated Marcellus Shale and Mahantango Formation) where there are significant thickness differences between wells. Also, some intervals likely contain mineralogy that makes these zones more prone to layer-shortening cleavage duplexes. The Correlator program proved to be a useful tool in a region of contractional deformation. Introduction Many of the geologists who mapped the eastern Appa- lachian basin collectively described the Marcellus Shale as a dark-gray to black, thinly laminated, fissile, pyritic shale with interbeds of dark-gray, argillaceous limestone or calcareous shale, containing limestone concretions and sparse fossils (Dean and others, 1985; Hasson and Dennison, 1988; Schultz, 1997; Rader and Gathright, 2001). The regional thickness of the Marcellus Shale ranges from 0 feet (ft) where it pinches out in east-central Ohio and western West Virginia to as much as 700 ft in southeastern New York (Roen, 1984; Milici and Swezey, 2006; Boyce and Carr, 2009; Ohio Department of Natural Resources, 2010; Smith and Leone, 2010). Within the Broadtop synclinorium (Jacobeen and Kanes, 1974), geologists estimated that the thickness of the Marcellus Shale ranged from 250 to 565 ft (Rader and Gathright, 2001; Rader and others, 2001; Enomoto, 2009) (fig. 1). The range of the measurements is most likely the result of folding and fault- ing within the Middle to Upper Devonian shale, especially within the Valley and Ridge province (fig. 2); also, Roen (1984) reported the thickness of radioactive black shale in the undivided Skaneateles Shale and Marcellus Shale (fig. 1), whereas Enomoto (2009) reported the uncorrected wireline log thickness of the Millboro Shale (tables 1, 2). The Valley and Ridge province of the central Appalachian basin is characterized by thin-skinned structural deformation (Rich, 1934; Rodgers, 1949, 1963); the locations of two of the major décollements underlying the Valley and Ridge are inter- preted to be within shale of the Lower Cambrian Rome For- mation and Upper Ordovician Martinsburg Formation (Harris and Milici, 1977). Another major décollement exists southwest of the study area in Middle to Upper Devonian shale (Rich, 1934; Harris and Milici, 1977; Kulander and Dean, 1986). The regional map showing structural features and the cross section of Kulander and Dean (1986) (figs. 3, 4) depict the overall structural style of the western Valley and Ridge province. The cross section traverses west to east from Pocahontas County, West Virginia, to Augusta County, Virginia, and provides a point of reference for the structural features included in the study area. Formations consisting of mostly shale and mudstone and commonly exhibiting structures indicative of ductile deforma- tion are associated with the major folds caused by the move- ment on these décollement surfaces. Nickelsen (1963) defined folds with wavelengths between 7 and 10 miles (mi) as “first- order folds,” folds with wavelengths between 1.5 and 2 mi as Characterization of the Marcellus Shale Based on Computer-Assisted Correlation of Wireline Logs in Virginia and West Virginia By Catherine B. Enomoto, Ricardo A. Olea, and James L. Coleman, Jr.
  • 8. 2   Characterization of the Marcellus Shale Based on Compter-Assisted Correlation of Wireline Logs in Virginia and West Virginia 468 520 563 317 445 251 564 458 447 0 25 50 75 100 100 100 50 125 150 200 200 125 75 125 100 75 0 100 KILOMETERS25 50 75 0 25 50 75 100 MILES VIRGINIA WEST VIRGINIA OHIO KENTUCKY MARYLAND Washington, D.C. PENNSYLVANIA NEW YORK NEW JERSEY DELAWARE UNITED STATES CANADA Lake Erie AtlanticOcean 42° 82° 80° 78° 76° 40° 38° EXPLANATION Foldbelt Marcellus AU—A few to more than 350 feet thick Interior Marcellus AU—More than 50 feet thick Western Margin Marcellus AU—Less than 50 feet thick Isoline showing thickness of Marcellus Shale and Skaneateles Shale (undivided)—Contour interval is 25 feet Well—Number indicates thickness of Millboro Shale, in feet (see tables 1 and 2) Assessment unit (AU) 100 445 Base from ESRI digital data, 2007, 1:500,000 Geographic projection North American Datum of 1983 Figure 1.  Map of the study area showing the assessment units from the recent assessment of undiscovered oil and gas resources in the Devonian Marcellus Shale (Coleman and others, 2011; U.S. Geological Survey, 2011), the thickness of radioactive black shale in the undivided Marcellus Shale and Skaneateles Shale (Roen, 1984), and the apparent thickness of the Millboro Shale interpreted from the nine wireline logs included in this study (Enomoto, 2009). Contour lines are in feet (ft).
  • 9. Introduction   3 Figure 2.  Photograph of a third-order fold in the Brallier Formation in Hampshire County, West Virginia. This fold is typical of those found in Devonian shale in the Valley and Ridge province. The location is approximately 350 feet northeast of the ford over the Cacapon River by Dave Mooreland Road, approximately 2 miles from the village of Levels (approximate location lat 39°28'17"N., long 78°31'27"W.). Table 1.  Wells used in this study. Regulatory number API number Operator Well name State Latitude Longitude HI–0003 4509123504 Cabot Oil & Gas Corp. George Washington National Forest No. 1 Virginia 38°20'0.24" 79°44'43.80" HI–0001 4509120036 Pennzoil United, Inc. Bertha Smith No. 1 Virginia 38°24'50.76" 79°20'21.12" RO–0018 4516520171 Crab Run Gas Co. George Washington National Forest No. 3 Virginia 38°30'23.40" 79°9'16.20" RO–0024 4516520384 Merrill Natural Resources, Inc. Floyd Fulk No. 1 Virginia 38°39'5.76" 78°59'33.72" RO–0021 4516520373 Yankee Explora- tion, Inc. Moyers No. 1 Virginia 38°48'21.96" 78°56'41.64" HD–0015 4703100015 United Fuel Gas William J.B. Orr No. 1 West Virginia 39°1'31.15" 78°49'3.29" PD–0010 4707100010 Union Drilling Co. Monongahela National Forest No. 1 West Virginia 38°54'36.50" 79°20'50.82" PD–0011 4707100011 Berea Oil & Gas Corp. R.C. & M.M. Hed- rick No. 1 West Virginia 38°50'42.36" 79°31'28.74" HI–0004 4509123522 Cabot Oil & Gas Corp. Red Oak Ranch No. 1 Virginia 38°27'40.68" 79°40'3.72"
  • 10. 4   Characterization of the Marcellus Shale Based on Compter-Assisted Correlation of Wireline Logs in Virginia and West Virginia “second-order folds,” and folds with wavelengths less than 0.5 mi as “third-order folds.” “Disturbed” zones were documented in western Maryland and eastern West Virginia by Jacobeen and Kanes (1974); in central Pennsylvania, western Mary- land, and northern West Virginia by Pohn and Purdy (1988); and in northern West Virginia by Schultz (1997). Shumaker (1980) proposed that fractures observed in highly organic- rich portions of Devonian shale in oriented cores from wells in Kentucky and West Virginia have a limited stratigraphic extent and are related to stress resulting from their preferen- tial orientation. The cleavage duplexes studied by Nickelsen (1986) showed significant layer-parallel shortening, but no details were given to explain how the shortening affected the thickness measurements of the formation in which the cleav- age duplexes occurred. An example of the third-order folding is illustrated in figure 2. The objective of this study was to test whether the third- order folds observed in outcrop were discernible in the sub- surface by correlating wireline logs using a computer program not used previously in this tectonic setting. The correlation of nine wireline logs containing gamma-ray and bulk-density curves showed variations in thickness that likely were caused by third-order structural features. Traditional well-log cor- relation commonly results in the interpretation of absent and repeated sections and selects the location of the fault planes in the subsurface at these interpreted intervals. This study used Correlator 5.2, a computer program originally designed to correlate wireline logs in extensional regimes, such as the U.S. Gulf Coast (Olea, 2002a) and mid-continent regions (Watney and others, 1999; Olea and Guy, 2000; Olea, 2000b). In this study, the program was used for the first time to correlate wire- line logs in a contractional tectonic regime. The program was used to infer the locations of discontinuities in the subsurface that may have caused the “disturbed” zones, which were evi- dent in outcrop. Stratigraphy The stratigraphic succession in the study area in eastern West Virginia and western Virginia consists of Cambrian through Lower Mississippian sedimentary rocks, including thick carbonate sequences in the Ordovician, Silurian, and Lower Mississippian and siliciclastic sequences in the Lower and Middle Cambrian, and Devonian. The primary strati- graphic units in this study are the Lower and Middle Devo- nian mudstone and shale within the Needmore Shale and the Middle Devonian Marcellus Shale and Mahantango Forma- tion. Where the Marcellus Shale and Mahantango Formation cannot be differentiated, they are mapped as one unit and referred to as the Millboro Shale in westernmost Virginia and easternmost West Virginia (de Witt and others, 1993; Rader and Evans, 1993) (fig. 5). The Needmore Shale overlies the Lower Devonian Oriskany Sandstone in most of the study area where the Lower and Middle Devonian Onondaga Limestone is not present or discernible. The Needmore Shale is a dark-gray, silty shale, typically with subtle to distinct laminations in outcrop. The regionally extensive Middle Devonian Tioga Ash Bed, which consists of brownish-gray to brownish-black, highly mica- ceous ash and chert, occurs at the top of the Needmore Shale (or the Onondaga Limestone, where the Needmore Shale is absent), separating it from the Marcellus Shale. The Tioga Ash Bed rarely is exposed in the study area because it is highly susceptible to weathering. The Marcellus Shale in the study area is typically a dark- gray to black mudstone or shale with a high organic-material content, weathers to gray or brown chips on outcrop, and contains pyritic zones and zones of calcareous concretions and limestone beds. The Marcellus Shale commonly exhibits well- developed jointing in three directions, chaotic bedding, shear zones, pencil fracturing, and fractures that contain calcite and pyrite. Table 2.  Apparent thickness of interpreted intervals estimated from wireline logs. Regulatory number API number Millboro Shale interval 1 (feet) Millboro Shale interval 2 (feet) Millboro Shale interval 3 (feet) Millboro Shale total thickness (feet) Needmore Shale total thickness (feet) HI–0003 4509123504 99 211 137 447 143 HI–0001 4509120036 96 202 147 445 149 RO–0018 4516520171 64 162 91 317 163 RO–0024 4516520384 141.5 294 127 562.5 103 RO–0021 4516520373 165 279 76 520 96.5 HD–0015 4703100015 58.5 231.5 177 467 127 PD–0010 4707100010 78 120 53 251 181.5 PD–0011 4707100011 108 329 126.5 563.5 154.5 HI–0004 4509123522 103 245 109.5 457.5 171.5 Minimum 58.5 120 53 251 96.5 Maximum 165 329 177 563.5 181.5
  • 11. Introduction   5 Allegheny Plateau Cumberland Plateau WEST VIRGINIA VIRGINIA PENNSYLVANIA Study area Portion of cross section 5 in figure 6 of Kulander and Dean (1986), shown in figure 4 of this report KENTUCKY OHIO Blue Ridge anticlinorium TENNESSEE NORTH CAROLINA Central Appalachians Southern Appalachians Pine Mountain sheet Pulaski sheet Pulaski sheet St. Paul-Honaker sheet Copper Creek sheet Mountain City window Holston Mountain sheet Cove Mountain sheet Richlands sheet Zone Transition Style Structural Saltville sheet St. Clair Narrows sheet Intraplateau str ucturalfront MARYLAND Nittany Broadtop Folded plateau anticlinorium anticlinorium M assanutten - Bl ue Ridge sheet M assanutten synclinorium Mead ow Branch synclinorium Caca pon M ountain-AdamsRunanticlinorium Alleghenystructuralfront 83° 39° 38° 37° 82° 81° 80° 79° 78° 0 50 KILOMETERS10 20 30 40 0 Base from U.S. Geological Survey digital data, 2005, 1:2,000,000 Albers Equal-Area Conic projection Standard parallels 29°30' and 45°30' Central meridian -96°, latitude of origin 23° North American Datum of 1983 10 20 30 40 50 MILES EXPLANATION Thrust fault Fault Structural province boundary Boundary between southern and central Appalachians Trace of structural front Cross section Figure 3.  Map showing regional structural geology of eastern West Virginia and western Virginia, including major tectonic features, the location of the cross section shown on figure 4, and the location of the study area shown in figure 7. Modified from Kulander and Dean (1986); used by permission of the American Association of Petroleum Geologists, whose permission is required for further use.
  • 12. 6   Characterization of the Marcellus Shale Based on Compter-Assisted Correlation of Wireline Logs in Virginia and West Virginia Thrustfault—Arrowshowsrelativemotion. Dashedwhereapproximatelylocated Otherfault Contact Feet 0 5,000 10,000 15,000 20,000 25,000 30,000 m m u l Ol Om Om Ou m u Ol Ou S S Ol Ou DlDl SS S DmDu m u Ol Om u m Dl SDm Du ll DlDl DmS S Om Ol u m SS S Ou Ou l Du u Dl Om Om u Ol Om Om S Dm OmOl S Ou Om Ol S S Dm S Om Ol m NittanyanticlinoriumBroadtopsynclinorium HIGHLAND COUNTY AUGUSTA COUNTY HIGHLAND COUNTY WillsMountain anticline WarmSprings anticline NorthwestSoutheast Allegheny structural front McClung syncline Rangeoftypicalthird-orderfold Rangeoftypicalfirst-orderfold EXPLANATION Décollement Precambrianrocks(undivided) UpperCambrianrocks(undivided) mMiddleCambrianrocks(undivided) lLowerCambrianrocks(undivided) OlLowerOrdovicianrocks(undivided) 05KILOMETERS1234 012345MILES DuUpperDevonianrocks(undivided) DmMiddleDevonianrocks(undivided) DlLowerDevonianrocks(undivided) SSilurianrocks(undivided) OuUpperOrdovicianrocks(undivided) OmMiddleOrdovicianrocks(undivided) Figure4. CrosssectionacrossBroadtopsynclinoriumandNittanyanticlinoriumillustratingfirst-andthird-orderfoldswithinmiddleandlowerPaleozoicstrata.Modifiedfrom KulanderandDean(1986);usedbypermissionoftheAmericanAssociationofPetroleumGeologists,whosepermissionisrequiredforfurtheruse.
  • 13. Introduction   7 Conformably overlying the Marcellus Shale is the Mahantango Formation, a dark-gray to gray shale and silty shale. The Mahantango Formation typically has low organic- material content and minimal chaotic bedding and internal deformation. Concretions are absent to rare. Where the Mahantango Formation cannot be differentiated from the Marcellus Shale, the two formations are mapped collectively as the Millboro Shale in Virginia and West Virginia (de Witt and others, 1993; Rader and Evans, 1993). The Mahantango Formation grades upward into the Upper Devonian Brallier Formation, the base of which is its lowest siltstone bed. The Brallier Formation extends upward to the base of the Upper Devonian Foreknobs Formation, which is a mixed greenish- gray and red sandstone and shale interval formerly referred to as the Chemung Formation (Rader and Evans, 1993). The Marcellus Shale is recognized on gamma-ray wireline logs as one or more highly radioactive zones approxi- mately 100 to 200 ft above the top of the Oriskany Sandstone (Piotrowski and Krajewski, 1977a,b; Schwietering, 1980; Roen and de Witt, 1984; de Witt and others, 1993). These radioactive zones have the highest total organic carbon content and are the objective zones for drilling and production of natural gas in the Marcellus Shale gas play. The distinctive log character of the Marcellus Shale facilitates well-log correla- tions in the structurally complex Valley and Ridge province. The total thickness of radioactive Marcellus Shale ranges from 0 ft where it pinches out to the west to over 700 ft in south- eastern New York (Piotrowski and Harper, 1979; Erenpreiss and others, 2011); however, Smith and others (2009) reported that the thickening that may result from thrust faults may be overlooked easily in typical wireline logs, even though such thrust faults are recognizable in outcrop and high-resolution borehole image logs. Detailed wireline log correlations by Enomoto (2009) suggest that thickness variations within the study area may result from structural deformation in the organic-rich shale intervals. In the study area, the Marcellus Shale and the Mahantango Formation are not differentiated on published geologic maps; therefore, the term “Millboro Shale” was used in the annotation of the formation tops on the wireline well logs and in the accompanying figures. Structural Geology The study area is mostly within the western part of the Valley and Ridge province, including portions of the Broadtop Figure 5.  Schematic stratigraphic chart showing Lower Devonian to Upper Devonian strata of the central Valley and Ridge and Appalachian Plateaus provinces in western Virginia and eastern West Virginia. Modified from Kulander and Dean (1986), Flaherty (1996), and Milici and Swezey (2006). West Virginia and Virginia Mahantango Formation Marcellus Shale Onondaga Limestone Huntersville Chert Needmore Shale Oriskany Sandstone DEVONIAN MiddleLowerUpper Brallier Formation Tioga Ash Bed Millboro Shale Foreknobs Formation (formerly Chemung Formation) Series System Stratigraphic unit West East EXPLANATION Ash bed Chert Limestone and (or) dolomite Sandstone Shale
  • 14. 8   Characterization of the Marcellus Shale Based on Compter-Assisted Correlation of Wireline Logs in Virginia and West Virginia synclinorium and the Nittany anticlinorium (figs. 3, 4; Kulander and Dean, 1986); however, the locations of four of the wells used in the study are west of the Allegheny structural front (ASF). In the study area, stratigraphic units at the surface typically range from Lower Devonian to Upper Devonian, with thin intervals of Mississippian strata present in the core of the deepest synclines (Schultz, 1997; Dicken and others, 2005; Nicholson and others, 2005). In some places, Silurian and older Paleozoic rocks reach the surface in the cores of anticlines. The study area is bordered on the northwest by the Appalachian Plateaus province and on the southeast by the North Mountain fault, which brings the lower Paleozoic carbonate strata that floor the Shenandoah Valley into jux- taposition with Devonian strata. According to Jacobeen and Kanes (1974), who used two-dimensional seismic data, sample descriptions of cuttings, and wireline well logs to interpret the subsurface, the thrust faults are rooted in the Ordovician Mar- tinsburg Formation tens of thousands of feet below the surface. This interpretation is used by Kulander and Dean (1986) in their subregional analysis, where they depict regional thrust faults rising out of the Lower Cambrian shale on a structural ramp up into the Ordovician Martinsburg Formation from which the deformation within the Lower and Middle Devonian shale is derived (fig. 4). Deep, regionally extensive second-order folds associ- ated with the major faults are developed in the lower Paleo- zoic intervals (Kulander and Dean, 1986; Schultz, 1997) and extend upward into the overlying Devonian strata; the result- ing regional anticlines and synclines are manifest in the Devo- nian strata. A common structural style displayed in outcrops, primarily in the Marcellus Shale, is one of disharmonic folding within the surface and near-surface structures, which pro- duces relatively small folds and local thrust faults. Examples of these smaller, third-order folds are illustrated in Jacobeen and Kanes (1974), Nickelsen (1986), Pohn and Purdy (1988), and Schultz (1997). The variety of vergence directions of the third-order folds suggests that a throughgoing, upper-level décollement zone is not present within the Needmore and Marcellus Shales of the Broadtop synclinorium (Schultz, 1997). Pohn and Purdy (1988) suggested that disharmonic folding and “disturbed” zones are common in incompetent for- mations, such as the Marcellus Shale, whereas the same stress resulted in wedge faults in competent formations, such as the Oriskany Sandstone. The study area is located in a structurally complex region near documented lineaments, cross-strike structural discontinuities (CSD) and the ASF. Lineaments are surface features defined by discontinuities or linear features that may be related to subsurface phenomenon (O’Leary and others, 1976) and have an orientation oblique to surrounding features. CSDs are structural features aligned at a high angle to regional strike-parallel patterns, but are defined by surface and sub- surface geologic phenomenon (Wheeler, 1980) and thus are better defined and mapped than lineaments. In the study area, the strike of at least three structural features (including the Petersburg CSD) is approximately N. 85° E., the strike of about six structural features is approximately N. 80° W., and the strike of at least eight structural features (including the Parsons CSD) is about N. 50° W. (Wheeler, 1980; Wilson, 1980). The strike of the ASF in Highland County, Virginia, is approximately N. 35° E., which is parallel to the strike of the regional anticlines, synclines, and thrust faults (Rader and Wilkes, 2001). Southworth (1986) concluded that lat- eral ramps coincided with 32 percent of the lineaments and 70 percent of the cross-strike structural discontinuities that have been studied, suggesting that the lineaments and CSDs may be surface expressions of lateral ramps in the allochtho- nous cover rocks of the Appalachians. Wilson (1980) noted that splay faults within the Parsons CSD cut the Silurian to Devonian structural lithic unit, transferring the slip along the faults into the Middle Devonian shale, which caused thicken- ing in that sequence. In units where the slip along the fault had been transferred from one detachment horizon to another, such as in the Middle Devonian shale, the unit showed thicken- ing in the hinges of folds and thinning on the limbs of folds (Wilson, 1980). Wilson (1980) also reported that the rocks within the Parsons CSD were more intensely folded with a related increase in joint intensity compared to rocks outside the CSD. Detailed mapping by previous workers also noted a transfer of slip in the Silurian to Devonian sequence along the Petersburg CSD (Wilson, 1980). Multiple joint sets generated by multiple episodes and directions of stress were described by Dean and others (1983) and Evans (1994) from surface and subsurface data. Cross- strike structural discontinuities were described from surface mapping (Wheeler and others, 1979; Wheeler, 1983) and have been interpreted to extend up to 4 kilometers (km) into the subsurface (Wheeler, 1980; Wilson and Shumaker, 1992). The wells in this study were spaced far enough apart that the features described in these reports may affect the results of this analysis. Exploration and Production History in the Study Area Petroleum exploration in the 1950s and 1960s led to the discovery of several gas fields within the study area (Energy Information Administration (EIA), 2010). In southern Penn- sylvania, natural gas was discovered in the Devonian Oriskany Sandstone in the Purcell, Five Forks, and Artemas fields in 1957, 1962, and 1963, respectively. They were abandoned in 1974, 1972, and 1972, respectively, after cumulative produc- tion of almost 21 billion cubic feet of (BCF) of gas from the Oriskany Sandstone (Harper and Patchen, 1996). In Hampshire and Hardy Counties in eastern West Virginia, there is a northeast-southwest-trending line of gas fields that also produced from the Oriskany Sandstone. They include the Creekvale (Gore), Little Cacapon, Augusta, Inkerman, and Lost River fields. The Creekvale (Gore) discovery consisted of two successful wells that were completed, but for which there are no cumulative production data available (Cardwell, 1982).
  • 15. Procedures  9 The Little Cacapon field, discovered in 1965, produced about 1 BCF of gas. In 1971, the field was converted to a gas storage facility (Cardwell, 1982). The Augusta field produced 1 BCF of gas from 1953 to 1971 before it, too, was converted to a gas storage facility (Cardwell, 1982). The Inkerman (Whip Cove West) field produced 4.8 BCF of gas from 1966 to 1973 and the Lost River (Whip Cove East) field produced 9.1 BCF of gas from 1962 to 1973 (Cardwell and Avary, 1982). In western Virginia, the Bergton field was discovered in 1935 and lies at the southwestern end of this series of gas fields in the Oriskany Sandstone. Several drilling campaigns took place between 1935 and 1980, when a pipeline was built to a nearby interstate pipeline system to establish commercial production. The last reported production from Rockingham County, where the Bergton field is located, was in 1986. During two periods of production, the field produced slightly over 200 million cubic feet (MMCF) of gas (Milici, 1990). In Pocahontas County, West Virginia, the Thornwood field was discovered in 1961, and development drilling con- tinued until 1964, but the amount of gas produced from the Oriskany Sandstone during that time is not available (Cardwell and Avary, 1982). In 1996, Cabot Oil recompleted several wells and produced 3.28 BCF of gas through 2010, the last date for which production data are available (WVGES, 2010). Finally, one of the wells used in this study (PD–0010, table 1) appears to be the southernmost productive gas well in the Jordan Run field in Grant County, West Virginia. Over 41 MMCF of gas has been produced from this well from the Oriskany Sandstone since the PD–0010 well was drilled in 1983. This well has been operated by Chesapeake Energy since 2005. Procedures The wells in this study were chosen in an area approxi- mately 50 mi wide by 50 mi long where published digital geologic maps were available. Nine wells were identified that penetrated as deep as the Oriskany Sandstone and have wireline gamma-ray and bulk-density logs through the Upper to Lower Devonian interval (table 1, plate 1). The regulatory number listed in the first column in table 1 was used as the identifier for each well in the text, figures, and plates of this report. On the basis of the compilation of geologic map- ping completed in the study area (Dicken and others, 2005; Nicholson and others, 2005), wells PD–0010, PD–0011, HI–0004, and HI–0003 are located on the western side of the ASF and wells HI–0001, RO–0018, RO–0024, RO–0021, and HD–0015 are located on the eastern side of the ASF. This positional relation led to the assumption that the strata in the wells west of the ASF are likely to be less deformed and have greater petrophysical consistency than the wells east of the ASF. In order to test this assumption, the petrophysical proper- ties measured on the wireline logs were analyzed for evidence of variability that might indicate the presence of third-order folds. Digital images of wireline logs were downloaded from the West Virginia Geological and Economic Survey (2010) and Virginia Division of Gas and Oil (2010) Web sites. The logs were digitized to create log ASCII1 standard (LAS) files that contain gamma-ray and bulk-density curves. Most of the wells had bulk-density curves available, but two logs which had only formation density and density porosity available were converted to bulk-density so that the same log suite and scales could be used for all wells. The LAS files were used as input to the Correlator program. Drilling reports submitted by the well operators were obtained for the nine wells; these reports included the depths of the tops of formations. Descriptions of drill cuttings were available for four of the nine wells in the study. Using these data as the starting point, IHS Kingdom™ software was used to facilitate the correlation of the wireline logs. The wireline logs provided gamma-ray (GR) measurements in American Petroleum Institute (API) units, which indicate relative radio- activity. Bulk-density measurements were provided in grams per cubic centimeter (g/cc; also denoted as RHOB (rho B) in oil and gas industry wireline logs, and in the figures and plates in this report). The term “excursion” is used here to indicate the movement of either the gamma-ray or bulk-density curve to the right or left relative to an axis on the log. The depths to the tops of the Millboro Shale, Needmore Shale, and Oriskany Sandstone in the wireline log for the Fulk No. 1 well (RO–0024; fig. 6) were selected on the basis of traditional pattern recognition. The top of the Oriskany Sandstone was chosen at an excursion of the gamma-ray curve to the left with increasing depth (indicating 50 API units or less) and an excursion of the bulk-density curve to the right with increasing depth (indicating values of 2.65 g/cc or higher below the top). These measurements indicated the presence of a clean sandstone with little to no clay content. The top of the Needmore Shale was chosen at the lowest excursion of the gamma-ray curve to the right with decreasing depth (indicat- ing values greater than 160 API units above this depth) and an excursion of the bulk-density curve to the left with decreas- ing depth (indicating values less than 2.60 g/cc). The top of the Millboro Shale was chosen at the second excursion of the gamma-ray curve to the left, at the top of the second radioac- tive interval above the Oriskany Sandstone and Needmore Shale (indicating values decreasing to 160 API units or less), and an excursion of the bulk-density curve to the right with decreasing depth (indicating values increasing to 2.60 g/cc or greater above this depth). The tops of the selected formations were entered into the Correlator program on the basis of the above criteria to initiate correlations of the digital wireline logs. In Correlator, two log curves per well were used to compare the amount of shale in a specified interval, and the variability of a second petrophysical property (such as bulk density) was analyzed. The compari- sons were done simultaneously using both logs. In this study, 1 American Standard Code for Information Interchange
  • 16. 10   Characterization of the Marcellus Shale Based on Compter-Assisted Correlation of Wireline Logs in Virginia and West Virginia 3,2003,3003,4003,5003,6003,7003,8003,900 Base of Brallier Formation and top of Millboro Shale Top of Needmore Shale Top of Oriskany Sandstone Measured depth, in feet Gamma ray (GR) Bulk density (RHOB) 0 200 2.50 2.90 4,000 Figure 6.  Digital wireline log curves for the Fulk No. 1 well (RO–0024) illustrating the initial interpretation for locating the tops of the Millboro Shale, Needmore Shale, and Oriskany Sandstone using the criteria described in the text. Gamma-ray (GR) intensity measurements, which indicate relative radioactivity, are in American Petroleum Institute (API) units; bulk-density (ρB, or RHOB) measurements are in grams per cubic centimeter (g/cc). The GR curve wraps on the log scale when API units exceed 200.
  • 17. Procedures  11 a correlation interval of 15 ft was chosen for the calculations (although the program allows for any interval length to be chosen). The program was implemented in such a way that attention was fixed at a given interval in the well to the left and comparisons were made with multiple possible intervals in the second well on the right. Initially, a few correlations at the maximum variability intervals were obtained using a search interval of 400 ft. These first correlations were used to guide the final correlation within a search interval of only 20 ft. There was a sequential progression of correlations performed between the top of the Millboro Shale and the top of the Oris- kany Sandstone between pairs of wells until logs of all nine wells were correlated. In map view, a line connecting the nine wells in this study formed a closed polygon (fig. 7). The cross sections shown in plates 1 through 4 display the nine wells in the sequence in which they were correlated. PD–0011 HI–0001 HI–0003 RO–0018 RO–0024 RO–0021 HD–0015 Alleghenystructuralfront ROCKINGHAM SHENANDOAH PAGE HARDY GRANT TUCKER AUGUSTA HIGHLAND POCAHONTAS RANDOLPH BARBOUR PENDLETON Harrisonburg WESTVIRGINIA VIRGINIA BATH HI–0004 0 20 KILOMETERS5 10 15 0 5 10 15 20 MILES PD–0010 EXPLANATION Fault Marcellus Shale or Millboro Shale with Needmore Shale or Huntersville Chert, undivided (Middle Devonian) Well and number Well and number with dipmeter data available— See figure 8, parts A and B, and text for detailed information Line of section used for correlation HI–0001 HI–0004 38°20' 39°00' 38°40' 79°40' 79°20' 78°40'79°00' Base from ESRI digital data, 2007, 1:500,000 Geographic projection North American Datum of 1983 Figure 7.  Map of study area showing the outcrop area of the Middle Devonian Marcellus Shale or Millboro Shale with Needmore Shale or Huntersville Chert (undivided), regional faults, and the locations of the nine wells used in this study (including the well with the dipmeter; see figure 8) and the cross sections (see plates 1 through 4). Geology modified from 1:500,000-scale mapping by Dicken and others (2005) and Nicholson and others (2005).
  • 18. 12   Characterization of the Marcellus Shale Based on Compter-Assisted Correlation of Wireline Logs in Virginia and West Virginia For the Correlator calculations, depth is denoted in terms of the sequential number of the log readings in the matching well to the right. For example, if the reading for the reference well starts at 850 ft and the sampling interval is 0.5 ft, then the sequential number 1 represents a depth of 850 ft, 2 represents 850.5 ft, and so on; thus, even deeper, the sequential number for 900 ft would be 101. Tracking the depth measurements in the matching log is done relative to the starting point of the reference log. In general, depth d spacing i= + ⋅ −0 1( ) (1) where depth is the depth below a reference datum, such as sea level or the kelly bushing; d0 is the depth of the uppermost wireline log reading; spacing is the digitization interval; and i is the sequential number of log reading The calculations performed by the Correlator program were as follows (see Olea, 2002b, 2004, for more details): α λ λ λ λ λ λ 1 3 1 1 1 1 3 1 1 2 1 , min , ;i k n n j jshale shale shal ( ) = − ⋅ + ( )− − − ( )− ee shalej n i n 3 3 31 λ λmin −= − + ∑ (2) where α is the coefficient that measures the similarity in shale content;α varies from 0 to 1, with 1 being the best or an exactly equal amount of shale in the reference and matching wells; 1 used as a subscript, refers to the reference shale log; 3 used as a subscript, refers to the matching shale log; i is the depth at the center of the correlation interval in the reference well; j is the depth at the center of the correlation interval in the matching well; k is the difference between the reference and matching well (i minus j); for example, if i=50 and j=150, then k=100. n is the number of depth measurements to each side of the correlation interval’s center; λ is a wireline log reading; shale is the reading of the shale log; and min is the minimum value. r i k n i k n s i n s i k n 2 4 2 4 2 4 , , , ; cov , ; ; , ; ( ) = ( ) ( )⋅ ( ) (3) where r is the correlation coefficient between the other correlation log curves; 2 used as a subscript, refers to the reference log; 4 used as a subscript, refers to the matching log; i is the depth at the center of the correlation interval in the reference well; k is the offset for the difference between the reference and matching well; see equation 2) above; n is the number of depth measurements to each side of the correlation interval’s center; cov is the covariance between depths in the reference and matching wells; and s is the standard deviation. The correlation wireline logs are bulk-density logs in this study. The correlation coefficient, r, measures the similarity in signature; that is, the ability of one log curve to follow the other log curve. This comparison is scale independent, varies from −1 to 1, and is calculated by the following: w i k n i k n r i k n1 2 3 4 1 3 2 4, , , , ,, ; , ; , ;( ) = ( )⋅ ( )α (4) where w is the product of α and r, providing a weighted correlation that simultaneously measures the similarity in signature and shale content. Varies from −1 to 1. Only positive and high correlations are used; 1 refers to the reference shale wireline log; 2 refers to the reference correlation wireline log; 3 refers to the matching shale wireline log; 4 refers to the matching correlation wireline log; i is the depth at the center of the correlation interval in the reference well; k is the offset for the difference between the reference and matching well; see equation (2) above; n is the number of depth measurements to each side of the correlation interval’s center. The Correlator program used the change in absolute measurements on the gamma-ray and bulk-density digital log curves to calculate the weighted correlation coefficient, w, between two wells. This process is similar to the way geolo- gists visually correlate wireline logs as they use changes in
  • 19. Results and Analyses   13 measurements with depth to recognize patterns. The program used the selected correlation interval and search window parameters to determine the best matching correlation, which was defined by the weighted correlation coefficient in equa- tion 4 (plate 2). Only intervals with a weighted correlation coefficient of 0.60 or higher between two wells were dis- played and used in further calculations. In the case of the nine study wells, most intervals displayed a correlation strength of 0.60 to 0.68 (blue). No intervals displayed a correlation strength greater than 0.92 (red). The color bar in plate 2 indicates the correlation strength. With the exception of the USGS-standardized index map and explanation, each cross section on plates 1 through 4 is the graphical output from the Correlator program. Results and Analyses The Correlator program calculated the degree of similar- ity between two logs using specified search parameters. The similarities are discussed below as are some suggested pos- sible reasons for them. The cross section illustrated in plates 2 through 4 used the top of the Millboro Shale as the datum so that the varia- tion in the thickness of the Millboro Shale would be readily apparent. Another practical consideration was the use of a vertical exaggeration. One vertical scale and another hori- zontal scale were systematically used in all displays. The log curves of well HI–0003 were chosen arbitrarily to initiate the use of the Correlator program for extending correlations of the tops of the three formations to the other eight wells in the sequential correlation process described above. Because of this choice and the standard operating procedure of the Correlator program, well HI–0003 is displayed at both ends of plates 1 through 4. Because well HI–0003 was compared to a different well at the left side (well HI–0001) of each plate versus the right side (well HI–0004), the results were slightly different and therefore the display looks slightly different at each end of each cross section. During the iterative correlation process, the Millboro Shale was divided into three intervals based on the gamma-ray and bulk-density measurements. The entire Needmore Shale was represented by one undivided interval. From the top of the Millboro Shale to its bottom, the intervals were designated as Millboro Shale interval 1, 2, or 3. These three intervals were identified by color, as shown on plate 3, if the values exceeded the correlation strength of 0.60. Millboro Shale intervals 1 and 3 yielded the highest gamma-ray mea- surements and probably represent the most organic-rich zones of the Millboro Shale. These two intervals were separated by interval 2, which had lower gamma-ray and higher bulk- density measurements, perhaps representing the calcareous shale and calcareous concretion horizons studied in outcrop. In the final iteration in the nine wells, Millboro Shale interval 1 ranged from 58 to 165 ft thick, Millboro Shale interval 2 ranged from 120 to 329 ft thick, and Millboro Shale interval 3 ranged from 53 to 177 ft thick. The Needmore Shale ranged from 96 to 182 ft thick in the same wells (table 2). On the basis of the program calculations, intervals that yielded correlation strengths of 60 percent or higher in all nine wells were isolated (plate 4). Four intervals persisted in all nine wells, each with a thickness ranging from 2 to 16 ft. These intervals, which exhibited regional continuity, were located near the tops of Millboro Shale interval 2, Millboro Shale interval 3, and the Needmore Shale. A fourth zone that exhibited regional continuity was located within Millboro Shale interval 2. The measured percentage of each correlated interval that yielded a correlation strength equal to or greater than 60 percent was recorded for each well pair. For each interval, the mean of the percentage was calculated (table 3). The high- est mean percentage (71.2 percent) was found in the Need- more Shale, which indicates that this formation had the most consistent wireline-log character in the study area. Within the Millboro Shale, interval 2 yielded a mean percentage of 66.9 percent, which was the highest of all correlated intervals, and therefore indicated that its wireline-log character was the most regionally consistent in the Millboro Shale on the basis of gamma-ray and bulk-density logs. Millboro Shale interval 1 yielded the lowest mean percentage (51.8 percent), which indi- cated that the wireline-log character of this interval was the least consistent of the four intervals studied. As noted above, the top portion of Millboro Shale interval 1 was not among the four regionally persistent zones in the wells studied. Mean gamma-ray values (in API units) were calculated for each of the four intervals, and a mean for each interval was calculated for all wells (table 4). Millboro Shale interval 3 yielded the highest mean gamma-ray value for all of the wells (213.0 API units), which was the highest in six of the nine wells. The Needmore Shale and Millboro Shale interval 2 yielded the lowest mean gamma-ray values for all of the wells (147.6 and 127.7 API units, respectively). Mean bulk-density (RHOB) values (in g/cc) were calculated for each of the four intervals, and a mean for each interval was calculated for all wells (table 5). The Needmore Shale and Millboro Shale interval 2 yielded the highest mean values (2.72 and 2.69 g/cc, respectively). The gamma-ray and bulk-density values for these two intervals likely reflect their lithologies, suggesting that they contain less clay and perhaps more calcium carbonate or silica. Millboro Shale interval 1 yielded the lowest mean RHOB value for all of the wells (2.62 g/cc) and yielded the second highest mean gamma-ray value (191.8 API units). The low mean bulk-density values may indicate a lack of limestone or thin siltstone beds in this interval, and the high mean gamma-ray values may indicate high organic matter content. These properties may have facilitated plastic deformation as a result of stress on this interval. This interval may be the best candidate to exhibit short-wavelength folds and closely spaced thrust faults that may not be observed in more competent formations above and below.
  • 20. 14   Characterization of the Marcellus Shale Based on Compter-Assisted Correlation of Wireline Logs in Virginia and West Virginia Table 3.  Percentage of the interval where correlation strength between well pairs exceeded 60 percent. Stratigraphic interval Percentage of interval where correlation strength between well pairs exceeded 60 percent Mean (percent)HI–0003: HI–0001 HI–0001: RO–0018 RO–0018: RO–0024 RO–0024: RO–0021 RO–0021: HD–0015 HD–0015: PD–0010 PD–0010: PD–0011 PD–0011: HI–0004 HI–0004: HI–0003 Millboro Shale interval 1 84.8 31.9 46 55.5 47.2 47.5 14.6 82.9 55.8 51.8 Millboro Shale interval 2 74.9 79.6 79.9 86.3 63.7 34.6 56.7 56.2 69.9 66.9 Millboro Shale interval 3 81.3 51.4 55.5 62.6 60.9 0 53.7 63.5 65.2 54.9 Needmore Shale 87.2 77.5 29.9 54.5 72.5 82.7 67.7 98.4 70.4 71.2 Table 4.  Mean gamma-ray values, calculated for each interval. [API, American Petroleum Institute] Stratigraphic interval Mean gamma-ray intensity (API units) for each interval Mean (API units)HI–0003 HI–0001 RO–0018 RO–0024 RO–0021 HD–0015 PD–0010 PD–0011 HI–0004 Millboro Shale interval 1 151.8 259.3 184.3 234.3 204.1 120.9 201.6 184.7 185.0 191.8 Millboro Shale interval 2 127.1 106.6 99.8 126.3 138.6 96.2 123.1 180.6 151.2 127.7 Millboro Shale interval 3 198.9 230.3 162.9 193.0 268.4 146.2 263.7 244.3 209.6 213.0 Needmore Shale 126.9 159.1 115.7 175.0 186.2 107.1 153.4 154.9 149.9 147.6 Table 5.  Mean bulk-density values calculated for each interval. [g/cc, grams per cubic centimeter] Stratigraphic interval Mean bulk density (g/cc) calculated for each interval Mean (g/cc)HI–0003 HI–0001 RO–0018 RO–0024 RO–0021 HD–0015 PD–0010 PD–0011 HI–0004 Millboro Shale interval 1 2.61 2.55 2.52 2.67 2.71 2.61 2.66 2.61 2.61 2.62 Millboro Shale interval 2 2.72 2.63 2.58 2.70 2.72 2.85 2.68 2.66 2.70 2.69 Millboro Shale interval 3 2.62 2.57 2.58 2.66 2.63 2.81 2.58 2.56 2.63 2.63 Needmore Shale 2.68 2.71 2.68 2.72 2.72 2.88 2.71 2.64 2.71 2.72
  • 21. Results and Analyses   15 Millboro Shale interval 3 yielded the second lowest mean percentage of correlated intervals for all of the wells (54.9 percent) and the second lowest mean bulk-density value for all of the wells (2.63 g/cc). The low mean bulk-density values may indicate a lack of limestone or thin siltstone beds in this interval, and the high mean gamma-ray values may indicate high organic matter content. As with Millboro Shale interval 1, these properties may have facilitated plastic defor- mation as a result of stress on this interval. On the basis of the data on mean gamma-ray and bulk- density values, there seems to be an association between low percentages of correlated intervals and ductile lithologies. Millboro Shale intervals 1 and 3 yielded the lowest mean percentage of correlated interval, may contain the most clay- or organic-rich material, and therefore may have been most affected by third-order folding and (or) faulting. Well HI–0004 is located west of the ASF and was the only well of the nine studied with a dipmeter log available (fig. 8A,B). The log takes the form of a “tadpole” plot where solid tadpoles indicate sufficient correlation of the acquired resistivity data to determine an attitude of the beds, and hol- low tadpoles indicate minimal correlation of the acquired resistivity data. Between 6,125 and 6,210 ft measured depth (MD) in this well, in an interval above the Millboro Shale described as dark-gray, platy, slightly calcareous shale on the mud log, the tadpole plot indicated 2° to 5° of dip to the north, northwest, east, and southeast; this interval is marked as ‘a’ in figure 8A. Within Millboro Shale interval 1, from 6,260 to 6,300 ft MD, the dip was about 2° to the east and southeast (b in figure 8A). From 6,300 to 6,344 ft MD, still within Millboro Shale interval 1, most of the tadpoles were hollow (c in figure 8A). and the dip magnitude varied from 2° to greater than 60° to the west, northeast, and southeast. Within Millboro Shale interval 2, from 6,354 to 6,452 ft MD, the dips ranged from 2° to 22° to the southeast, southwest, northwest, and west (d in figure 8A). Between 6,456 ft and 6,580 ft MD, the solid tadpoles indicated dips from 5° to 50° to the southwest, southeast, east, northeast, and northwest (e in figure 8A,B). Rarely were there two solid tadpoles within a 4-ft interval indicating the same magnitude or direction of dip. Lastly, within Millboro Shale interval 3, the dip directions and magnitudes were extremely variable between 6,590 and 6,682 ft MD, with the few solid tadpoles indicating dips to the east and southeast with magnitudes between 16° and 54° and hollow tadpoles indicating dips up to 75° to the south- west, west, northwest, northeast, and east (f in figure 8B). Near the base of Millboro Shale interval 3, between 6,684 and 6,700 ft MD, the dip varied between 10° and 22° to the southeast (g in figure 8B). Within the Needmore Shale, from 6,700 to 6,812 ft MD, the concentration of solid tadpoles was high and the dips varied from 8° to 28°, mostly to the south- east (h in figure 8B). The consistent dip direction exhibited on the dipmeter in well HI–0004 within the Needmore Shale and in portions of Millboro Shale interval 2 seems to indicate that these intervals were more competent and less likely to exhibit plastic deformation as a result of tectonic stress compared to Millboro Shale intervals 1 and 3. The variable dip magnitude and direction throughout the Millboro Shale intervals 1 and 3 may be explained by intraformational folding, shearing, and (or) faulting. Millboro Shale interval 1 yielded only a 14.6 percent cor- relation value between wells PD–0010 and PD–0011 (table 3). Well PD–0010 contained the thinnest Millboro Shale interval 3 and thinnest total Millboro Shale, whereas well PD–0011 contained the thickest Millboro Shale interval 2 and thick- est total Millboro Shale (table 2). Conversely, well PD–0010 contained the thickest Needmore Shale of the nine wells (table 2). Wells PD–0010 and PD–0011 were among the most closely spaced pairs, but well PD–0010 is located between the traces of the Mathias lineament (Pohn, 2000) and the Parsons lineament (Southworth, 1986). According to Pohn (2000), the identifying characteristics of the Mathias lineament (a lateral ramp) include an abrupt change in fold wavelengths, a change in fault frequency at the surface, and an abrupt change in facies thickness. Among other characteristics, the high frequency of “disturbed” zones north of the Mathias linea- ment and documented by field investigations (Pohn, 2000) may explain why well PD–0010 yielded some of the lowest correlation interval values between it and adjacent wells for all three Millboro Shale intervals. A correlation of 34.6 percent of the interval between wireline logs of wells PD–0010 and HD–0015 was the low- est of all well pairs in Millboro Shale interval 2 and was 0 in Millboro Shale interval 3 (table 3, plates 2, 3). These wells are on opposite sides of the ASF and are on opposite sides of the Mathias lineament; well HD–0015 lies near the interpreted position of the Petersburg lineament (Southworth, 1986), and well PD–0010 is located near the trace of the Mathias linea- ment as well as the ASF. The lineaments and lateral ramps described by Pohn (2000) are the result of contractional tectonic stress; therefore, it is likely that these major structural features caused discontinuities within the relatively incompe- tent Millboro Shale. The correlation of over 80 percent between wells HI–0003 and HI–0001 was among the highest for Millboro Shale intervals 1 and 3 and for the Needmore Shale; in Mill- boro Shale interval 2, the correlation between the same wells was 74.9 percent (table 3). The Correlator program determined similar weighted correlation coefficients (w), which indicated a similarity in shale content and bulk-density signature in the specified search windows between the well pairs. Because these wells are on opposite sides of the ASF and there is significant distance between them, the results were surprising. Therefore, regardless of the distance between wells HI–0003 and HI–0001 and their apparent relationship to the ASF, the petrophysical properties in the studied intervals in each well were determined to be similar.
  • 22. 16   Characterization of the Marcellus Shale Based on Compter-Assisted Correlation of Wireline Logs in Virginia and West Virginia Figure 8.  Wireline log showing gamma-ray and dipmeter measurements in well HI–0004, Highland County, Virginia. The “tadpoles” in the rightmost column point in the direction of dip, with north at the top of the log. Tadpoles are located on a scale of 0° to 90° to illustrate dip magnitude. A, from 6,100 to 6,490 feet. B, from 6,490 feet to 6,880 feet. Base of Brallier Formation and top of Millboro Shale interval 1 Top of Millboro Shale interval 2 Measured depth, in feet 6,100 0 200 0 90 6,2006,3006,4006,500 a b c c Gamma-ray intensity, in API units Dip angle, in degrees EXPLANATION “Tadpole” showing attitude of bedding where sufficient correlation of resistivity data exists, in degrees—Scale at top of column. North is top of page “Tadpole” showing attitude of bedding where insufficient correlation of resistivity data exists, in degrees—Scale at top of column. North is top of page Stratigraphic interval boundary—Between formations or between intervals within the Millboro Shale Area of interest detailed in text and identifier d e A
  • 23. Results and Analyses   17 Figure 8.  Wireline log showing gamma-ray and dipmeter measurements in well HI–0004, Highland County, Virginia. The “tadpoles” in the rightmost column point in the direction of dip, with north at the top of the log. Tadpoles are located on a scale of 0° to 90° to illustrate dip magnitude. A, from 6,100 to 6,490 feet. B, from 6,490 feet to 6,880 feet.­—Continued Top of Millboro Shale interval 3 Top of Needmore Shale Top of Oriskany Sandstone Measured depth, in feet g Gamma-ray intensity, in API units Dip angle, in degrees EXPLANATION “Tadpole” showing attitude of bedding where sufficient correlation of resistivity data exists, in degrees—Scale at top of column. North is top of page “Tadpole” showing attitude of bedding where insufficient correlation of resistivity data exists, in degrees—Scale at top of column. North is top of page Stratigraphic interval boundary—Between formations or between intervals within the Millboro Shale Area of interest detailed in text and identifier 6,5006,6006,7006,800 0 200 0 90 h g f e B
  • 24. 18   Characterization of the Marcellus Shale Based on Compter-Assisted Correlation of Wireline Logs in Virginia and West Virginia Conclusions A statistical correlation of strata in the Millboro Shale and Needmore Shale was achieved using the Correlator pro- gram, which suggests that it can be a useful correlation tool in regions of contractional deformation. The results of the objec- tive correlation performed by Correlator and illustrated by the “persistent correlations” shown on plate 4 are very similar to the correlations created by a visual inspection of the wireline logs before using the program. The results indicate that the petrophysical properties (primarily mineralogy and porosity) measured by gamma-ray and bulk-density (RHOB) logs are fairly consistent across the study area. Although the Millboro Shale generally exhibited con- sistent petrophysical properties, the results of performing a statistical correlation between wireline logs from these nine wells indicated that there are discontinuities within the Mill- boro Shale where there are significant thickness differences between wells. The measured difference in the correlation strength of Millboro Shale interval 2 between wells com- pared with that of Millboro Shale intervals 1 and 3 suggests that intervals 1 and 3 may contain more third-order folds and sheared or “disturbed” zones than interval 2. Millboro Shale intervals 1 and 3 likely contain mineralogy that make these zones more prone to layer-shortening cleavage duplexes and (or) disharmonic folding than Millboro Shale interval 2 and the Needmore Shale; however, the discontinuities, which were indicated by variations in the mathematical correlation strength, were not specific enough to locate these zones in the wells that contain third-order folds or duplexes. Acknowledgments Reviews by David Houseknecht and Robert Milici of the U.S. Geological Survey improved the manuscript. The well-location data and log raster files were acquired from the Virginia Division of Gas and Oil and the West Virginia Geological and Economic Survey. The authors thank Patrick Niemeyer, who digitized the log raster files and created the LAS files that were used in this study. References Cited Boyce, M.L., and Carr, T.R., 2009, Lithostratigraphy and petrophysics of the Devonian Marcellus interval in West Virginia and southwestern Pennsylvania, in Carr, Tim, D’Agostino, Tony, Ambrose, William, Pashin, Jack, and Rosen, N.C., eds., Unconventional energy resources; Making the unconventional conventional; Proceedings, 29th Annual Gulf Coast Section SEPM Foundation Bob F. Perkins Research Conference, Houston, Tex., December 6–8, 2009: Houston, Tex., Gulf Coast Section of Society for Sedimentary Geology (SEPM), p. 254−281. Cardwell, D.H., 1982, Oriskany and Huntersville gas fields of West Virginia (and deep well and structural geologic map): West Virginia Geological and Economic Survey Mineral Resources Series MRS–5A, 180 p., 2 pls., scale 1:250,000. Cardwell, D.H., and Avary, K.L., 1982, Oil and gas fields of West Virginia: West Virginia Geological and Economic Survey Mineral Resources Series MRS–7B, 171 p., 2 pls., scale 1:250,000. Coleman, J.L., Milici, R.C., Cook, T.A., Charpentier, R.R., Kirschbaum, Mark, Klett, T.R., Pollastro, R.M., and Schenk, C.J., 2011, Assessment of undiscovered oil and gas resources of the Devonian Marcellus Shale of the Appala- chian Basin Province, 2011: U.S. Geological Survey Fact Sheet 2011–3092, 2 p., http://pubs.usgs.gov/fs/2011/3092/. Dean, S.L., Baranoski, M., Bertoli, L., Kribbs, G., Stephens, T., Kulander, B., Lockman, D., and Mumpower, D., 1983, Regional fracture analysis in western Valley and Ridge and adjoining plateau, West Virginia and Maryland [abs.]: American Association of Petroleum Geologists Bulletin, v. 67, no. 3, p. 448, http://archives.datapages.com/data/ bulletns/1982-83/data/pg/0067/0003/0400/0448.htm. Dean, S.L., Kulander, B.R., and Lessing, P., 1985, Geol- ogy of the Capon Springs, Mountain Falls, Wardensville, Woodstock, and Yellow Spring quadrangles, Hampshire and Hardy Counties, West Virginia: West Virginia Geological and Economic Survey Map–WV26, 1 sheet, scale 1:24,000. de Witt, Wallace, Jr., Roen, J.B., and Wallace, L.G., 1993, Stratigraphy of Devonian black shales and associated rocks in the Appalachian Basin, in Roen, J.B., and Kepferle, R.C. eds., Petroleum geology of the Devonian and Mississip- pian black shale of eastern North America: U.S. Geological Survey Bulletin 1909, p. B1–B57, http://pubs.er.usgs.gov/ publication/b1909.
  • 25. References Cited  19 Dicken, C.L., Nicholson, S.W., Horton, J.D., Kinney, S.A., Gunther, Gregory, Foose, M.P., and Mueller, J.A.L., 2005, Preliminary integrated geologic map databases for the United States; Delaware, Maryland, New York, Pennsyl- vania, and Virginia: U.S. Geological Survey Open-File Report 2005–1325, 45 p., database, http://pubs.usgs.gov/ of/2005/1325/. Energy Information Agency, 2010, Shapefile for the Appala- chian Basin, in Natural gas; Maps; Exploration, resources, reserves, and production: Energy Information Agency Web page accessed March 29, 2013 at http://www.eia.doe.gov/ pub/oil_gas/natural_gas/analysis_publications/maps/ maps.htm. Enomoto, C.B., 2009, Hydrocarbon potential of the Devo- nian Millboro (Marcellus) Shale in the Valley and Ridge Province of Virginia [abs.], in Abstracts, AAPG Eastern Section Meeting, Evansville, Indiana, September 20–22, 2009: Tulsa, Okla., American Association of Petroleum Geologists, p. 36−37, http://www.searchanddiscovery.net/ abstracts/html/2009/eastern/abstracts/enomoto.htm. Erenpreiss, M.S., Wickstrom, L.H., Perry, C.J., Riley, R.A., Martin, D.R., and others, 2011, Organic thickness map of the “Marcellus” modified from Harper and Kostelnik (2011), Pennsylvania Geological Survey; Kristin Carter (2008), Pennsylvania MRCSP; James Leone, New York; and Eric Lewis (2011), West Virginia: Pennsylvania Depart- ment of Conservation and Natural Resources Web page accessed May 16, 2013, at http://www.dcnr.state.pa.us/cs/ groups/public/documents/document/dcnr_007597.pdf. Evans, M.A., 1994, Joints and décollement zones in Middle Devonian shales; Evidence for multiple deformation events in the central Appalachian Plateau: Geological Society of America Bulletin, v. 106, no. 4, p. 447–460, doi:10.1130/0016-7606(1994)106<0447:JADCZI> 2.3.CO;2. Flaherty, K.J., 1996, Play Dho; Fractured Middle Devonian Huntersville Chert and Lower Devonian Oriskany Sand- stone, in Roen, J.B., and Walker, B.J., eds., 1996, The atlas of major Appalachian gas plays: West Virginia Geological and Economic Survey Publication V–25, p. 103–108. Harper, J.A., and Patchen, D.G., 1996, Play Dos: Lower Devo- nian Oriskany sandstone structural play, in Roen, J.B., and B.J., Walker, eds., The atlas of major Appalachian gas plays: West Virginia Geological and Economic Survey Publication V–25, p. 109–117. Harris, L.D., and Milici, R.C., 1977, Characteristics of thin-skinned style of deformation in the southern Appala- chians, and potential hydrocarbon traps: U.S. Geological Survey Professional Paper 1018, 45 p. (Also available at http://pubs.er.usgs.gov/publication/pp1018.) Hasson, K.O., and Dennison, J.M., 1988, Devonian shale lithostratigraphy, central Appalachians, U.S.A., in McMil- lan, N.J., Embry, A.F., and Glass, D.J., eds., Devonian of the World: Proceedings of the Second International Symposium on the Devonian System, Calgary, Canada; v. II; Sedimenta- tion: Canadian Society of Petroleum Geologists Memoir 14, p. 157–177. Jacobeen, Frank, Jr., and Kanes, W.H., 1974, Structure of Broadtop synclinorium and its implications for Appalachian structural style: American Association of Petroleum Geolo- gists Bulletin, v. 58, no. 3, p. 362–375. (Also available at http://archives.datapages.com/data/bulletns/1974-76/data/ pg/0058/0003/0350/0362.htm.) Kulander, B.R., and Dean, S.L., 1986, Structure and tectonics of central and southern Appalachian Valley and Ridge and Plateau Provinces, West Virginia and Virginia: American Association of Petroleum Geologists Bulletin v. 70, no. 11, p. 1674–1684. (Also available at http://archives.datapages. com/data/bulletns/1986-87/data/pg/0070/0011/1650/ 1674.htm.) Milici, R.C., 1990, Oil and gas exploration and development in Virginia, 1979–1988: Virginia Minerals, v. 36, no. 1, p. 1–6. Milici, R.C. and Swezey, C.S., 2006, Assessment of Appala- chian Basin oil and gas resources; Devonian Shale–Middle and Upper Paleozoic Total Petroleum System: U.S. Geolog- ical Survey Open-File Report 2006–1237, 70 p., available only at http://pubs.usgs.gov/of/2006/1237/. Nicholson, S.W., Dicken, C.L., Horton, J.D., Labay, K.A., Foose, M.P., and Mueller, J.A.L., 2005, Preliminary inte- grated geologic map databases for the United States; Ken- tucky, Ohio, Tennessee, and West Virginia: U.S. Geological Survey Open-File Report 2005–1324, available only at http://pubs.usgs.gov/of/2005/1324/. Nickelsen, R.P., 1963, Fold patterns and continuous defor- mation mechanisms of the central Pennsylvania folded Appalachians, in Wagner, W.R., and Nickelsen, R.P., eds., Tectonics and Cambrian-Ordovician stratigraphy, central Appalachians of Pennsylvania, Guidebook, Pittsburgh Geo- logical Society and Appalachian Geological Society field trip, September 19–21, 1963: Pittsburgh, Pa., Pittsburgh Geological Society, p. 13–29. (Also available at http:// archives.datapages.com/data/appalachian/tectonics_camb_ ordostrat63/nickelsen.pdf.) Nickelsen, R.P., 1986, Cleavage duplexes in the Marcellus Shale of the Appalachian foreland: Journal of Structural Geology, v. 8, no. 3/4, p. 361–371, doi:10.1016/0191- 8141(86)90055-6.
  • 26. 20   Characterization of the Marcellus Shale Based on Compter-Assisted Correlation of Wireline Logs in Virginia and West Virginia Ohio Department of Natural Resources, 2010, Stratigraphic cross section trending northwest-southeast (along dip) illustrating the Devonian Shale interval in eastern Ohio and west-central West Virginia: Columbus, Ohio, Ohio Depart- ment of Natural Resources, Division of Geological Survey, Web page accessed March 29, 2013, at http://ohiodnr.com/ OhioGeologicalSurvey/tabid/23014/Default.aspx. Olea, R.A., 2002a, Correlator, an interactive computer program for high-resolution, lithostratigraphic, well-log correlation: Kansas Geological Survey Open-File Report 2002–51, http://www.kgs.ku.edu/Publications/OFR/2002/ OFR02_51/ManualOFR2002-51.pdf. Olea, R.A., 2002b, CORRELATOR cross section from Gove to Harper Counties, Kansas: Kansas Geological Survey Technical Series 16, 2 pls. Olea, R.A., 2004, Correlator 5.2—a program for interactive lithostratigraphic correlation of wireline logs: Comput- ers & Geosciences, v. 30, p. 561–567, doi:10.1016/j. cageo.2004.01.006. Olea, R.A., and Guy, W.J., 2000, Subsurface geology of the Schaben field, Ness County, Kansas: Kansas Geological Survey Open-File Report 2000−52, 10 p., http://www.kgs. ku.edu/PRS/publication/2000/ofr52/index.html. O’Leary, D.W., Friedman, J.D., and Pohn, H.A., 1976, Lineaments, linear, lineation; Some proposed new stan- dards for old terms: Geological Society of America Bulletin, v. 87, no. 10, p. 1463–1469, doi:10.1130/0016- 7606(1976)87<1463:LLLSPN>2.0.CO;2. Piotrowski, R.G., and Harper, J.A., 1979, Black shale and sandstone facies of the Devonian “Catskill” clastic wedge in the subsurface of western Pennsylvania: U.S. Department of Energy Morgantown Energy Technology Center, Eastern Gas Shales Project Series. 13, 40 p., 39 pls. (Also available at http://www.dcnr.state.pa.us/topogeo/econresource/oiland- gas/marcellus/marcellus_egsp/index.htm.) Piotrowski, R.G., and Krajewski, S.A., 1977a, Preliminary stratigraphic cross section (C4 -D4 ) showing radioactive black shale zones and sandstones in the middle and upper Devonian, western Pennsylvania: U.S. Department of Energy Morgantown Energy Technology Center, Eastern Gas Shales Project Series 5, 2 sheets. Piotrowski, R.G., and Krajewski, S.A., 1977b, Preliminary stratigraphic cross section (B1 -B4 ) showing radioactive black shale zones and sandstones in the middle and upper Devonian, western Pennsylvania: Department of Energy Morgantown Energy Technology Center Eastern Gas Shales Project Series 7, 2 sheets. Pohn, H.A., 2000, Lateral ramps in the folded Appalachians and in overthrust belts worldwide—A fundamental ele- ment of thrust-belt architecture: U.S. Geological Survey Bulletin 2163, 71 p. (Also available at http://pubs.er.usgs. gov/publication/b2163.) Pohn, H.A., and Purdy, T.L., 1988, Disturbed zones; Indica- tors of subsurface faults and possible hydrocarbon traps in the Valley and Ridge and Appalachian Plateau provinces of Pennsylvania, Maryland, Virginia, and West Virginia, chap. C of Schultz, A.P., ed., Evolution of sedimentary basins: U.S. Geological Survey Bulletin 1839–A–D, p. C1–C11. (Also available at http://pubs.er.usgs.gov/publication/ b1839AD.) Rader, E.K., and Evans, N.H., eds., 1993, Geologic map of Virginia; expanded explanation: Virginia Division of Min- eral Resources, 80 p. Rader, E.K., and Gathright, T.M., II, comps., 2001, Geo- logic map of the Front Royal 30 × 60 minute quadrangle: Portions of Clarke, Page, Rockingham, Shenandoah, and Warren Counties, Virginia: Virginia Division of Mineral Resources Publication 162, 1 sheet, scale 1:100,000. (Also available at http://www.dmme.virginia.gov/commercedocs/ PUB_162.pdf.) Rader, E.K., and Wilkes, G.P., comps., 2001, Geologic map of the Virginia portion of the Staunton 30 × 60 minute quad- rangle: Virginia Division of Mineral Resources Publication 163, 1 sheet, scale 1:100,000. (Also available at http://www. dmme.virginia.gov/commercedocs/PUB_163.pdf.) Rader, E.K., McDowell, R.C., Gathright, T.M., II, and Orndorff, R.C., 2001, Geologic map of the Virginia portion of the Winchester 30 × 60 minute quadrangle: Virginia Divi- sion of Mineral Resources Publication 161, 1 sheet, scale 1:100,000. (Also available at http://www.dmme.virginia.gov/ commercedocs/PUB_161.pdf.) Rich, J.L., 1934, Mechanics of low-angle overthrust faulting as illustrated by Cumberland thrust block, Virginia, Kentucky, and Tennessee: American Association of Petroleum Geolo- gists Bulletin, v. 18, no. 12, p. 1584–1596. (Also available at http://archives.datapages.com/data/bulletns/1931-37/data/ pg/0018/0012/1550/1584.htm.) Rodgers, John, 1949, Evolution of thought on structure of middle and southern Appalachians: American Association of Petroleum Geologists Bulletin v. 33, no. 10, p. 1643–1654. (Also available at http://archives.datapages.com/data/ bulletns/1949-52/data/pg/0033/0010/1600/1643.htm.) Rodgers, John, 1963, Mechanics of Appalachian foreland fold- ing in Pennsylvania and West Virginia: American Associa- tion of Petroleum Geologists Bulletin v. 47, no. 8, p. 1527– 1536. (Also available at http://archives.datapages.com/data/ bulletns/1961-64/data/pg/0047/0008/1500/1527.htm.)
  • 27. References Cited  21 Roen, J.B., 1984, Geology of the Devonian black shales of the Appalachian Basin: Organic Geochemistry v. 5, no. 4, p. 241–254, doi:10.1016/0146-6380(84)90011-1. Roen, J.B., and de Witt, Wallace, Jr., 1984, Stratigraphic framework of the Devonian black shales of the Appalachian basin: U.S. Geological Survey Open-File Report 84–111, 71 p. (Also available at http://pubs.er.usgs.gov/publication/ ofr84111.) Schultz, A.P., 1997, Geology of the Broadtop Synclinorium in the Winchester 30′ × 60′ quadrangle, West Virginia: U.S. Geological Survey Open-File Report 97–143, 42 p., 1 pl., scale 1:100,000. (Also available at http://pubs.er.usgs.gov/ usgspubs/ofr/ofr97143.) Schwietering, J.F., 1980, Preliminary cross section (C-C′) of middle and upper Devonian in West Virginia: Department of Energy Morgantown Energy Technology Center, Eastern Gas Shales Project (EGSP) Series 210, 2 sheets. Shumaker, R.C., 1980, Porous fracture facies in the Devonian shales of eastern Kentucky and West Virginia, in Wheeler, R.L., and Dean, C.S., eds., Proceedings, Western limits of detachment and related structures in the Appalachian fore- land; Southeastern Section Geological Society of America meeting, Chattanooga, Tenn., April 6, 1978: U.S. Depart- ment of Energy Report DOE/METC/SP-80/23, p. 124–132. (Also available at http://www.netl.doe.gov/kmd/cds/disk7/ disk1/EGS%5CProceedings,%20Western%20Limits%20 of%20Detachment%20&%20Related%20Structur.pdf.) Smith, G.J., Jacobi, R.D., Loewenstein, Stu, and Seever, J.L., 2009, The influence of basement structures on Devo- nian black shale thicknesses in the northern Appalachian foreland basin [abs.], in AAPG annual convention abstracts, Denver, Colo., June 7–9, 2009: Tulsa, Okla., American Association of Petroleum Geologists, 1 CD-ROM. (Also available at http://aapg09.mapyourshow.com/2_1/sessions/ session.cfm?ScheduledSessionID=1626.) Smith, L.B., and Leone, James, 2010, Integrated character- ization of Utica and Marcellus black shale gas plays, New York State, in AAPG annual convention abstracts, New Orleans, La., April 11–14, 2010: Tulsa, Okla., American Association of Petroleum Geologists, 36 p., 1 CD-ROM. (Also available at http://www.searchanddiscovery.com/ documents/2010/50289smith/ndx_smith.pdf.) Southworth, C.S., 1986, Side-looking airborne radar image map showing cross-strike structural discontinuities and lineaments of the central Appalachians: U.S. Geological Survey Miscellaneous Field Studies Map MF–1891, 14 p., 1 sheet. (Also available at http://pubs.er.usgs.gov/ publication/mf1891.) U.S. Geological Survey, 2011, Devonian Marcellus Shale assessment units: U.S. Geological Survey data- base accessed June 8, 2012, at http://energy.usgs.gov/ OilGas/AssessmentsData/NationalOilGasAssessment/ USBasinSummaries.aspx?theTab=dataTab&provcode=5067 Virginia Division of Gas and Oil, 2010, Division of Gas and Oil: Virginia Division of Oil and Gas Web page accessed June 11, 2013, at http://www.dmme.virginia.gov/DGO/ DgoLandingPage.shtml. Watney, W.L., Olea, R.A., and Davis, J.C., 1999, Regional stratigraphic analysis of a Pennsylvanian carbonate shelf and margin in Kansas, in Transactions, American Associa- tion of Petroleum Geologists Mid-Continent Section Meet- ing, Wichita, Kans., August 29–31, 1999: Lawrence, Kans., Kansas Geological Survey, p. 52–62, http://www.kgs.ku.edu/ Conferences/midcont99/watney1.html. West Virginia Geological and Economic Survey, 2010, Pipe- line Plus: West Virginia Geological and Economic Survey database accessed April 1, 2013 at http://www.wvgs.wvnet. edu/pipe2/OGWISHelp.aspx. Wheeler, R.L., 1980, Cross-strike structural discontinuities; Possible exploration tool for natural gas in Appalachian overthrust belt: American Association of Petroleum Geolo- gists Bulletin, v. 64, no. 12, p. 2166–2178. (Also available at http://archives.datapages.com/data/bulletns/1980-81/ data/pg/0064/0012/2150/2166.htm.) Wheeler, R.L., 1983, Stratigraphic evidence for Devonian tectonism on lineaments at Allegheny front, West Virginia— Supporting material: U.S. Geological Survey Open-File Report 83–243, 25 p. (Also available at http://pubs.er.usgs. gov/publication/ofr83243.) Wheeler, R.L., Winslow, Margaret, Horne, R.R., Dean, Stuart, Kulander, Byron Drahovzal, J.A., Gold, D.P., Gilbert, O.E., Jr., Werner, Eberhard, Sites, Roy, and Perry, W.J., Jr., 1979, Cross-strike structural discontinuities in thrust belts, mostly Appalachian: Southeastern Geology, v. 20, no. 3, p. 193–203. Wilson, T.H., 1980, Cross-strike structural discontinuities; Tear faults and transfer zones in the central Appalachians of West Virginia: Morgantown, W. Va., West Virginia University, Department of Geology and Geography, 147 p. [Prepared under contract to U.S. Department of Energy, Morgantown Energy Technology Center Report DE–AC21– 76ET12138.] Wilson, T.H., and Shumaker, R.C., 1992, Broad Top thrust sheet; An extensive blind thrust in the central Appala- chians: American Association of Petroleum Geologists Bulletin, v. 76, no. 9, p. 1310–1324. (Also available at http://techplace.datapages.com/data/bulletns/1992-93/ data/pg/0076/0009/0000/1310.htm.)
  • 28. Manuscript approved on July 1, 2013 For additional information regarding this publication, contact: Center Director, Eastern Energy Resources Science Center U.S. Geological Survey 12201 Sunrise Valley Drive 956 National Center Reston, VA 20192 (703) 648-6401 Or visit the Eastern Energy Resources Science Center Web site at: http://energy.usgs.gov/GeneralInfo/ ScienceCenters/Eastern.aspx Prepared by USGS Science Publishing Network staff: James E. Banton, layout Jeffrey Hartley, cartographer/illustrator Elizabeth D. Koozmin, editor
  • 29.