Projected Property Tax Payments from the Proposed Atlantic Coast Pipeline in NC, VA, WV
•
2 likes•475 views

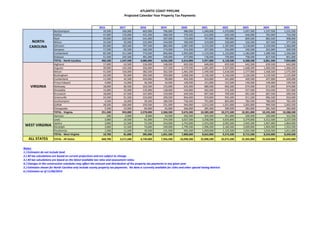
A spreadsheet showing estimated property taxes that will be paid by Dominion's Atlantic Coast Pipeline once it's up and running, by county for the three states where the pipeline will run. Once the pipeline is fully operational in 2020 it's projected to make annual property tax payments in excess of $25 million, countering the criticism that there is no long-term benefit to communities where interstate pipelines are run.
Recommended

Recommended
More Related Content
What's hot
Similar to Projected Property Tax Payments from the Proposed Atlantic Coast Pipeline in NC, VA, WV
Similar to Projected Property Tax Payments from the Proposed Atlantic Coast Pipeline in NC, VA, WV (20)
More from Marcellus Drilling News
More from Marcellus Drilling News (20)
Recently uploaded
Recently uploaded (20)
Projected Property Tax Payments from the Proposed Atlantic Coast Pipeline in NC, VA, WV
- 1. ATLANTIC COAST PIPELINE Projected Calendar Year Property Tax Payments 2016 2017 2018 2019 2020 2021 2022 2023 2024 2025 Northampton 39,500 166,000 665,000 796,000 980,000 1,040,000 1,070,000 1,097,500 1,197,500 1,231,500 Halifax 47,000 176,000 431,500 468,500 576,500 612,000 629,500 646,000 705,000 724,500 Nash 59,000 220,500 541,000 587,000 723,000 767,000 789,000 809,500 883,500 908,000 Wilson 24,500 92,000 225,000 244,000 300,500 319,000 328,000 336,500 367,500 377,500 Johnston 85,000 320,500 797,500 882,000 1,087,500 1,153,500 1,187,000 1,218,000 1,329,000 1,366,000 Sampson 17,500 65,500 160,500 174,000 214,500 227,500 234,000 240,500 262,000 269,500 Cumberland 82,500 311,500 774,500 856,000 1,055,000 1,119,500 1,152,000 1,182,000 1,289,500 1,326,000 Robeson 51,500 195,500 491,000 549,000 677,000 718,500 739,000 758,500 827,500 851,000 TOTAL ‐ North Carolina 406,500 1,547,500 4,086,000 4,556,500 5,614,000 5,957,000 6,128,500 6,288,500 6,861,500 7,054,000 Highland 17,000 63,500 156,000 148,000 603,500 648,000 659,500 642,500 639,500 642,000 Augusta 39,000 145,500 356,000 337,500 1,379,500 1,481,000 1,507,000 1,468,500 1,460,500 1,466,500 Nelson 41,500 156,000 382,500 362,500 1,481,500 1,590,500 1,618,500 1,577,000 1,568,500 1,575,000 Buckingham 24,500 95,000 294,500 259,000 1,058,500 1,136,500 1,156,500 1,126,500 1,120,500 1,125,000 Cumberland 11,500 42,500 104,000 99,000 403,500 433,000 441,000 429,500 427,000 429,000 Prince Edward 4,000 15,000 36,500 34,500 140,500 151,000 153,500 149,500 149,000 149,500 Nottoway 18,000 66,500 163,500 155,000 633,500 680,500 692,500 674,500 671,000 674,000 Dinwiddie 15,000 55,000 135,000 128,000 524,000 562,500 572,500 557,500 554,500 557,000 Brunswick 18,000 67,500 167,000 159,000 649,500 697,500 709,500 691,500 687,500 690,500 Greensville 24,500 91,500 224,000 209,500 856,000 919,000 935,500 911,500 906,500 910,000 Southampton 4,500 16,000 39,500 180,500 736,500 791,000 805,000 784,500 780,000 783,500 Suffolk 28,500 106,000 259,500 231,000 944,000 1,013,500 1,031,000 1,005,000 999,500 1,003,500 Chesapeake 5,500 23,000 60,000 65,000 266,000 285,500 290,500 283,000 281,500 283,000 TOTAL ‐ Virginia 251,500 943,000 2,378,000 2,368,500 9,676,500 10,389,500 10,572,500 10,301,000 10,245,500 10,288,500 Harrison 200 2,000 8,000 33,500 292,500 324,500 351,000 326,500 320,000 312,500 Lewis 3,000 24,500 91,000 374,500 3,027,500 3,358,500 3,635,000 3,379,000 3,312,500 3,237,500 Upshur 3,000 21,500 72,500 243,000 1,743,000 1,933,500 2,092,500 1,945,500 1,907,000 1,864,000 Randolph 3,000 21,500 74,000 249,000 1,799,500 1,996,500 2,160,500 2,009,000 1,969,000 1,924,500 Pocahontas 1,500 11,500 39,500 131,500 945,500 1,049,000 1,135,500 1,055,500 1,034,500 1,011,000 TOTAL ‐ West Virginia 10,700 81,000 285,000 1,031,500 7,808,000 8,662,000 9,374,500 8,715,500 8,543,000 8,349,500 NORTH CAROLINA VIRGINIA WEST VIRGINIA ALL STATES TOTAL ‐ All States 668,700 2,571,500 6,749,000 7,956,500 23,098,500 25,008,500 26,075,500 25,305,000 25,650,000 25,692,000 Notes: 1.) Estimates do not include land. 2.) All tax calculations are based on current projections and are subject to change. 3.) All tax calculations are based on the latest available tax rates and assessment ratios. 4.) Changes in the construction schedules may affect the amount and distribution of the property tax payments in any given year. 5.) Estimates shown for North Carolina only include county property tax payments. No data is currently available for cities and other special taxing districts 6.) Estimates as of 11/06/2014