More Related Content
Similar to RP Consumer Discretionary ex Autos performance 2015 (20)
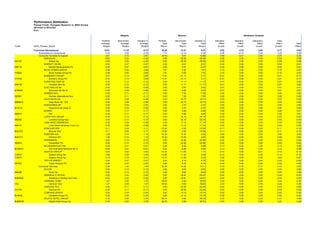
RP Consumer Discretionary ex Autos performance 2015
- 1. Performance Attribution
Pioneer Funds - European Research vs. MSCI Europe
20141231 to 20151231
Euro
Weights Returns Attribution Analysis
Portfolio Benchmark Variation in Portfolio Benchmark Variation in Allocation Selection Interaction Total
Average Average Average Total Total Total Effect Effect Effect Effect Total
Ticker GICS_Pioneer_Sector Weight Weight Weight Return Return Return (Local) (Local) (Local) (Local) Effect
Consumer Discretionary 10.61 11.35 -0.74 20.84 12.37 8.47 0.02 0.76 0.00 0.77 0.82
Automobiles & Components 3.03 3.38 -0.35 7.71 12.10 -4.38 0.06 -0.10 0.08 0.05 0.06
Consumer Durables & Apparel 2.81 2.74 0.07 22.50 9.61 12.89 0.00 0.27 0.00 0.27 0.28
ADIDAS AG 0.00 0.20 -0.20 0.00 58.38 -58.38 -0.09 0.00 0.00 -0.09 -0.08
403197 Adidas Ag 0.00 0.20 -0.20 0.00 58.38 -58.38 -0.09 0.00 0.00 -0.09 -0.08
BARRATT DEVEL 0.00 0.07 -0.07 0.00 6.47 -6.47 -0.02 0.00 0.00 -0.02 -0.01
008118 Barratt Developments Plc 0.00 0.07 -0.07 0.00 6.47 -6.47 -0.02 0.00 0.00 -0.02 -0.01
BOVIS HOMES GROUP 0.08 0.00 0.08 7.61 0.00 7.61 0.10 0.00 0.00 0.10 0.07
018592 Bovis Homes Group Plc 0.08 0.00 0.08 7.61 0.00 7.61 0.10 0.00 0.00 0.10 0.07
BURBERRY GROUP 0.72 0.13 0.59 -17.01 -21.17 4.17 -0.21 0.00 0.00 -0.21 -0.17
317430 Burberry Group Plc 0.72 0.13 0.59 -17.01 -21.17 4.17 -0.21 0.00 0.00 -0.21 -0.17
CHRISTIAN DIOR SE 0.00 0.12 -0.12 0.00 11.17 -11.17 -0.01 0.00 0.00 -0.01 0.00
406139 Christian Dior Se 0.00 0.12 -0.12 0.00 11.17 -11.17 -0.01 0.00 0.00 -0.01 0.00
ELECTROLUX AB 0.00 0.08 -0.08 0.00 -5.52 5.52 0.01 0.00 0.00 0.01 0.01
B1KKBX Electrolux Ab-Ser B 0.00 0.08 -0.08 0.00 -5.52 5.52 0.01 0.00 0.00 0.01 0.01
HERMES INTL 0.00 0.11 -0.11 0.00 7.50 -7.50 0.00 0.00 0.00 0.00 0.00
525397 Hermes International Sca 0.00 0.11 -0.11 0.00 7.50 -7.50 0.00 0.00 0.00 0.00 0.00
HUGO BOSS AG 0.00 0.08 -0.08 0.00 -22.73 22.73 0.03 0.00 0.00 0.03 0.03
B88MHC Hugo Boss Ag -Ord 0.00 0.08 -0.08 0.00 -22.73 22.73 0.03 0.00 0.00 0.03 0.03
HUSQVARNA AB 0.00 0.03 -0.03 0.00 2.37 -2.37 0.00 0.00 0.00 0.00 0.00
B12PJ2 Husqvarna Ab Class B 0.00 0.03 -0.03 0.00 2.37 -2.37 0.00 0.00 0.00 0.00 0.00
KERING 0.00 0.17 -0.17 0.00 0.66 -0.66 0.00 0.00 0.00 0.00 0.01
550507 Ppr 0.00 0.17 -0.17 0.00 0.66 -0.66 0.00 0.00 0.00 0.00 0.01
LUXOTTICA GROUP 0.00 0.13 -0.13 0.00 35.18 -35.18 -0.03 0.00 0.00 -0.03 -0.03
480065 Luxottica Group Spa 0.00 0.13 -0.13 0.00 35.18 -35.18 -0.03 0.00 0.00 -0.03 -0.03
LVMH MOET HENNESSY 0.00 0.58 -0.58 0.00 11.14 -11.14 -0.04 0.00 0.00 -0.04 -0.02
406141 Lvmh Moet Hennessy Louis Vui 0.00 0.58 -0.58 0.00 11.14 -11.14 -0.04 0.00 0.00 -0.04 -0.02
MONCLER SPA 0.11 0.00 0.11 -15.56 0.00 -15.56 -0.11 0.00 0.00 -0.11 -0.10
BGLP23 Moncler Ord 0.11 0.00 0.11 -15.56 0.00 -15.56 -0.11 0.00 0.00 -0.11 -0.10
PANDORA A/S 1.28 0.14 1.14 74.30 74.30 0.00 0.66 0.00 0.00 0.66 0.63
B44XTX Pandora A/S 1.28 0.14 1.14 74.30 74.30 0.00 0.66 0.00 0.00 0.66 0.63
PERSIMMON 0.00 0.10 -0.10 0.00 42.86 -42.86 -0.02 0.00 0.00 -0.02 -0.02
068253 Persimmon Plc 0.00 0.10 -0.10 0.00 42.86 -42.86 -0.02 0.00 0.00 -0.02 -0.02
RICHEMONT(CIE FIN) 0.00 0.51 -0.51 0.00 -8.99 8.99 0.13 0.00 0.00 0.13 0.09
BCRWZ1 Cie Financiere Richemon-Br A 0.00 0.51 -0.51 0.00 -8.99 8.99 0.13 0.00 0.00 0.13 0.09
SWATCH GROUP 0.63 0.20 0.43 -10.44 -11.60 1.17 -0.12 0.00 -0.01 -0.13 -0.12
718473 Swatch Group Sa 0.48 0.05 0.44 -10.95 -11.40 0.45 -0.14 0.00 0.00 -0.14 -0.12
718472 Swatch Group Ag 0.14 0.15 -0.01 -13.70 -11.66 -2.03 0.02 0.00 0.00 0.02 -0.01
TAYLOR WIMPEY 0.00 0.07 -0.07 0.00 8.16 -8.16 -0.02 0.00 0.00 -0.02 -0.02
087823 Taylor Wimpey Plc 0.00 0.07 -0.07 0.00 8.16 -8.16 -0.02 0.00 0.00 -0.02 -0.02
Consumer Services 2.98 1.44 1.54 32.45 14.34 18.11 0.10 0.16 0.17 0.43 0.53
ACCOR 0.00 0.12 -0.12 0.00 8.62 -8.62 0.00 0.00 0.00 0.00 0.00
585284 Accor Sa 0.00 0.12 -0.12 0.00 8.62 -8.62 0.00 0.00 0.00 0.00 0.00
AMADEUS IT HLDGS 0.00 0.22 -0.22 0.00 24.81 -24.81 -0.04 0.00 0.00 -0.04 -0.03
B3MSM2 Amadeus It Holding Sa-A Shs 0.00 0.22 -0.22 0.00 24.81 -24.81 -0.04 0.00 0.00 -0.04 -0.03
CARNIVAL CORP 1.27 0.00 1.27 36.63 0.00 36.63 0.23 0.00 0.00 0.23 0.34
CCL Carnival Corp 1.27 0.00 1.27 36.63 0.00 36.63 0.23 0.00 0.00 0.23 0.34
CARNIVAL PLC 0.00 0.11 -0.11 0.00 42.55 -42.55 -0.03 0.00 0.00 -0.03 -0.03
312152 Carnival Plc 0.00 0.11 -0.11 0.00 42.55 -42.55 -0.03 0.00 0.00 -0.03 -0.03
COMPASS GROUP 0.00 0.34 -0.34 0.00 15.15 -15.15 -0.02 0.00 0.00 -0.02 -0.02
BLNN3L Compass Group Plc 0.00 0.34 -0.34 0.00 15.15 -15.15 -0.02 0.00 0.00 -0.02 -0.02
DALATA HOTEL GROUP 0.76 0.00 0.76 86.74 0.00 86.74 0.47 0.00 0.00 0.47 0.45
BJMZDW Dalata Hotel Group Ltd 0.76 0.00 0.76 86.74 0.00 86.74 0.47 0.00 0.00 0.47 0.45
- 2. Performance Attribution
Pioneer Funds - European Research vs. MSCI Europe
20141231 to 20151231
Euro
Weights Returns Attribution Analysis
Portfolio Benchmark Variation in Portfolio Benchmark Variation in Allocation Selection Interaction Total
Average Average Average Total Total Total Effect Effect Effect Effect Total
Ticker GICS_Pioneer_Sector Weight Weight Weight Return Return Return (Local) (Local) (Local) (Local) Effect
EDENRED 0.67 0.06 0.62 -22.06 -22.06 0.00 -0.18 0.00 0.00 -0.18 -0.20
B62G1B Edenred 0.67 0.06 0.62 -22.06 -22.06 0.00 -0.18 0.00 0.00 -0.18 -0.20
INTERCONTL HOTELS 0.00 0.11 -0.11 0.00 10.04 -10.04 0.00 0.00 0.00 0.00 0.00
BN33FD Intercontinental Hotels Group Plc 0.00 0.11 -0.11 0.00 10.04 -10.04 0.00 0.00 0.00 0.00 0.00
MERLIN ENTERTAINME 0.25 0.05 0.20 22.82 22.12 0.71 0.00 0.00 0.00 0.00 0.02
BDZT6P Merlin Entertainment Group Plc 0.25 0.05 0.20 22.82 22.12 0.71 0.00 0.00 0.00 0.00 0.01
SODEXO 0.00 0.11 -0.11 0.00 12.48 -12.48 -0.01 0.00 0.00 -0.01 0.00
706271 Sodexo Sa 0.00 0.11 -0.11 0.00 12.48 -12.48 -0.01 0.00 0.00 -0.01 0.00
TUI AG 0.00 0.10 -0.10 0.00 21.07 -21.07 -0.01 0.00 0.00 -0.01 -0.01
B11LJN Tui Ag 0.00 0.10 -0.10 0.00 21.07 -21.07 -0.01 0.00 0.00 -0.01 -0.01
WHITBREAD 0.03 0.16 -0.14 8.48 -1.16 9.65 0.02 0.00 0.00 0.02 0.02
B1KJJ4 Whitbread Plc 0.03 0.16 -0.14 8.48 -1.16 9.65 0.02 0.00 0.00 0.02 0.01
WILLIAM HILL 0.00 0.06 -0.06 0.00 19.03 -19.03 0.00 0.00 0.00 0.00 0.00
316988 William Hill 0.00 0.06 -0.06 0.00 19.03 -19.03 0.00 0.00 0.00 0.00 0.00
Media 0.67 2.25 -1.58 43.83 14.66 29.17 -0.09 0.74 -0.50 0.15 0.10
ALTICE NV 0.00 0.01 -0.01 0.00 -53.79 53.79 0.02 0.00 0.00 0.02 0.02
BYT340 Altice Nv Class B 0.00 0.01 -0.01 0.00 -53.79 53.79 0.02 0.00 0.00 0.02 0.02
AXEL SPRINGER SE 0.00 0.03 -0.03 0.00 4.93 -4.93 0.00 0.00 0.00 0.00 0.00
464731 Axel Springer Se 0.00 0.03 -0.03 0.00 4.93 -4.93 0.00 0.00 0.00 0.00 0.00
ITV 0.00 0.18 -0.18 0.00 41.49 -41.49 -0.04 0.00 0.00 -0.04 -0.05
339864 Itv Plc 0.00 0.18 -0.18 0.00 41.49 -41.49 -0.04 0.00 0.00 -0.04 -0.05
JC DECAUX SA 0.00 0.03 -0.03 0.00 19.02 -19.02 -0.01 0.00 0.00 -0.01 0.00
713666 Jcdecaux Sa 0.00 0.03 -0.03 0.00 19.02 -19.02 -0.01 0.00 0.00 -0.01 0.00
LAGARDERE SCA 0.00 0.04 -0.04 0.00 31.64 -31.64 -0.01 0.00 0.00 -0.01 -0.01
454721 Lagardere S.C.A. 0.00 0.04 -0.04 0.00 31.64 -31.64 -0.01 0.00 0.00 -0.01 -0.01
PEARSON 0.00 0.18 -0.18 0.00 -32.29 32.29 0.07 0.00 0.00 0.07 0.06
067760 Pearson Plc 0.00 0.18 -0.18 0.00 -32.29 32.29 0.07 0.00 0.00 0.07 0.06
PROSIEBENSAT1 MED. 0.55 0.13 0.42 42.72 37.77 4.95 0.17 0.00 0.00 0.17 0.14
BCZM1B Prosieben Sat.1 Media N Ord 0.55 0.13 0.42 42.72 37.77 4.95 0.17 0.00 0.00 0.17 0.14
PUBLICIS GROUPE SA 0.00 0.17 -0.17 0.00 4.12 -4.12 0.00 0.00 0.00 0.00 0.01
438042 Publicis Groupe 0.00 0.17 -0.17 0.00 4.12 -4.12 0.00 0.00 0.00 0.00 0.01
RELX NV 0.00 0.20 -0.20 0.00 23.35 -23.35 -0.03 0.00 0.00 -0.03 -0.03
414881 Reed Elsevier Nv 0.00 0.20 -0.20 0.00 23.35 -23.35 -0.03 0.00 0.00 -0.03 -0.03
RELX PLC 0.00 0.23 -0.23 0.00 17.38 -17.38 -0.01 0.00 0.00 -0.01 -0.02
B2B0DG Reed Elsevier Plc 0.00 0.23 -0.23 0.00 17.38 -17.38 -0.01 0.00 0.00 -0.01 -0.02
RTL GROUP 0.00 0.04 -0.04 0.00 1.76 -1.76 0.00 0.00 0.00 0.00 0.00
B1BK20 Rtl Group S.A. 0.00 0.04 -0.04 0.00 1.76 -1.76 0.00 0.00 0.00 0.00 0.00
SCHIBSTED ASA 0.00 0.01 -0.01 0.00 -11.43 11.43 0.00 0.00 0.00 0.00 0.01
479053 Schibsted Asa 0.00 0.00 0.00 0.00 -11.68 11.68 0.00 0.00 0.00 0.00 0.00
BWVFKQ Schibsted Asa Class B 0.00 0.00 0.00 0.00 -11.21 11.21 0.00 0.00 0.00 0.00 0.00
SKY PLC 0.00 0.20 -0.20 0.00 34.31 -34.31 -0.04 0.00 0.00 -0.04 -0.04
014119 British Sky Broadcasting Gro 0.00 0.20 -0.20 0.00 34.31 -34.31 -0.04 0.00 0.00 -0.04 -0.04
VIVENDI SA 0.00 0.34 -0.34 0.00 1.83 -1.83 0.01 0.00 0.00 0.01 0.03
483477 Vivendi 0.00 0.34 -0.34 0.00 1.83 -1.83 0.01 0.00 0.00 0.01 0.03
WOLTERS KLUWER 0.00 0.12 -0.12 0.00 25.31 -25.31 -0.02 0.00 0.00 -0.02 -0.02
567151 Wolters Kluwer 0.00 0.12 -0.12 0.00 25.31 -25.31 -0.02 0.00 0.00 -0.02 -0.02
WPP PLC 0.12 0.35 -0.23 -1.32 25.92 -27.25 0.02 0.00 0.00 0.03 -0.01
B8KF9B Wpp Plc 0.12 0.35 -0.23 -1.32 25.92 -27.25 0.02 0.00 0.00 0.02 -0.02
Retailing 1.12 1.54 -0.41 0.32 12.13 -11.81 -0.02 -0.12 0.07 -0.07 -0.08
ASOS PLC 0.08 0.00 0.08 1.81 0.00 1.81 0.07 0.00 0.00 0.07 0.05
309272 Asos Plc 0.08 0.00 0.08 1.81 0.00 1.81 0.07 0.00 0.00 0.07 0.05
DIXONS CARPHONE 0.00 0.08 -0.08 0.00 16.82 -16.82 0.00 0.00 0.00 0.00 0.00
B4Y7R1 Dixons Carphone Plc 0.00 0.08 -0.08 0.00 16.82 -16.82 0.00 0.00 0.00 0.00 0.00
- 3. Performance Attribution
Pioneer Funds - European Research vs. MSCI Europe
20141231 to 20151231
Euro
Weights Returns Attribution Analysis
Portfolio Benchmark Variation in Portfolio Benchmark Variation in Allocation Selection Interaction Total
Average Average Average Total Total Total Effect Effect Effect Effect Total
Ticker GICS_Pioneer_Sector Weight Weight Weight Return Return Return (Local) (Local) (Local) (Local) Effect
DUFRY AG 0.00 0.03 -0.03 0.00 -19.67 19.67 0.01 0.00 0.00 0.01 0.01
B0R80X Dufry Ag 0.00 0.03 -0.03 0.00 -19.67 19.67 0.01 0.00 0.00 0.01 0.01
HENNES & MAURITZ 1.04 0.45 0.59 -2.06 -2.06 0.00 -0.07 0.00 0.00 -0.07 -0.06
568743 Hennes & Mauritz Ord 1.04 0.45 0.59 -2.06 -2.06 0.00 -0.07 0.00 0.00 -0.07 -0.06
INDITEX 0.00 0.43 -0.43 0.00 35.49 -35.49 -0.11 0.00 0.00 -0.11 -0.09
BP9DL9 Inditex 0.00 0.43 -0.43 0.00 35.49 -35.49 -0.11 0.00 0.00 -0.11 -0.09
KINGFISHER 0.00 0.15 -0.15 0.00 4.81 -4.81 0.01 0.00 0.00 0.01 0.01
331952 Kingfisher Plc 0.00 0.15 -0.15 0.00 4.81 -4.81 0.01 0.00 0.00 0.01 0.01
MARKS & SPENCER GP 0.00 0.16 -0.16 0.00 2.80 -2.80 0.01 0.00 0.00 0.01 0.01
312748 Marks & Spencer Group Plc 0.00 0.16 -0.16 0.00 2.80 -2.80 0.01 0.00 0.00 0.01 0.01
NEXT 0.00 0.20 -0.20 0.00 18.56 -18.56 -0.01 0.00 0.00 -0.01 -0.01
320898 Next Plc 0.00 0.20 -0.20 0.00 18.56 -18.56 -0.01 0.00 0.00 -0.01 -0.01
SPORTS DIRECT INTL 0.00 0.03 -0.03 0.00 -14.55 14.55 0.01 0.00 0.00 0.01 0.01
B1QH8P Sports Direct International (London List) 0.00 0.03 -0.03 0.00 -14.55 14.55 0.01 0.00 0.00 0.01 0.01
ZALANDO SE 0.00 0.00 0.00 0.00 13.40 -13.40 -0.01 0.00 0.00 -0.01 -0.01
BQV0SV Zalando Se 0.00 0.00 0.00 0.00 13.40 -13.40 -0.01 0.00 0.00 -0.01 -0.01
Consumer Staples 13.42 14.46 -1.03 16.85 19.81 -2.96 -0.04 -0.01 0.00 -0.05 -0.45
Energy 6.96 7.06 -0.10 -6.92 -8.43 1.51 0.02 0.09 0.00 0.10 0.12
Financials 21.46 22.79 -1.33 14.21 6.10 8.10 0.02 1.74 -0.09 1.66 1.66
Health Care 13.39 13.82 -0.44 16.38 15.03 1.35 -0.01 0.29 0.01 0.29 0.17
Industrials 10.64 11.26 -0.62 6.20 9.42 -3.22 0.02 -0.49 0.05 -0.42 -0.26
Information Technology 4.24 3.32 0.91 20.02 14.85 5.17 0.10 0.20 -0.07 0.23 0.19
Materials 7.08 6.66 0.42 -6.60 -11.64 5.04 -0.08 0.25 -0.01 0.16 0.27
Telecommunication Services 5.09 5.34 -0.25 20.37 11.13 9.24 0.02 0.49 -0.02 0.50 0.48
Utilities 3.08 3.93 -0.86 -3.36 0.12 -3.49 0.07 -0.03 0.02 0.06 0.01
[Cash] 0.12 0.00 0.12 -2,817.55 0.00 -2,817.55 -0.12 0.00 0.00 -0.12 0.62
[Unassigned] 3.91 0.01 3.91 9.13 -0.12 9.25 0.27 0.01 -0.14 0.14 0.05
Total 100.00 100.00 0.00 11.92 8.22 3.70 0.29 3.29 -0.25 3.32 3.70
Holdings Data As Of
Pioneer Funds - European Research 20141231 through 20151230
MSCI Europe 20150101 through 20151231