1. INVESTMENT MANAGEMENT CERTIFICATE PROGRAM May 1, 2015
Consumer Discretionary
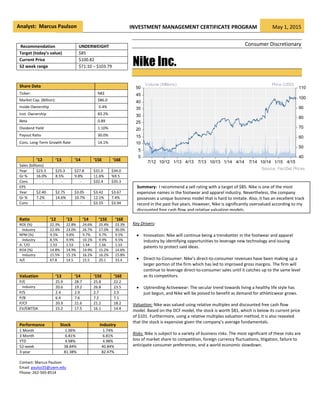
Nike Inc.
7/12 10/12 1/13 4/13 7/13 10/13 1/14 4/14 7/14 10/14 1/15 4/15
40
50
60
70
80
90
100
110
0
5
10
15
20
25
30
35
40
45
50
Source: FactSet Prices
Volume (Millions) Price (USD)
Key Drivers:
Innovation: Nike will continue being a trendsetter in the footwear and apparel
industry by identifying opportunities to leverage new technology and issuing
patents to protect said ideas.
Direct-to-Consumer: Nike’s direct-to-consumer revenues have been making up a
larger portion of the firm which has led to improved gross margins. The firm will
continue to leverage direct-to-consumer sales until it catches up to the same level
as its competitors.
Uptrending Activewear: The secular trend towards living a healthy life style has
just begun, and Nike will be poised to benefit as demand for athleticwear grows.
Valuation: Nike was valued using relative multiples and discounted free cash flow
model. Based on the DCF model, the stock is worth $81, which is below its current price
of $101. Furthermore, using a relative multiples valuation method, it is also revealed
that the stock is expensive given the company’s average fundamentals.
Risks: Nike is subject to a variety of business risks. The most significant of these risks are
loss of market share to competition, foreign currency fluctuations, litigation, failure to
anticipate consumer preferences, and a world economic slowdown.
Recommendation UNDERWEIGHT
Target (today’s value) $85
Current Price $100.82
52 week range $71.10 – $103.79
Share Data
Ticker: NKE
Market Cap. (Billion): $86.0
Inside Ownership 0.4%
Inst. Ownership 83.2%
Beta 0.89
Dividend Yield 1.10%
Payout Ratio 30.0%
Cons. Long-Term Growth Rate 14.1%
‘12 ‘13 ‘14 ‘15E ‘16E
Sales (billions)
Year $23.3 $25.3 $27.8 $31.0 $34.0
Gr % 16.0% 8.5% 9.8% 11.6% %9.5
Cons - - - $32.4 $35.3
EPS
Year $2.40 $2.75 $3.05 $3.42 $3.67
Gr % 7.2% 14.6% 10.7% 12.1% 7.4%
Cons - - - $3.55 $3.94
Ratio ‘12 ‘13 ‘14 ‘15E ‘16E
ROE (%) 22.3% 22.8% 24.6% 25.4% 23.3%
Industry 22.4% 23.0% 26.7% 27.0% 30.0%
NPM (%) 9.5% 9.8% 9.7% 9.7% 9.5%
Industry 8.5% 9.9% 10.1% 9.9% 9.5%
A. T/O 1.53 1.53 1.54 1.56 1.53
ROA (%) 14.8% 14.9% 14.9% 15.2% 14.6%
Industry 15.5% 15.1% 16.2% 16.2% 15.8%
A/E 67.8 14.5 15.5 20.1 33.4
Valuation ‘13 ‘14 ‘15E ‘16E
P/E 25.9 28.7 25.8 22.2
Industry 20.6 19.2 26.8 23.5
P/S 2.4 2.9 2.7 2.5
P/B 6.4 7.6 7.2 7.1
P/CF 20.9 21.6 21.2 18.2
EV/EBITDA 15.2 17.5 16.1 14.4
Performance Stock Industry
1 Month 1.06% 1.74%
3 Month 6.81% 6.81%
YTD 4.98% 4.98%
52-week 38.84% 40.84%
3-year 81.38% 82.47%
Contact: Marcus Paulson
Email: paulso35@uwm.edu
Phone: 262-565-8514
Analyst: Marcus Paulson
Summary: I recommend a sell rating with a target of $85. Nike is one of the most
expensive names in the footwear and apparel industry. Nevertheless, the company
possesses a unique business model that is hard to imitate. Also, it has an excellent track
record in the past five years. However, Nike is significantly overvalued according to my
discounted free cash flow and relative valuation models.
2. INVESTMENT MANAGEMENT CERTIFICATE PROGRAM May 1, 2015
2
Company Overview
From its humble beginnings in 1964, Nike Incorporated (NKE) has transformed into the world’s leading athletic
footwear, apparel, and equipment company. The firm is involved in the design, development, manufacturing,
and worldwide marketing in eight different sports categories: running, basketball, soccer, mens training,
womens training, sportswear, action sports, and golf. Nike also has two wholly-owned subsidiary brands.
Converse manufacturers classic athletic and casualwear, and Hurley is world-renowned for its surfwear. The
majority of Nike’s revenue comes from United States and Western Europe, yet the firm operates worldwide and
conducts business in nearly every country. Nike’s co-founder Phil Knight still oversees the board of directors at
the firm’s headquarters in Beaverton, Oregon.
Nike generates revenue through normal retail operations and using direct-to-consumer transactions. Revenue is
derived from five product segments including:
Footwear: Nike was the creator of the first modern athletic shoe, so it’s no surprise that the firm’s
footwear segment is the bread-and-butter of the brand as it makes up 70% of total revenues.
Although Nike’s footwear merchandise is predominantly designed for athletic use, large portions are
worn for casual purposes as well.
Apparel: Like its footwear segment, Nike has established itself among the leading players in the global
sports apparel market. It is the official outfitter for many collegiate and professional sports
teams/leagues.
Equipment: Sports equipment is a fragmented sector that contains a large variety of products. As with
Footwear and Apparel, Nike attempts to revolutionize athletic equipment and focus on technical
superiority.
Converse: Converse, the once the essential sports brand of the 1960’s, was purchased by Nike in
2003. The vintage-style leisure wear are reported separately from the Nike Brand.
Global Brands Divisions: Nike assigns its operations into six geographic segments: North America,
Western Europe, Central & Eastern Europe, Greater China, Japan, and Emerging Markets. The Global
Brands Division accounts for any business outside these segments. Typically this compromises of
brand licensing revenue, and demand creation and operating overhead expenses.
Figures 1 and 2: Revenue Sources of Nike for year end 2014 (left) and Revenue History since 2010 (right)
Footwear
70.6%
Apparel
20.6%
Equipment
4.2%
Converse
4.3%
Global
Brands
0.3%
0
5,000
10,000
15,000
20,000
25,000
30,000
35,000
2010 2011 2012 2013 2014 2015E 2016E
(inmillions)
Footwear Apparel Equipment Converse
Source: Company Report Source: Company Report
3. INVESTMENT MANAGEMENT CERTIFICATE PROGRAM May 1, 2015
3
2009 2010 2011 2012 2013 2014
125 211 277 337 579 466
Business Drivers
Though several factors may contribute to Nike’s future success; the following are the most
important business drivers:
1) Permanent Innovation
2) Direct to Consumer Development
3) Brand Strength
4) Uptrending Activewear
5) Opportunities in Undeveloped Markets
Permanent Innovation
In the athletic industry, technical innovation in the design and manufacturing process is essential to
commercial success. Not only do technological advancements allow firms to maintain prices, it also
keeps consumers loyal to a brand. Nike has always emphasized the importance of its research &
development department since its inception. The firm has its own sport research lab with scientists
to help design advanced products, while professional athletes engaged under sports market
contracts wear-test and evaluate said creations.
Quantifying Nike’s amount of innovation is challenging since it does not disclose R&D expenses. As
an alternative, it can be measured by analyzing the number of patents granted annually. A 2014
patent study by Macquarie showed that ROE of firms with large patent portfolios “improve(s)
substantially going forward despite short-term research spending impact.” Due to the recession, the
number of Nike’s patents granted fell in 2007 and 2008. Since then, NKE patent growth has
increased substantially, as shown in figure 3.
Figure 3: Amount of Nike Patents Granted Annually since 2009
Comparatively, the sheer number of patents Nike pumps out is astronomical. A MarketWatch study
that scoured the US Patent Office’s database from 1976-2014 showed that Nike was granted more
than 4,000 patents, which contrasted to 51 for Under Armor, 275 for Adidas, and 482 for Reebok.
These numbers represent how NKE has expressed the importance of creating and protecting
intellectual property since its inception. However, rivals are beginning to follow suit as technological
development is invading the sporting goods industry. The total number of patents granted per year
has increased continuously since 2005.
Source: United States Patent and Trademark Office
Digital
technology will
continue to drive
patent growth in
the sportswear
industry.
4. INVESTMENT MANAGEMENT CERTIFICATE PROGRAM May 1, 2015
4
Figure 4: Breakdown of Nike’s Granted Patents from 2006 & 2014 (right)
Using market research to respond to consumer
preferences, Nike identifies opportunities to
leverage new technologies in existing categories.
Figure 4 (right) compares 2006, Nike’s peak year of
granted patents prior to the recession, to 2013.
Note that the number of footwear related patents,
while still around the same number, shrunk from
76% to half of the company’s patent portfolio. As
NKE diversified its business beyond footwear to
golf products and fitness tracking devices, its
patents granted showcased the change as well. I
believe Nike’s ability to spark consumer interest
through product innovations should continue going
forward. This was stated in the firm’s last annual
report in which it expressed plenty of untapped
potential involving digital initiatives with products
that provide real-time personalized feedback.
Direct to Consumer Development
Nike’s Direct to Consumer (DTC) business consists of sales through company-owned retail stores and
internet websites. It allows the firm to bypass wholesalers and sell its products directly to end users
at a higher margin. Figure 5 shows how closely correlated Nike’s DTC revenues are with its gross
margins with an R-squared of 85%. Therefore, the firm’s focus on the DTC segment is a vital
component of its strategy to achieve long-term earnings growth targets.
Figure 5: Quarterly Direct-to-Consumer Revenues and Gross Margin since 2012
Revenue growth from Nike’s DTC business has been outpacing growth in the wholesale business.
Figure 6 shows that DTC revenues have more than doubled in the past five years, and have been
making up a larger portion of Nike’s total sales. However, as of now DTC is but a small portion of
Nike’s overall business with a revenue contribution of only 19% in 2014. When contrasted to
comparable firms in Figure 7, Nike has been lagging behind DTC and gross margins indicating there is
further room for improvement in the DTC business. I believe that DTC growth will continue to
Source: Macquarie
Source: Company Report
Direct to
Consumer growth
will accelerate
margin growth.
5. INVESTMENT MANAGEMENT CERTIFICATE PROGRAM May 1, 2015
5
outpace wholesale business and make up a larger portion of Nike’s overall sales, thus improving
profitability.
Figure 6 & 7: Annual DTC Revenue since 2010 (left) & Comparable Firm’s Annual DTC vs Gross Margin since 2010 (right)
Brand Strength
Through decades of sponsoring high-profile athletic celebrities, top sporting events, and professional
athletic leagues, the Nike swoosh has become one of the most recognizable logos in the world. Sales
have been driven by building a high perceived brand quality in the minds of consumers.
Nike refers to marketing expenses as “demand creation” which consists of advertising, promotional,
and endorsement contract expenses. Below, figure 8 shows how demand creation is closely linked to
total revenues with an R-squared of 78%.
Figure 8 & 9: Quarterly Demand Creation Expense since 2010 (left) & Demand Creation Expense as % of Revenues (right)
Even though the expense has been trending upward, Nike has been able to hold the line on demand
creation around 11% percent of revenue as shown in figure 9 (above). The problem is the
inconsistent nature of it all. When there’s a championship or major tournament, Nike tends to call
for a surge in marketing. On top of that, the firm tends to release products at said events to enhance
brand exposure, further increasing expenses. According to Nike reports, demand creation will likely
remain flat for the rest of 2015 due to no irregular sporting events. However, I expect that to change
in 2016 as the firm ramps up sponsorships for the Summer Olympics in Rio, thus drastically
increasing revenues.
0%
5%
10%
15%
20%
25%
0
1,000
2,000
3,000
4,000
5,000
6,000
2010 2011 2012 2013 2014
DTCRevenues(InMillions)
Nike DTC Revenues (left) % of DTC to Total Revenues (right)
0.0%
2.0%
4.0%
6.0%
8.0%
10.0%
12.0%
14.0%
16.0%
Q1
2010
Q3
2010
Q1
2011
Q3
2011
Q1
2012
Q3
2012
Q1
2013
Q3
2013
Q1
2014
Q3
2014
Q1
2015
Q3
2015
% of Demand Creation to Total Revenues Average
Source: Company Report Source: Company Reports
Source: Company Report Source: Company Report
6. INVESTMENT MANAGEMENT CERTIFICATE PROGRAM May 1, 2015
6
Uptrending Activewear
Retail has begun to target the activewear market as the concept of a healthy and active lifestyle has
gained significant traction among consumers. Statistics show that inactivity levels across the US have
been dropping (figure 10), especially among women (figure 11). This lifestyle movement presents an
opportunity to capitalize for the athleticwear industry as its customer base continues to increase.
Figure 10 & 11: Inactivity Levels of Total US Population (left) and US Females (right)
*Inactivity Levels determined by the 2008 Physical Activity Guidelines for Americans*
Additionally, activewear sales are picking up due to more and more consumers accepting sports-
inspired clothing as street wear. The mixing of fitness and casual wear has been universally
attributed to the push by many Americans toward a more active lifestyle. In a market where
performance once trumped all, fashion is beginning to emerge as a vital component to activewear.
The recent uptick in athletic-wear sales has brought forth a lot of competitive attention. Aside from
new players entering the market, some of the world’s largest fashion firms are also moving into
activewear. Top designers such as Calvin Klein, Stella McCartney, and Alexander Wang have rolled
out fitness clothing lines along with large nationwide retailers such as Gap, Victoria Secret and
Macy’s. Nike has tapped into the fashion aspect as well by teaming up with Givenchy’s Riccardo Tisci,
an Italian based luxury fashion designer.
Nike is poised to benefit from the snowballing activewear trend since it has a well-established
foothold in the athletic apparel & footwear market. Yet, it will also have to defend market share
from the onslaught of new players.
Geographic Expansion
Nike generates over 66% of its revenue from its developed geographies (North America and Western
Europe) as shown in Figure 12 (below). However, as those areas edge closer to saturation Nike has
expressed plans to aggressively pursue greener pastures in developing markets (Greater China,
Central & Eastern Europe, and Emerging Markets). The driving force behind that decision is due to
the growing middle class in those regions.
30%
40%
50%
60%
70%
80%
18-24 25-44 45-54 55-64 65-74 75+
2009 2010 2011 2012
30%
40%
50%
60%
70%
80%
18-44 45-54 55-64 65-74 75+
2009 2010 2011 2012
Source: Centers for Disease Control and Prevention Source: Centers for Disease Control and Prevention
The increase in
people exercising
greater for females
than males.
7. INVESTMENT MANAGEMENT CERTIFICATE PROGRAM May 1, 2015
7
Figure 12 & 13: Nike’s 2014 Sales by Geographic Region and Historical Revenue Breakdown by Region since 2010
Looking into the future, population will be the next big asset to drive growth. Transitioning from
lower to middle class brings about a rise in purchasing power and therefore a change in
consumption patterns. A report by Reuters, figure 14, shows that the middle class will expand
tremendously over the next fifteen years, and Nike is aiming to use that leverage to kindle growth.
Figure 14: Global Population by Income (in billions)
*Middle Class determined by annual per capita expenditure between $3,650 and $36,500 effective with 2005 CPI data*
The projected geographical shift in middle class consumption represented by figures 15 and 16
shows that the opportunity for growth is more abundant in the Asia Pacific. Nike has already
identified targeting Greater China and Emerging Markets. As long as it is set up to capture the
market share in the growing middle class, Nike has a great chance to capitalize.
North America
47%
Central &
Eastern Europe
5%
Emerging
Markets 15%
Greater China
10%
Japan 3%
Western
Europe 19%
Global Brand
Divisions 1%
Source: Reuters; Rohde and the US Census Bureau
Source: Company Reports Source: Company Reports
8. INVESTMENT MANAGEMENT CERTIFICATE PROGRAM May 1, 2015
8
Figure 15 & 16: Projected Middle Class Consumption for 2010 (left) and Projected 2020 (right)
Financial Analysis
I project 2015 segment sales to be exceptionally strong in the US, Western Europe, and China
whereas sales in undeveloped areas will lag due to the strengthening dollar. I don’t expect the trend
to last long however, as the divisions will revert back to the mean in 2016. Margins are anticipated
to increase as DTC business strengthens, and SG&A will become more costly as overhead rises.
Quantification of Drivers
I expect Nike’s EPS to rise from $3.05 to $3.42 in 2015. I believe that Nike will experience an increase
in sales through improving economic conditions and new innovative products. An estimated 11%
increase in revenues should boost the EPS in multiple categories: $0.26 in footwear, $0.08 in
apparel, and $0.04 in converse. Furthermore, increasing gross margins due to Nike improving its DTC
channel will grow EPS by an additional $0.10. Also, I estimate that the company’s SG&A will increase
by five basis points. I am attributing the increase in SG&A to the company’s higher operating
overhead expenses, reflecting the growth in DTC business and investments in infrastructure. As a
result, I believe that SG&A will grow 13.2% for 2015 which will adversely affect EPS by $0.12.
Figure 17: Quantification of 2015E EPS Drivers
North
America
Europe
Central and
South
America
Asia Pacific
Sub-Saharan
Africa
Middle East
and North
Africa
North
America
Europe
Central &
South
America
Asia Pacific
Sub-Saharan
Africa
Middle East
and North
Africa
$0.26 $0.08 ($0.00) $0.04 ($0.00) $0.10 $0.06
$3.42
($0.12)
$3.05
$0.00
$0.50
$1.00
$1.50
$2.00
$2.50
$3.00
$3.50
$4.00
Source: The World Bank; Kharas and Gertz, 2010. Source: The World Bank; Kharas and Gertz, 2010.
Source: Company Reports, IMCP
2015 EPS
grew 12.1%
to $3.42
9. INVESTMENT MANAGEMENT CERTIFICATE PROGRAM May 1, 2015
9
In 2016, I expect EPS to grow to $3.67 from $3.42 in 2015. I expect trends from the year before to
continue. Increased revenues will begin to slow and will only result in a total combined EPS impact of
$0.33. Meanwhile, an amplified DTC business will add another $0.10 while increased SG&A will
lower EPS by $0.12. Please note: I assumed a reasonable share buyback of $200 million.
Figure 18: Quantification of 2016E EPS Drivers
Comparison Estimates to Consensus
My revenue expectations are more conservative compared to the 29-analyst average on Factset, and
thus earnings estimates lag behind the consensus as well. However, my estimates on free cash flow
are more bullish than consensus.
Figure 19: Estimated Revenues, EPS, FCF versus Consensus
$0.19
$0.10 $0.01 $0.03 $0.00 $0.10 $0.01
$3.67
($0.15)
$3.42
$0.00
$0.50
$1.00
$1.50
$2.00
$2.50
$3.00
$3.50
$4.00
$4.50
2015 2016 2015 2016
Revenue 31,037$ 33,993$ 32,402$ 35,344$
EPS 3.42$ 3.67$ 3.55$ 3.94$
FCF 3,119$ 4,029$ 2,786$ 3,223$
Estimates Consensus
Source: Company Reports, IMCP
2016 EPS
grew 7.3% to
$3.67
Source: Factset, IMCP
10. INVESTMENT MANAGEMENT CERTIFICATE PROGRAM May 1, 2015
10
Revenues
Since 2010, Nike has experienced a steady growth in its total revenue. In the base case, I expect
operating revenues to grow 11.6% and 9.5% for 2015 and 2016, respectively. The increase of 2015
growth is sensible due to the world cup driving sales in the 1
st
quarter. In 2016, I believe sales
development will taper back to 2013-2014 levels. Eventually, I predict Nike operating revenue to
continue to grow at 8% after 2016.
Figure 20: Nike’s Revenue versus YoY Revenue Growth, 2010-2016E
Figure 21: 2010-2016E Operating Revenues and Estimates
I expect Nike revenues to increase with new sportswear demand due to new innovative products,
and an increased consumer base due to uptrending fitness trends in the US and an increasing middle
class internationally. The firm’s footwear segment has been its anchor over the past five years never
dropping below 5.8% YoY growth. I expect Nike’s footwear sales to continue increasing over the next
few years. With the ever-increasing demand in activewear, I believe Nike’s high growth divisions in
the future will be Converse and Apparel. In 2014, they grew 16% and 8% respectively. While sales of
apparel and shoes have hummed along, Nike’s smaller sports equipment segment hasn’t performed
well. Granted the division only makes up 5% of revenues, I believe equipment revenues will lag due
to increased competition.
0%
2%
4%
6%
8%
10%
12%
14%
16%
18%
0
5,000
10,000
15,000
20,000
25,000
30,000
35,000
40,000
2010 2011 2012 2013 2014 2015E 2016E
(InMIllios)
Nike Annual Revenues (left) YoY Revenue Growth (right)
Items 2010 2011 2012 2013 2014 2015E 2016E
Sales 17,340 19,188 23,224 25,215 27,671 30,958 33,887
Growth 10.7% 21.0% 8.6% 9.7% 11.9% 9.5%
Footwear 10,301 11,519 13,513 14,635 16,208 18,477 20,140
Apparel 5,026 5,516 6,958 7,491 8,109 8,798 9,678
Equipment 1,030 1,022 1,429 1,640 1,670 1,662 1,745
Converse 983 1,131 1,324 1,449 1,684 2,021 2,324
Global Brand Divisions 86 96 111 115 125 121 127
Corporate 1,588 833 (4) (17) 3 (42) (21)
Source: Company Reports, IMCP
Source: Company Reports, IMCP
11. INVESTMENT MANAGEMENT CERTIFICATE PROGRAM May 1, 2015
11
Operating Income and Margins
Figure 22 shows growth of operating margins for NKE from 2011 to 2016 estimates. Growth margins
have been increasing since 2012 due to DTC business lowering cost of goods sold. However, increase
costs to demand creation and SG&A have caused operating and net margins to remain steady over
the past few years. I project the YoY change in net margins will remain flat so long as the increase in
gross margin can offset the increase in operating expenses in 2015. I believe net margins in 2016 will
eventually decrease due to increased demand creation expenses for the summer Olympics in Rio.
Figure 22: Nike Operating Margins, 2010-2016E
-12%
-10%
-8%
-6%
-4%
-2%
0%
2%
4%
6%
8%
10%
2011 2012 2013 2014 2015E 2016E
Gross Margin Operating Margin Net Margin
Source: Company Reports, IMCP
An increase in DTC
sales has improved
gross margins while
negatively impacting
net margins
temporarily.
12. INVESTMENT MANAGEMENT CERTIFICATE PROGRAM May 1, 2015
12
Five Stage Du Pont ROE
Currently, Nike’s return on equity is at an all-time high. The improvement of the company’s ROE can
be attributed to a slight improvement in asset turnover and higher level of financial leverage. As I
mentioned earlier, the company issued $1 billion senior notes in April of 2013. The higher level of
leverage gave a huge boosts to the company’s ROE. In 2015, ROE may improve further as asset
turnovers, operating profit margin, and leverage all moderately rise. Figure 23 (below) illustrates
Nike’s calculation in detail.
Figure 23: DuPont ROE Calculation
The current footwear industry ROE is 22.4%, which is in line with its five-year average of 21.9%.
However, it should be noted that the industry ROE was above 26% at the end of 2014 and sharply
fell while Nike has continued trending up.
Free Cash Flow
Nike’s free cash flow for 2014 was $1,592 million which increased 8.2% from 2013. Although, in the
prior year Nike had a huge decrease in free cash flow of -29.1%. That is attributable to a large
increase in NWC and net fixed assets leading to a sharp increase in uses of cash. Going into the near
future, I expect Nike’s to have no problems growing FCFE. Without cash and debt, NKE would grow
FCFE 25.6% and 23.0% in 2015 and 2016. However, I anticipate the firm to use any extra cash to pay
down debt, increase its dividend, and continue to buy back shares. Even so, cash is projected to
increase $899 and $910 million in 2015 and 2016 respectively. Looking into the future, NKE’s NOPAT
will outpace NWC and NFA growth to allow free cash flow to increase to $1,849 in 2015 and $2,110
in 2016.
DuPont ROE Calculation
5-stage 2011 2012 2013 2014 2015E 2016E Average
EBIT/Sales 14.2% 12.9% 12.9% 12.9% 13.0% 12.7% 13.2%
Sales/Avg Assets 1.37 1.53 1.53 1.54 1.56 1.53 1.49
EBT/EBIT 99.9% 99.9% 100.1% 99.1% 99.2% 99.5% 99.7%
Net Income/EBT 75.9% 75.0% 75.3% 76.0% 75.6% 75.6% 75.5%
ROA 14.8% 14.8% 14.9% 14.9% 15.2% 14.6% 14.8%
Avg Assets/Avg Equity 1.50 1.51 1.54 1.65 1.67 1.60 1.55
ROE 22.2% 22.3% 22.8% 24.6% 25.4% 23.3% 23.0%
Source: Company Reports, IMCP
13. INVESTMENT MANAGEMENT CERTIFICATE PROGRAM May 1, 2015
13
Figure 24: FCF Analysis (2010 – 2016E)
Valuation
Nike was valued using multiples relative to its industry, and a 3-stage discounting cash flow model.
Based on both the relative valuation and DCF model, NKE is overvalued, which differs significantly
from market expectations. The current price is $100 and I value the stock to be worth $85.
Free Cash Flow Analysis 2011 2012 2013 2014 2015E 2016E
Without cash and debt
NOPAT $2,175 $2,260 $2,449 $2,718 $3,039 $3,252
Growth 13.8% 3.9% 8.4% 11.0% 11.8% 7.0%
NWC* 5,384 5,646 6,331 6,449 7,013 7,474
Net fixed assets 3,701 3,620 3,915 4,898 5,351 5,666
Total net operating capital* $9,085 $9,266 $10,246 $11,347 $12,364 $13,139
Growth 13.9% 2.0% 10.6% 10.7% 9.0% 6.3%
- Change in NWC* 868 262 685 118 564 461
- Change in NFA 241 (81) 295 983 453 314
FCFF* $1,066 $2,079 $1,469 $1,617 $2,022 $2,477
Growth 95.0% -29.4% 10.1% 25.0% 22.5%
- After-tax interest expense 3 3 (2) 25 23 18
FCFE** $1,063 $2,076 $1,471 $1,592 $1,999 $2,460
Growth 95.3% -29.1% 8.2% 25.6% 23.0%
+ Net new debt/other cap (170) (48) 982 (11) (150) (350)
Sources of cash $893 $2,028 $2,453 $1,581 $1,849 $2,110
Uses of cash
Other expense 39 46 (21) - - -
Increase cash and mkt sec (1,124) 362 1,020 (1,117) 899 910
Dividends 555 619 703 799 900 1,050
Share buyback (503) (697) (543) (681) 50 150
Change in other equity 1,992 1,751 1,612 2,832 - (0)
$959 $2,081 $2,771 $1,833 $1,849 $2,110
Change in other liab 66 53 318 252 - -
Total $893 $2,028 $2,453 $1,581 $1,849 $2,110
FCFF per share $1.12 $2.26 $1.64 $1.83 $2.29 $2.81
Growth 101.6% -27.6% 11.8% 25.1% 22.7%
FCFE per share $1.12 $2.26 $1.64 $1.80 $2.26 $2.79
Growth 101.9% -27.4% 9.9% 25.6% 23.2%
Per Share Basis
Free Cash Flow Analysis 2011 2012 2013 2014 2015E 2016E
With cash and debt
NOPAT $2,175 $2,260 $2,449 $2,718 $3,039 $3,252
Growth 13.8% 3.9% 8.4% 11.0% 11.8% 7.0%
NOWC 7,339 7,963 9,668 8,669 10,132 11,502
Net fixed assets 3,701 3,620 3,915 4,898 5,351 5,666
Total net operating capital $11,040 $11,583 $13,583 $13,567 $15,483 $17,168
Growth -0.1% 4.9% 17.3% -0.1% 14.1% 10.9%
- Change in NOWC (256) 624 1,705 (999) 1,463 1,370
- Change in NFA 241 (81) 295 983 453 314
FCFF $2,190 $1,717 $449 $2,734 $1,123 $1,568
Growth -21.6% -73.9% 509.3% -58.9% 39.6%
- After-tax interest expense 3 3 (2) 25 23 18
+ Net new debt (170) (48) 982 (11) (150) (350)
FCFE $2,017 $1,666 $1,433 $2,698 $950 $1,200
Growth -17.4% -14.0% 88.3% -64.8% 26.3%
Sources of cash (FCFE) $2,017 $1,666 $1,433 $2,698 $950 $1,200
Uses of cash
Other expense $39 $46 ($21) $0 $0 $0
Increase mkt sec - - - - - -
Dividends 555 619 703 799 900 1,050
Share buyback (503) (697) (543) (681) 50 150
Change in other equity 1,992 1,751 1,612 2,832 - (0)
$2,083 $1,719 $1,751 $2,950 $950 $1,200
Change in other liab 66 53 318 252 - -
Total $2,017 $1,666 $1,433 $2,698 $950 $1,200
FCFF per share $2.30 $1.87 $0.50 $3.09 $1.27 $1.78
Growth -18.9% -73.2% 518.9% -58.9% 39.8%
FCFE per share $2.12 $1.81 $1.60 $3.05 $1.08 $1.36
Growth -14.6% -11.8% 91.2% -64.8% 26.5%
Per Share Basis
Source: Company Reports, IMCP Source: Company Reports, IMCP
14. INVESTMENT MANAGEMENT CERTIFICATE PROGRAM May 1, 2015
14
Trading History
As figure 25 shows (below), Nike is trades at an average P/E (NTM) of 19.85. Recently NKE has been
following the consumer discretionary trend of being richlyvalued compared to its historical numbers.
NKE is currently trading at 25.87 P/E. Over the next 7 years, I would expect NKE’s P/E to normalize
back to 23x. I believe we are coming to a peak in another economic cycle, and that the majority of
securities in the market are overvalued at this moment in time.
Figure 25: P/E (NTM) trading history, 04/2010 - 04/2015
Assuming the firm maintains a 26 P/E at the end of 2015, it should trade at $88.92 by the end of the
year.
26 X 2016 EPS of $3.42 = $88.92
Discounting $88.92 back to today at a 9.60% cost of equity yields a price of $86.49.
Figure 26: Nike’s current and five year averages for P/E, P/S, and P/B
Figure 26 exhibits the fact that all of NKE multiples are trading higher than its 5 year averages.
Relative Valuation
Figure 27 (below) shows Nike vs its peers on a number of financial and valuation metrics. As
mentioned earlier, although the industry is fragmented, it is hard to find a direct comparable to NKE
because of its diversification in brands. Compared to its peers, Nike trades at a price to earnings
multiple slightly above the average (NTM P/E of 26.7 vs 23.5). This reflects expectations of high
growth (14.1 LTG vs 10.3 for the industry) as the company penetrates more markets and increases
its top line revenue by double digits.
0
5
10
15
20
25
30
Apr-10 Nov-10 Jun-11 Jan-12 Aug-12 Mar-13 Oct-13 May-14 Dec-14
Historical P/E-NTW Average P/E-NTW
Current
Five Year Average
Price/Earnings Price/Sales Price/Book
25.87
19.85
1.81
1.16 2.15
2.71
Source: FactSet
Source: Factset
NKE P/E has
historically traded
for a premium
relative to its
comparable
15. INVESTMENT MANAGEMENT CERTIFICATE PROGRAM May 1, 2015
15
Figure 27: Comps Sheet
P/B vs ROE
Figure 28 (below) shows the relationship between P/B and ROE of the stocks in the footwear and
apparel industry. There is a strong relationship between price-to-book and return on equity, as
shown by the calculated R-squared that indicates 79% of the change in P/B can be explained through
NTM ROE. In comparison to its peers, Nike has the second highest P/B and the highest ROE, so it
appears to be fairly valued versus the broad spectrum of peers. Assuming the relationship holds
going forward, the fair value for NKE is $81.76 at the end of the year or about $79.54 now.
Estimated P/B = 2015 ROE (24.7%)* 24.031 – 0.3405 = 5.60
Target Price = Estimated P/B * 2015 BVPS ($14.60) = $81.76/share.
Figure 28 & 29: P/B vs ROE (left) and P/S vs Net Profit Margin (right) for footwear and apparel industry
Comp Sheet (5/1/2015)
Current Market Price Change Earnings Growth LT Debt/ S&P LTM Dividend
Ticker Name Price Value 1 day 1 Mo 3 Mo 6 Mo 52 Wk YTD LTG NTM 2014 2015E 2016E Pst 5yr Beta Equity Rating Yield Payout
NKE NIKE INC $100.95 $86,792 (0.2) 0.3 5.0 11.1 37.6 5.0 14.1 8.4% 19.5% 11.0% 16.2% 17.6% 0.53 8.7% A+ 1.04% 29.7%
ADS-DE ADIDAS AG $80.85 $16,520 1.6 4.6 22.9 28.9 (3.0) 29.1 4.8 17.4% -33.0% 14.6% 15.4% 13.5% 1.29 28.3% 2.04% 63.8%
SKX SKECHERS U S A INC $89.66 $4,664 3.2 23.3 56.2 77.9 124.5 62.3 33.2% 151.9% 50.0% 25.0% 18.6% 1.28 1.2% B 0.00% 0.0%
SHOO MADDEN STEVEN LTD $41.52 $2,641 8.3 9.4 23.5 38.7 18.1 30.4 13.4% -10.7% 9.1% 20.3% 16.8% 0.72 0.0% B 0.00% 0.0%
COLM COLUMBIA SPORTSWEAR CO $62.84 $4,423 1.2 5.1 47.8 74.8 55.0 41.1 10.4 13.4% 39.7% 15.8% 13.2% 14.5% 1.51 0.0% B+ 0.72% 22.7%
HBI HANESBRANDS INC $32.22 $12,914 (6.8) (5.6) 12.6 17.7 70.9 15.5 11.0 67.5% 43.9% 16.3% 14.0% 49.0% 1.08 140.7% 0.97% 31.9%
LULU LULULEMON ATHLETICA INC $66.94 $9,503 0.7 5.8 1.1 61.7 42.1 20.0 15.0 16.3% -1.0% 2.1% 20.2% 32.3% 1.03 3.2% B+ 0.00% 0.0%
DECK DECKERS OUTDOOR CORP $75.06 $2,595 (0.7) 2.2 (4.2) (8.0) (4.4) (17.6) 12.3 10.0% 11.5% 13.8% 17.4% 1.03 3.2% B+ 0.00% 0.0%
VFC VF CORP $73.70 $31,358 (0.3) (2.2) 3.6 10.8 22.6 (1.6) 10.8 35.0% 12.8% 4.2% 15.3% 18.3% 1.06 25.3% A 1.55% 48.9%
WWW WOLVERINE WORLD WIDE $34.33 $3,539 3.1 7.0 21.9 29.6 27.7 16.5 19.6% 13.3% -3.7% 12.8% 16.0% 0.95 91.5% A- 0.72% 18.5%
7936-JP ASICS CORP $25.97 $4,929 (0.3) (6.2) 8.8 28.3 53.9 6.7 3.9 21.0% 1.0% 26.3% 4.8% 0.65 0.72% 27.7%
Average 0.9 4.0 18.1 33.8 40.4 18.9 10.3 24.9% 24.3% 12.0% 17.5% 19.9% 1.01 30.2% 0.70% 22.1%
Median 0.7 4.6 12.6 28.9 37.6 16.5 10.9 17.4% 13.3% 11.0% 15.4% 17.4% 1.03 6.0% 0.72% 22.7%
SPX S&P 500 INDEX $2,118 0.2 1.3 3.2 7.8 12.7 2.9 8.7% 3.2% 7.6%
2014 P/E 2014 2014 EV/ P/CF P/CF Sales Growth Book
Ticker Website ROE P/B 2013 2014 2015E TTM NTM 2016E NPM P/S OM ROIC EBIT Current 5-yr NTM STM Pst 5yr Equity
NKE http://www.nike.com 24.7% 7.02 34.0 28.4 25.6 28.9 26.7 22.0 10.0% 2.85 13.6% 22.1% 22.7 4.2% 9.5% 7.8% $14.38
ADS-DE http://www.adidas-group.com 12.5% 2.74 14.7 21.9 19.1 25.9 22.1 16.6 4.3% 0.94 5.7% 8.3% 14.4 16.4 14.1 -11.5% 4.7% 7.0% $29.56
SKX http://www.skechers.com 12.8% 4.23 83.0 33.0 22.0 27.9 21.0 17.6 6.0% 1.96 9.3% 13.0% 13.5 17.7% 10.6% $21.18
SHOO http://www.stevemadden.com 16.7% 3.95 21.1 23.6 21.6 23.6 20.8 18.0 8.4% 1.98 11.5% 16.6% 12.4 17.8 13.1 10.0% 21.5% $10.52
COLM http://www.columbia.com 9.9% 3.27 46.2 33.1 28.6 32.4 28.6 25.2 6.4% 2.11 9.2% 10.5% 14.2 22.7 14.7 8.6% 8.3% 11.0% $19.24
HBI http://www.hanesbrands.com 40.8% 9.31 32.9 22.9 19.6 31.6 18.9 17.2 10.6% 2.43 13.5% 14.2% 17.1 23.7 12.7 10.1% 2.6% 6.5% $3.46
LULU http://www.lululemon.com 24.6% 8.72 35.0 35.4 34.7 40.3 34.7 28.9 14.9% 5.29 20.6% 21.9% 24.1 12.0% 14.1% 31.7% $7.68
DECK http://www.deckers.com 15.4% 2.51 18.0 16.3 14.6 18.4 15.2 12.9 8.8% 1.44 17.4% 13.2 13.4 12.2 17.7% $29.89
VFC http://www.vfc.com 23.7% 5.67 27.0 23.9 23.0 31.0 22.9 19.9 10.7% 2.55 15.1% 14.4% 17.7 18.7 15.0 3.1% 7.9% 11.2% $13.01
WWW http://www.wolverineworldwide.com 17.7% 3.75 24.0 21.2 22.0 26.4 22.1 19.5 6.0% 1.28 9.8% 7.0% 13.2 15.1 13.7 3.4% 5.2% 20.2% $9.17
7936-JP http://www.asics.co.jp 14.1% 3.73 32.1 26.5 26.2 36.4 25.2 20.8 5.9% 1.57 7.2% 8.6% 15.1 36.6 14.4 6.4% $6.96
Average 19.3% 4.99 33.4 26.0 23.4 29.4 23.5 19.9 8.4% 2.22 11.5% 14.0% 16.1 20.5 13.7 6.4% 7.5% 13.8%
Median 16.7% 3.95 32.1 23.9 22.0 28.9 22.1 19.5 8.4% 1.98 10.7% 14.2% 14.4 18.2 13.9 8.6% 7.9% 11.0%
spx S&P 500 INDEX 19.5 17.9 17.3 16.1
Nike
y = 24.031x + 0.3405
R² = 0.7869
0
2
4
6
8
10
12
0% 10% 20% 30% 40% 50%
P/B
ROE
P/B vs ROE
Nike
y = 33.833x - 0.6132
R² = 0.79
0.0
1.0
2.0
3.0
4.0
5.0
6.0
0.0% 5.0% 10.0% 15.0% 20.0%
P/S
NPM
P/S vs NPM
Source: Factset
Source: Factset Source: Factset
16. INVESTMENT MANAGEMENT CERTIFICATE PROGRAM May 1, 2015
16
P/S vs NPM
Figure 29 (above) shows the relationship between P/S and NPM of the stocks in the footwear and
apparel industry. There is a strong relationship between price-to-sales and net profit margin, as
shown by the calculated R-squared that indicates 79% of the change in P/S can be explained through
NPM. In comparison to its peers, Nike has the second highest P/S and third highest NPM, so it
appears to be fairly valued versus the broad spectrum of peers. Assuming the relationship holds
going forward, the fair value for NKE is $94.04 at the end of the year or about $91.49 now.
Estimated P/S = Estimated 2015 NPM (9.72%)* 33.833 – 0.6132 = 2.76
Target Price = Estimated P/S * 2015 SPS ($35.15) = $94.04/share.
Composite Ranking
As final comparison, I created a composite ranking of several valuation and fundamental metrics.
The analysis is shown below. Each metric was standardized to a percentile (100% reflects best
fundamentals or more expensive) before determining the composite score. A 50% weight composite
of 2014 ROE and NPM was compared to a 100% weight of P/B.
Figure 30: Composite Relative Valuation
Based on this analysis, NKE should trade a valuation of 63% of the maximum; however, it is at 75%.
This indicates it is overvalued.
Weight
Ticker Name
NKE NIKE INC
ADS-DE ADIDAS AG
SKX SKECHERS U S A INC
SHOO MADDEN STEVEN LTD
COLM COLUMBIA SPORTSWEAR CO
HBI HANESBRANDS INC
LULU LULULEMON ATHLETICA INC
DECK DECKERS OUTDOOR CORP
VFC VF CORP
WWW WOLVERINE WORLD WIDE
7936-JP ASICS CORP
50.0% 50.0% 100.0%
2014 2014
ROE NPM P/B Fund Value Diff
61% 67% 75% 64% 75% -12%
31% 29% 29% 30% 29% -16%
32% 40% 45% 36% 45% -23%
41% 56% 42% 49% 42% -1%
24% 43% 35% 33% 35% -16%
100% 71% 100% 86% 100% -5%
60% 100% 94% 80% 94% -7%
38% 59% 27% 48% 27% 14%
58% 71% 61% 65% 61% 4%
43% 41% 40% 42% 40% -9%
35% 40% 40% 37% 40% -16%
Fundamental
Percent of
Max
Valuation
Percent of
Max
Weighted Target
Value
63%
14%
22%
41%
19%
95%
87%
41%
65%
32%
25%
Source: Factset, IMCP
17. INVESTMENT MANAGEMENT CERTIFICATE PROGRAM May 1, 2015
17
Figure 31: Composite Relative Valuation
Discounted Cash Flow Analysis
A three stage discounted cash flow model was also used to value Nike.
For the purpose of this analysis, the company’s cost of equity was calculated to be 9.60% using the
Capital Asset Pricing Model. The underlying assumptions used in calculating this rate are as follows:
The risk free rate, as represented by the ten year Treasury bond yield, is 1.92%.
A five year adjusted Beta of 0.95 was utilized since the company has similar risk as the market.
A long term market rate of return of 10% was assumed, since historically, the market has
generated an annual return of about 10%.
Given the above assumptions, the cost of equity is 9.60% (1.92 + 0.95 (10.0 – 1.92)).
Stage One - The model’s first stage simply discounts fiscal years 2015 and 2016 free cash flow to
equity (FCFE). These per share cash flows are forecasted to be $2.26 and $2.79, respectively.
Discounting these cash flows, using the cost of equity calculated above, results in a value of $2.07
and $2.32 per share in 2015 and 2016 respectively. Thus, stage one of this discounted cash flow
analysis contributes $4.39 to value.
Stage Two - Stage two of the model focuses on fiscal years 2017 to 2021. During this period, FCFE is
assumed to begin growing at an annual rate of 9% and then falls to 8%. The resulting cash flows are
then discounted using the company’s 9.60% cost of equity.
Figure 32: FCFE and Discounted FCFE for
When added together, these discounted cash flows total $14.53.
Stage Three – For the terminal value of the company, you may recall, fiscal year 2015 and 2016
earnings per share are forecasted to be $3.42 and $3.67, respectively. It was then assumed that
earnings per share would grow, from these forecasted numbers, at an annual rate of 9% for 2017,
and 8
th
for the next four years (figure 33).
Nike
R² = 0.8577
y = 1.2291x - 0.1003
0.0
0.1
0.2
0.3
0.4
0.5
0.6
0.7
0.8
0.9
1.0
0.0 0.2 0.4 0.6 0.8 1.0
Valuation
Fundamental
2015 2016 2017 2018 2019 2020 2021
FCFF/share $2.26 $2.79 $2.81 $3.03 $3.27 $3.54 $3.82
Discounted FFCF $2.07 $2.32 $2.13 $2.10 $2.07 $2.04 $2.01
Source: IMCP
18. INVESTMENT MANAGEMENT CERTIFICATE PROGRAM May 1, 2015
18
Figure 33: EPS estimates for 2012-2018
Stage three of the model also requires an assumption regarding the company’s terminal price-to-
earnings ratio. For the purpose of this analysis, it is assumed that as the company grows larger and
matures, its price-to-earnings ratio will converge near to the historical average of the S&P 500.
Therefore, a price-to-earnings ratio of 23 is assumed at the end of Nike’s terminal year. While this
may be high at the end of 2021, one must also consider what the market will price in today. A lower
multiple may be better to calculate fair value, but the stock will likely trade above as this value since
the market will be slow to price in NKE’s slowing growth.
Given the assumed terminal earnings per share of $5.44 and a price to earnings ratio of 23, a
terminal value of $125.16 per share is calculated. Using the 9.60% cost of equity, this number can be
discounted to a present value of $65.91.
Total Present Value – Given the above assumptions and utilizing a three stage discounted cash flow
model, an intrinsic value of $80.65 per share is calculated ($4.39 + $10.14 + $65.91). Given Nike’s
current price of $100, this model indicates that the stock is significantly overvalued.
Figure 34: 3-stage DCF model
2015 2016 2017 2018 2019 2020 2021
Earnings/share $3.42 $3.67 $4.00 $4.32 $4.67 $5.04 $5.44
3 Stage DCF P/E Terminal Value Model
Cost of equity FCFE1 (better def) $2.26 2015 Terminal year P/S
Risk free rate 1.92% FCFE2 (better def) $2.79 2016 2021 2.87
Beta 0.95 Terminal year P/B
Market return 10.0% EPS1 $3.42 2015 2021 7.03
Market risk premium 8.1% EPS2 $3.67 2016 Terminal year P/E
Stock risk premium 7.7% 2021 23.00
r = rf+ stock RP 9.60%
2nd Stage Growth (option to enter 1 rate for years 3-7) 8.0%
Source: IMCP
19. INVESTMENT MANAGEMENT CERTIFICATE PROGRAM May 1, 2015
19
First Stage Second Stage
Cash flows 2015 2016 2017 2018 2019 2020 2021
Sales $31,037 $33,993 $37,052 $40,017 $43,218 $46,675 $50,410
Growth 9.5% 9.0% 8.0% 8.0% 8.0% 8.0%
NOPAT $3,039 $3,252 $3,545 $3,829 $4,135 $4,466 $4,823
% of sales 9.8% 9.6% 9.6% 9.6% 9.6% 9.6% 9.6%
- Change in NWC 564 461 598 646 697 753 813
NWC EOY 7013 7474 8071 8717 9415 10168 10981
Growth NWC 6.6% 8.0% 8.0% 8.0% 8.0% 8.0%
NWC / S (EOY) 22.6% 22.0% 21.8% 21.8% 21.8% 21.8% 21.8%
- Chg NFA 453 314 453 490 529 571 617
NFA EOY 5,351 5,666 6,119 6,608 7,137 7,708 8,325
Growth NFA 5.9% 8.0% 8.0% 8.0% 8.0% 8.0%
S / NFA (EOY) 5.80 6.00 6.06 6.06 6.06 6.06 6.06
Total inv in op cap 1017 775 1051 1135 1226 1324 1430
Total net op cap 12364 13139 14190 15325 16552 17876 19306
S / IC (EOY) 2.51 2.59 2.61 2.61 2.61 2.61 2.61
ROIC (EOY) 24.6% 24.8% 25.0% 25.0% 25.0% 25.0% 25.0%
FCFF $2,022 $2,477 $2,494 $2,694 $2,909 $3,142 $3,393
% of sales 6.5% 7.3% 6.7% 6.7% 6.7% 6.7% 6.7%
Growth 22.5% 0.7% 8.0% 8.0% 8.0% 8.0%
- Interest (1-tax rate) 23 18 19 21 22 24 26
Growth -22.2% 8.0% 8.0% 8.0% 8.0% 8.0%
FCFE $1,999 $2,460 $2,475 $2,673 $2,887 $3,117 $3,367
% of sales 6.4% 7.2% 6.7% 6.7% 6.7% 6.7% 6.7%
Growth 23.0% 0.6% 8.0% 8.0% 8.0% 8.0%
/ No Shares 882.9 881.5 881.5 881.5 881.5 881.5 881.5
Growth -0.2% 0.0% 0.0% 0.0% 0.0% 0.0%
FCFE $2.26 $2.79 $2.81 $3.03 $3.27 $3.54 $3.82
Growth 23.2% 0.6% 8.0% 8.0% 8.0% 8.0%
* Discount factor 0.91 0.83 0.76 0.69 0.63 0.58 0.53
Discounted FCFE $2.07 $2.32 $2.13 $2.10 $2.07 $2.04 $2.01
Third Stage
Terminal value P/E
Net income $3,016 $3,235 $3,526 $3,808 $4,113 $4,442 $4,797
EPS $3.42 $3.67 $4.00 $4.32 $4.67 $5.04 $5.44
Growth 7.4% 9.0% 8.0% 8.0% 8.0% 8.0%
Terminal P/E 23.00
* Terminal EPS $5.44
Terminal value $125.16
* Discount factor 0.53
Discounted terminal value $65.91
Summary
First stage $4.39 Present value of first 2 year cash flow
Second stage $10.36 Present value of year 3-7 cash flow
Third stage $65.91 Present value of terminal value P/E
Value (P/E) $80.65 = value at beg of fiscal yr 2015
Source: IMCP
20. INVESTMENT MANAGEMENT CERTIFICATE PROGRAM May 1, 2015
20
Market Expectations
The current market price of $100.82 is vastly different from the $80.65 determined from the 3-stage
DCF model previously created. In order to determine the differences between my expectations and
the market, a sensitivity table was created below.
Figure 35: Sensitivity Table
To achieve the $100 market price, the terminal P/E and growth rate are expected to be 25 and 14%
respectively, represented by the bold $101.16. When looking at consensus data from Factset, the
long term growth rate is 14.1% and 2015E P/E is 25. Notice that the both the consensus and
sensitivity table data are nearly the exact same.
Bull/Bear Case
Nike’s future sales could improve or decline. However, if everything went right for the company for
the next two years, I believe that the firm will see a sales growth of 12% and 10% in 2015 and 2016
respectively. Also, in the bull case, gross margin should settle at 10.5% for both 2015 and 2016. If the
bull case were to materialize, I estimate the company’s EPS to reach $3.48 in 2015 and $3.76 in
2016.
On the other hand, if Nike does not fare well in the next two years, I expect the sales to grow at 11%
and 6.5% for 2015 and 2016 respectively. Also, the gross margin should decline and settle in at 6.5%
for the next two years. If the bear case were to materialize, I estimate the company’s EPS to be
$3.13 in 2014 and $3.07 in 2015.
$80.65 2% 4% 6% 8% 10% 12% 14%
19 59.96$ 62.89$ 65.96$ 69.19$ 72.57$ 76.12$ 79.83$
20 62.24$ 65.35$ 68.62$ 72.06$ 75.66$ 79.43$ 83.38$
21 64.53$ 67.82$ 71.28$ 74.92$ 78.74$ 82.74$ 86.94$
22 66.81$ 70.28$ 73.94$ 77.79$ 81.82$ 86.06$ 90.49$
23 69.09$ 72.75$ 76.60$ 80.65$ 84.91$ 89.37$ 94.05$
24 71.37$ 75.21$ 79.26$ 83.52$ 87.99$ 92.68$ 97.61$
25 73.65$ 77.68$ 81.92$ 86.38$ 91.07$ 96.00$ 101.16$
26 75.93$ 80.14$ 84.58$ 89.25$ 94.16$ 99.31$ 104.72$
27 78.21$ 82.61$ 87.24$ 92.11$ 97.24$ 102.62$ 108.28$
Terminal Growth Rate
TerminalP/E
2015E 2016E
Base 3.42 3.67
Consensus 3.55 3.94
Bull 3.48 3.76
Bear 3.13 3.07
EPS Projection
21. INVESTMENT MANAGEMENT CERTIFICATE PROGRAM May 1, 2015
21
Business Risks
Nike is subject to a variety of business risks. The most significant risks are described below.
(Source: Company 10k)
Exposure to currency fluctuations
The majority of Nike’s products are manufactured and sold outside of the US, resulting in
transactions with various currencies. Increased exposure to currency fluctuation could result in
lower revenues and higher costs which would further lead to decreased margins and earnings.
Competitive marketplace
The footwear, apparel, and equipment industry is highly competitive on a global basis. Nike faces
intense competition for both sales and independent manufactures that produce products. It is vital
for Nike to timely anticipate and respond to competitors in order to remain intact.
Continue recruiting high quality endorsers
Nike develops sentiment with consumers through its relationships with professional athletes, sports
teams and leagues. If certain endorsers were to stop using Nike products, or perform actions that
would harm its reputation, it could seriously harm Nikes brand image with consumers. Furthermore,
failure to identify and sign promising athletes could adversely affect the firm.
Unable to anticipate consumer preferences
Consumer preferences could shift rapidly to different types of performance products. The future
success of Nike depends on its ability to anticipate and respond to those consumer demands. If not,
Nike could experience lower sales, excess inventories, or lower profit margins.
Protecting and enforcing intellectual property
Protecting the Nike brand requires the firm to protect its patents by preventing imitation products.
Nike may also be subjected to liability if it infringes on other firm’s intellectual property.
Infringement claims could be expensive and time consuming, and may result in significant damages
or decreased sales of certain products. Also, the laws of some countries may not protect or allow
enforcement of intellectual property rights to the extent of the US. Foreign affairs can cause
considerable expenses and still not be successful.
Direct to Consumer operations
Nike’s high profile DTC venues have required capital expenditures that require substantially more
investment than other stores. The firm is now associated with many factors of risk that are
associated with brick-and-mortar stores due to the high fixed cost structure.