LBS Asset Allocation August Update - July 28, 2017
•
0 likes•70 views

Global economic data continues to show strong growth, but signs point to a peak in momentum. While US and Eurozone manufacturing surveys weakened, emerging market equities continue outperforming. Key indicators like flattening yield curves and disconnect between commodities and the US dollar suggest growth is likely decelerating. The document recommends slightly increasing exposure to emerging market equities and reducing underweight of other developed markets. It also recommends overweighting health care in the US and financials in Canada.

Recommended
Recommended
More Related Content
What's hot
What's hot (20)
Similar to LBS Asset Allocation August Update - July 28, 2017
Similar to LBS Asset Allocation August Update - July 28, 2017 (20)
More from Mark MacIsaac
More from Mark MacIsaac (20)
Recently uploaded
Recently uploaded (20)
LBS Asset Allocation August Update - July 28, 2017
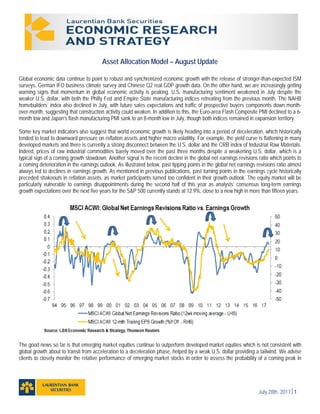
- 1. July 28th, 20171 Asset Allocation Model – August Update Global economic data continue to point to robust and synchronized economic growth with the release of stronger-than-expected ISM surveys, German IFO business climate survey and Chinese Q2 real GDP growth data. On the other hand, we are increasingly getting warning signs that momentum in global economic activity is peaking. U.S. manufacturing sentiment weakened in July despite the weaker U.S. dollar, with both the Philly Fed and Empire State manufacturing indices retreating from the previous month. The NAHB homebuilders’ index also declined in July, with future sales expectations and traffic of prospective buyers components down month- over-month, suggesting that construction activity could weaken. In addition to this, the Euro-area Flash Composite PMI declined to a 6- month low and Japan’s flash manufacturing PMI sank to an 8-month low in July, though both indices remained in expansion territory. Some key market indicators also suggest that world economic growth is likely heading into a period of deceleration, which historically tended to lead to downward pressure on reflation assets and higher macro volatility. For example, the yield curve is flattening in many developed markets and there is currently a strong disconnect between the U.S. dollar and the CRB index of Industrial Raw Materials. Indeed, prices of raw industrial commodities barely moved over the past three months despite a weakening U.S. dollar, which is a typical sign of a coming growth slowdown. Another signal is the recent decline in the global net earnings revisions ratio which points to a coming deterioration in the earnings outlook. As illustrated below, past tipping points in the global net earnings revisions ratio almost always led to declines in earnings growth. As mentioned in previous publications, past turning points in the earnings cycle historically preceded shakeouts in reflation assets, as market participants turned too confident in their growth outlook. The equity market will be particularly vulnerable to earnings disappointments during the second half of this year as analysts’ consensus long-term earnings growth expectations over the next five years for the S&P 500 currently stands at 12.9%, close to a new high in more than fifteen years. The good news so far is that emerging market equities continue to outperform developed market equities which is not consistent with global growth about to transit from acceleration to a deceleration phase, helped by a weak U.S. dollar providing a tailwind. We advise clients to closely monitor the relative performance of emerging market stocks in order to assess the probability of a coming peak in
- 2. Economic Research and Strategy Asset Allocation Model – August Update July 28th, 20172 global growth rates. Another key indicator to closely monitor is copper as the metal is commonly seen as a good proxy for the global economy. The recent rally in copper prices has not yet confirmed a weakening global economic momentum scenario, with Freeport- McMoRan CEO recently saying that current China copper demand is better than most expected. We still maintain our neutral stance on equity vs. fixed income this month. Regional Allocation There is no major change to our regional allocation this month. We are slightly raising our overweight position in emerging market equities as they remain cheap relative to developed market equities. Macroeconomic conditions also remain ideal for emerging markets, with low real rates, soft inflation measures, easy financial conditions and improving global trade. The current weakness in the U.S. dollar is also proving a tailwind to emerging market equities as this leaves room for EM central banks to ease monetary policy: the EM-DM real yield differential remains historically wide and there is less need to defend the currencies. Forward earnings for emerging markets are also on the rise relative to developed markets, which represents another tailwind for EM equities. The environment for EM equities is also improving with the current breakout in commodity prices such as copper. We are also slightly reducing our underweight exposure to Other Developed Markets at the expense of U.S. equities. The historically wide spread observed since March between the net earnings revisions ratio of U.S. equities against Other Developed Markets is now close and this is removing a major source of outperformance for U.S. equities. Other Developed Market equities also continue to trade at a discount to U.S. equities. Sector Rotation As for our sector allocation in Canada, we still recommend to overweight the Industrials, Information Technology, Telecommunication Services and Energy sectors. On the other hand, we are replacing Materials from our list of top overweight sectors with the Financials sector. The relative upward earnings revisions ratio for the Financials sector against the broader market is back on the rise, which historically tended to coincide with sector outperformance. The sector is also reasonably valued against the S&P/TSX Composite index, with the relative 12-month forward Price-to-earnings ratio slightly below its 15-year average. Financials also rank high in both our earnings and price momentum models. Also, our expectations for a rebound in the U.S. dollar and rising interest rates could hurt the relative performance of the Materials sector, which is heavily weighted to gold companies. In the U.S., we still advise clients to overweight the Energy, Information Technology, Telecommunication Services and Real Estate sectors. However, we are replacing Materials and Consumer Staples from our list of top overweight sectors with the Health Care sector. Relative valuation for health care companies is attractive with the relative 12-month forward Price-to-earnings ratio against the S&P 500 trading below its 20-year average. Also, relative 12-month forward earnings growth for the sector against the broader market is back on the rise following the 2015-2016 weakness, which historically coincided with sector outperformance. Canadian Bond Allocation Our recommended bond allocation is unchanged this month as we continue to overweight corporate bonds against Canadian government. The positive momentum of key forward looking economic indicators such as U.S. initial unemployment claims and ISM surveys remains supportive of credit. Also the ongoing earnings acceleration and still improving profit margin outlook should contribute to further spread compression. With central banks expected to keep their accommodative stance for some time as inflation readings remain soft and rates are not yet approaching restrictive levels, credit should continue to outperform government bonds. However, the
- 3. Economic Research and Strategy Asset Allocation Model – August Update July 28th, 20173 late stage of the current business cycle, rapidly deteriorating credit metrics and recent decline in the global net earnings revisions ratio represent significant sources of concern and largely explained our decision to reduce our overweight position in late June. We also remain concerned by historically elevated valuations and the fact that still low market-based measures of inflation compensation do not indicate an imminent global economic growth breakout. Luc Vallée, Ph.D | Chief Strategist Tel: 514 350-3000 | ValleeL@vmbl.ca Eric Corbeil, M.Sc., CFA, FRM | Senior Economist Tel: 514 350-2925 | CorbeilE@vmbl.ca This document is intended only to convey information. It is not to be construed as an investment guide or as an offer or solicitation of an offer to buy or sell any of the securities mentioned in it. The author is an employee of Laurentian Bank Securities (LBS), a wholly owned subsidiary of the Laurentian Bank of Canada. The author has taken all usual and reasonable precautions to determine that the information contained in this document has been obtained from sources believed to be reliable and that the procedures used to summarize and analyze it are based on accepted practices and principles. However, the market forces underlying investment value are subject to evolve suddenly and dramatically. Consequently, neither the author nor LBS can make any warranty as to the accuracy or completeness of information, analysis or views contained in this document or their usefulness or suitability in any particular circumstance. You should not make any investment or undertake any portfolio assessment or other transaction on the basis of this document, but should first consult your Investment Advisor, who can assess the relevant factors of any proposed investment or transaction. LBS and the author accept no liability of whatsoever kind for any damages incurred as a result of the use of this document or of its contents in contravention of this notice. This report, the information, opinions or conclusions, in whole or in part, may not be reproduced, distributed, published or referred to in any manner whatsoever without in each case the prior express written consent of Laurentian Bank Securities.