
Recommandé
Recommandé
Contenu connexe
Tendances
Tendances (19)
Similaire à A Western View of China's Internal and External Innovation Ecosystem - ICT Sectors
Similaire à A Western View of China's Internal and External Innovation Ecosystem - ICT Sectors (20)
Plus de Martha Russell
Plus de Martha Russell (20)
Dernier
Dernier (20)
A Western View of China's Internal and External Innovation Ecosystem - ICT Sectors
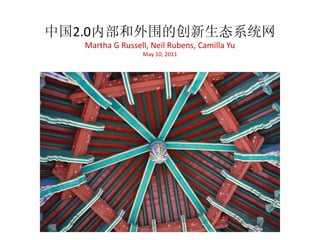
- 1. 中国2.0内部和外围的创新生态系统网 Martha G Russell, Neil Rubens, Camilla Yu May 10, 2011 Photo: Kaisa Still, 2010
- 2. 创新生态系统网络(IEN)汇集国际跨学科的团队,旨在发展和传播新型数据 和工具,从而了解信息和通信技术在区域内起到的促进作用。 网 Innovation Ecosystems Network, 2011 2
- 4. Strategic Value Creation Networks • Critically important in technology development and economic growth • Co-creation relies the relationship infrastructure of people, organizations and policies. – These complex intangible relationship assets can be observed through network analysis of small, medium and large enterprises. – By identifying relationships through which information and financial resources flow, visual insights toward a shared vision can be created and strategic network orchestration can be implemented. – Using social network analysis, these relationship patterns can reveal 网 • competitive forces 网 • gatekeepers 网 • collaboration opportunities • within and across sectors • in internal and external innovation ecosystems • around the world, including China 2.0.
- 5. Models of innovation • Identify and empower influential activate the evolution of the ecosystem • Develop and implement programs (meetings, funding, initiatives) to foster co-creator networks Collaborative Innovation Open innovation- Networks- Gloor Chesbrough 2003 2005 Strategic Innovation- Hamel and Prahalad 1994 End-user Innovation- von Hippel 1986 Economic Innovation • Communicate complexity to co- (producer innovation)- create vision Schumpeter 1934 • Measure the transformation of an innovation ecosystem
- 6. Innovation Ecosystems & Value Co-Creation Innovation Ecosystems Transformation Framework 网 网 网 A dynamic innovation ecosystem is characterized by a continual realignment of synergistic relationships of people, knowledge, and resources that promote harmonious growth of the system in agile responsiveness to changing internal and external forces. Innovation Ecosystems refer to the inter-organizational, political, economic, environmental, and technological systems through which a milieu conducive to business growth is catalyzed, sustained, and supported. Value is co-created for the innovation ecosystem through events, impacts and coalitions/networks that emerge from a shared vision of the desired transformations. Data-driven metrics measure, track and visualise the transformation, empowering interaction with feedback for the shared vision. www.innovation-ecosystems.org
- 7. Infrastructure for Resource Flows - - - Relationships The Way We USED to Think About Organizations New Organizational Chart Based on Relationships Relationship-Focused Co-Creation Infrastructure (Companies are interlocked through key people – information flow, norms, mental models.(Davis,1996) (Visual) Social Network Analysis “. . . allows investigators to gain new insights into the patterning of social connections, and it helps investigators to communicate their results to others.“ (Freeman, 2009)
- 8. Relationship Interlocks • Executives and key employees – Transfer of technologies and knowledge, professional networks, business culture, value-chain resources • Directors – US Fortune 500 firms interlocked (shared directors) with average 7 other firms • Corporate governance embedded and filtered through social structures – Executive compensation, strategies for takeovers, defending against takeovers • Gerald F. Davis, “The Significance of Board Interlocks for Corporate Governance,” Corporate Governance 4:3, 1996 • Investors and service providers – Awareness of external forces, competitive insights, resource leverage • Relationship interlocks provide – Social relationship “filter” for governance, information flow & norms – Transfer of implicit and explicit know-how – Mental models http://fusionenterprises.ca/Business_Training.php
- 9. Alumni Form Value Creation Networks
- 10. From IEN Dataset 2010 Global video_games sector CapDigital members in sector manually enhanced for emphasis Global Video & Games Sectors Preliminary and proprietary for CapDigital Innovation Ecosystems Network 10 CapDigital membersmanually inflated for emphasis Permission required for sharing © 2010 Innovation Ecosystems Network
- 11. Networks of Female and Male Executives in Companies in the Biotech Sector Kaisa Still, Neil Rubens, Jukka Huhtamäki, and Martha Russell , “Networks of Executive Women in Technology-Based Innovation Ecosystems,” Technical Report
- 12. Traditional Data Gathering Methods http://www.flickr.com/photos/tomatoskin/1339929731/
- 13. Have to react QUICKLY http://www.flickr.com/photos/clydeorama/3495284608/
- 14. “There is no data like more data” “There is no data like more data” (Mercer at Arden. House,1985) (Mercer at Arden. House, 1985) Tan, Steinbach, Kumar; 2004 8,000 points 2,000 points 500 Points
- 15. Mashup Easy, fast integration, using APIs and data sources to produce results that were not the original reason for producing the raw source data [wiki]. 15
- 16. Higher Dimensions: Double Edged Sword More Data is Need bonn.de/research/projects/engel/engelpr2/pr2_thumb.jp http://wissrech.ins.uni- g http://www.iro.umontreal.ca/~bengioy/yoshua_en/research_files/CurseDimensionality.jpg Could be easier to find patterns
- 17. Data for Visualization & Shared Vision Accessing Data Streams about Innovation Building a Dataset on Innovation Crystallisation Through Visualisation The Card-Mackinlay-Shneiderman visualisation reference model:(Card et al., 1999; Miksch, 2005)
- 18. Place of innovation Innovation Cluster- Yim Regional 2008, 2002 Innovation Systems- Clusters- Porter 1998, Metcalfe 1995 Saxenian 1994 Menlo Park (Research Park) 1948, Stanford Industrial Park 1951, Research Triangle Park 1959 Localized concentrations - Marshall 1890
- 19. . Number of US Technology-based companies By sector, Dec 2009 Neil Rubens, Kaisa Still, Jukka Huhtamaki, Martha G. Russell “Leveraging Social Media for Analysis of Innovation Players and Their Moves” Technical Report. Media X, Stanford University, Feb.2010.
- 20. . Number of US Technology-based companies Advertising & Web, Dec 2009 Neil Rubens, Kaisa Still, Jukka Huhtamaki, Martha G. Russell “Leveraging Social Media for Analysis of Players and Players and Their Moves” “Behind the Innovation Curtain: Mobile Innovation Their Moves.” Technical Report. Media X, Stanford University, Feb.2010. Submitted to the International Conference on Mobile Business,” Intl Conf on Mobile Business.
- 21. . Number of US Technology-based companies Biotech & Cleantech, Dec 2009 Neil Rubens, Kaisa Still, Jukka Huhtamaki, Martha G. Russell “Behind the Innovation Curtain: Mobile Players and Their Moves.” Submitted to the International Conference on Mobile Business,” Intl Conf on Mobile Business. Neil Rubens, Kaisa Still, Jukka Huhtamaki, Martha G. Russell “Leveraging Social Media for Analysis of Innovation Players and Their Moves”
- 22. Distance Old New
- 23. The new maps may be based on the connections - rather than on distance.
- 24. Global Perspectives - Three Examples • Parisian Innovation Ecosystem: Digital Media • Norwegian ICT Innovation Ecosystem • China ICT – Western view – Internal Ecosystems – External Ecosystems
- 25. Case Study - CapDigital Conducted stakeholder interviews to understand shared vision, tap knowledge in practice, identify transformational metrics •CapDigital staff •CapDigital members: – Small startup – Large company – Collaboration Vision To catalyze the new digital infrastructure in France with global connections To create an ecosystem to facilitate the relationship between France and global market Enable Paris to become global region of the market for digital services Innovation Ecosystems Network November 25 2010
- 26. From IEN Dataset 2010 Selected Paris companies Pale Red: French company Linked people & venture/financing entities Dark Red: CapDigital member Linked companies, people & v/f entities 1 degree Network Graph Light Green: Foreign Venture/ firm 2 degree Dark Green: French venture firm Parisian Innovation Ecosystem Blue: Foreign company Preliminary and proprietary for CapDigital © 2010 Innovation Ecosystems Network Permission required for sharing Innovation Ecosystems Network 26
- 27. From IEN Dataset 2010 Selected Paris companies Pale Red: French company Linked people & venture/financing entities Dark Red: CapDigital member Linked companies, people & v/f entities 1 degree Light Green: Foreign Venture/ firm 2 degree Dark Green: French venture firm Blue: Foreign company Preliminary and proprietary for CapDigital © 2010 Innovation Ecosystems Network Permission required for sharing Parisian Innovation Ecosystem CapDigital – France - Global Innovation Ecosystems Network 27
- 28. 1 2 3 Innovation Ecosystems Network 28
- 29. Zone 1 Opportunity VC Community In Zone 1, most of the companies are highly connected with VC or other companies. VCs are making investments actively - many high potential opportunities to funding. Venture & financing provides local relationships Alto-invest Funds 6 French media companies, none are CapDigital members Some funded by other VCs also Some VCs and companies provide global relationships – Unruly Media (headquartered in London) – Unruly Media helps agencies and marketers distribute branded content on the social web. – Using a cost-per-engagement pricing model and non-interruptive advertising formats, Unruly Media’s global network of influential blogs, cult web properties, video sites, and social media applications brings scale, targeting, and safety to a fragmented and chaotic long-tail media landscape. – Founded in 2006 by Scott Button, Matt Cooke and Sarah Wood, Unruly is headquartered in London, UK. Innovation Ecosystems Network 29
- 30. Zone 2 Opportunity Potential New Members for Cap Digital In zone 2, most of the companies have fewer connections There are many French based companies, to which CapDigital reach out Some zone 2 companies already have global connections to be leveraged. • Webwag publishes Mobile and Web widget convergent solutions, helps users create a personalized home page with data feeds and web 2.0 services that are always accessible from any computer or mobile. Its technologies are made available in white brand to its customers that include Network Operators, handset and connected devices manufacturers, service owners and media publishers. Innovation Ecosystems Network 30
- 31. Zone 3 Opportunity Expand Global Network Many foreign companies in Zone 3 - opportunities for CapDigital to seek international partnerships. Wellington Partners • A venture capital firm that invests in French and intl firms in Digital Media and Software • Offices in Munich, London, Palo Alto, Zuirch. • Co-invests with a French VC. Innovation Ecosystems Network 31
- 33. The Norwegian Puzzle • Norway is a wealthy country with high standard of living and almost NO unemployment • Yet, low rate of technology-based innovation • What is the future of Norway after oil reserves have been extracted? • Given technology targets: – How can innovation be catalyzed? – How can establishing global relationships be accelerated?
- 34. Norwegian Tech-based Companies Their Branch Offices and Their Financial Orgs Example view to IEN dataset in Gephi. Companies are selected with keyword search “Norway + Norwegian;” the funding organizations Links show relationships associated with those companies are added Nodes represent companies and their investors; edges indicate resource flows. The network layout is created with Yifan Hu Multilevel algorithm and nodes are inflated according to their indegree, i.e. the number of the connected investors.
- 35. Advisors & Investors Expand Access Investors leverage co-creation opportunities with investments in multiple companies. Intl companies not shown. Companies leverage value co-creation opportunities through relationships with multiple investors. Some investors are international. Timeline analysis of investment events reveals patterns of co-investment – an indication of intention to co-create value and, perhaps, stimulus programs. IEN Dataset, July 2010
- 36. International Relationships for Value Co-Creation Huge opportunities for international relationships lie 2 & 3 degrees out from Norwegian companies IEN Dataset, July 2010 Example view to IEN dataset for keyword search. Nodes represent companies and their previous and current employees. The network layout is created with Fruchterman Reingold algorithm and nodes are inflated according to their outdegree. Protocols for anonymity are evolving.
- 37. Globalization of Norwegian ICT Norwegian tech-based companies with financing are more likely to have networked relationships. Norwegian tech-based companies have access to global relationships through current board members, investors, and key personnel. IEN Dataset, July 2010
- 38. Insights About Norway • Dual offices: regional and Oslo • In sectors we studied – Business locations parallel technical university programs – Investor relationships have strong local links • Some investing organizations are governmental programs • Expands to Oslo when offices are in Oslo • International relationships linked to small set of personal relationships at executive level – International investors drawn through executive relationships • Relationships through execs at Google and AOL provide channels for global network expansion
- 40. Context of Investments into/from China Socially constructed dataset, in English, openly available– all challenges in China Socially Innovation Ecosystems Dataset: Constructed Data •323 technology-based companies with one or more locations in China •42 Chinese, 77 foreign investment firm Social •Investment into China US$ 5.4 B Network •Investment originating from China Analysis US$ 3.1 B Insights explored: Insights into Innovation The flow of financial resources into and out of China More illustrative than descriptive/prescriptive results Neil Rubens, Kaisa Still, Jukka Huhtamaki, Martha G. Russell, A Network Analysis of Investment Firms as Resource Routers in Chinese Innovation Ecosystem, Journal of Networks, Fall, 2010. Innovation Ecosystem Network
- 41. More Specific: Context of eCIS sector eCommerce and electronic security= eCommerce, software search, network hosting, mobile, games &video, enterprise Initial Data Analysis: 53% (113) of the Chinese companies Socially Constructed from eCIS business sector Data 50 % (66) of the foreign companies are from the eCIS business sector Social Network Toward Insights about: Analysis Patterns and differences in the Insights into characteristics of investment flows Innovation into and from China Neil Rubens, Kaisa Still, Jukka Huhtamaki, Martha G. Russell, A Network Analysis of Investment Firms as Resource Routers in Chinese Innovation Ecosystem, Journal of Networks, Fall, 2010. Innovation Ecosystem Network
- 42. CULTIVATION Investments into China (receiving investments) Neil Rubens, Kaisa Still, Jukka Huhtamaki, Martha G. Russell A Network Analysis of Investment Firms as Resource Routers in Chinese Innovation Ecosystem, Journal of Networks, Fall, 2010. Innovation Ecosystem Network
- 43. Emerging Chinese business clusters linked by firms’ relationships Neil Rubens, Kaisa Still, Jukka Huhtamaki, Martha G. Russell A Network Analysis of Investment Firms as Resource Routers in Chinese Innovation Ecosystem, Journal of Networks, Fall, 2010.
- 44. HARVEST Investments from Chinese (making investments) Neil Rubens, Kaisa Still, Jukka Huhtamaki, Martha G. Russell, A Network Analysis of Investment Firms as Resource Routers in Chinese Innovation Ecosystem, Journal of Networks, Fall, 2010. Innovation Ecosystem Network
- 45. Topline Findings • Modes of value co-creation • Cultivation • Harvesting • Chinese interlocks at the investment firm level – Government-led investment firms – Knowledge of government guarantees – Investments in firms that return benefits to China • Global interlocks at both investment firm and enterprise levels • Opportunity network & value co-creation http://successbeginstoday.org/wordpress/wp-content/unexpected2.jpg
- 46. A Western View: China’s Internal Innovation Ecosystem Chinese investment organizations, companies, branch offices
- 47. A Western View of China’s External Innovation Ecosystem
- 48. Intl investments into Chinese companies
- 50. Innovation Ecosystem Networks Action Model Translate, measure and transform an innovation ecosystem Impact Measure & Track Co-Create Source Value Absorb Exchange Isolates Shared Vision Transformation Event Coalition Gatekeepers Stars Interact & Feedback Innovation Ecosystems Network 2011 50
- 51. Innovation Ecosystems Network http://www.innovation-ecosystems.org • Martha G Russell, PhD, martha.russell@stanford.edu – Sr. Research Scholar, HSTAR Institute • Ben LeNail – Associate Director, Media X at Stanford University • benlenail@pacbell.net • Media X Visiting Researcher • Neil Rubens, PhD, neil@hrstc.org – Assistant Professor, Graduate School of Information Systems • Mergers & Acquisitions – University of Electro-Communications, Tokyo • Mario Gastel, mariogastel@zeelandnet.nl – Graduate student, Texas Advertising, UT Austin • Jukka Huhtamäki, jukka.huhtamaki@tut.fi – Fulbright Scholar (2009-11) – Researcher, Lecturer – Hypermedia Laboratory (HLab) of Tampere University of Technology (TUT). • Jiafeng (Camilla) Yu, camillayu@gmail.com – M.A. in Advertising in Planning Track • Kaisa Still, PhD, kaisastill@yahoo.com – The University of Texas at Austin – Knowledge Management Specialist – Beijing DT Electronic Technology Co., Ltd 51
- 52. Questions? Martha.Russell@stanford.edu Neil@hsrtc.org CamillaY@stanford.edu http://4.bp.blogspot.com/_qFju91K89HM/SxRpABd1DTI/AAAAAAAABjw/6LaSJfjfk-I/s1600/Unexpected_Guests.jpg
- 53. THANK YOU! www.innovation-ecosystems.org 社交架 构的数 据 社交网 络分析 对于创新的 洞察 Innovation Ecosystem Network