Mint 50 Best Funds
•
1 j'aime•3,333 vues

Here's a list of schemes that made it to Mint 50. The returns are across three time periods and you would do well to first look at five- and 10-year performances and then look at the three-year return to see if the fund is still ahead. Value Research rating gives an indication of the risk-adjusted return.

Recommandé
Contenu connexe
Tendances
Tendances (16)
Similaire à Mint 50 Best Funds
Similaire à Mint 50 Best Funds (20)
Plus de Marwah Financial®
Plus de Marwah Financial® (13)
Dernier
Dernier (20)
Mint 50 Best Funds
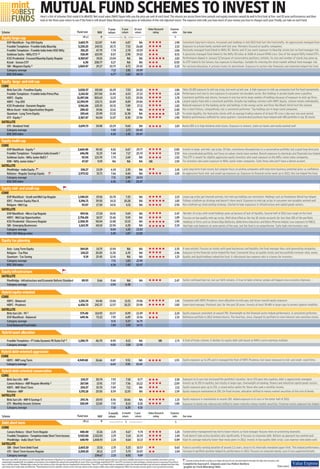
- 1. MUTUAL FUND SCHEMES TO INVEST IN Here's a list of schemes that made it to Mint50. Net asset value (NAV) figure tells you the price per unit of each fund. The returns are across three time periods and equity investors would do well to first look at five- and 10-year performances and then look at the three-year return to see if the fund is still ahead. Value Research rating gives an indication of the risk-adjusted return. The expense ratio tells you how much of your money you lose to charges each year. Finally, our take on each fund. 3-year 5-year 10-year Value Research Expense Scheme Fund size NAV return return return rating ratio Our view (R cr) R % Equity large-cap % DSP BlackRock - Top 100 Equity 3,683.75 112.87 9.40 6.87 NA 1.98 Consistent long-term returns. Increased cash holdings in mid-2012 that hurt the fund briefly. An aggressively managed fund. Franklin Templeton - Franklin India Bluechip 5,230.25 243.51 10.71 7.52 26.68 2.15 Exposure to private banks worked well last year. Remains focused on quality companies. Franklin Templeton - Franklin India Index NSE Nifty 301.25 47.79 7.74 2.78 19.59 1.06 Passively managed fund linked to Nifty 50. Works well if you want exposure to bluechip stocks but no fund manager risk. Goldman Sachs - Nifty ETS 1,2 518.49 615.95 8.07 2.98 19.42 0.51 A passively managed fund linked to the Nifty 50 index at AUM of around R540 crore. One of the largest Nifty linked ETFs. ICICI Prudential - Focused Bluechip Equity Regular 4,365.87 19.01 13.04 NA NA 1.82 Performance dipped in January’12 because of conservative positions, initially. Its size and number of stocks has gone up. Kotak - Sensex ETF 6.30 208.77 8.27 NA NA 0.50 An ETF linked to the Sensex; has exposure to bluechips. Suitable for entering the stock market without fund manager risk. SBI - Magnum Equity 2 1,069.47 29.27 10.75 4.72 25.42 2.22 For sectoral allocation, it actively tracks its benchmark. Exposure to sectors like financials and materials helped the fund. Category average 7.12 2.81 19.09 BSE 100 index 6.77 1.62 20.72 Equity large- and mid-cap CORE Birla Sun Life - Frontline Equity 3,020.37 101.84 10.29 7.53 26.02 1.86 Takes 10-20% exposure to mid-cap scrips, but went up last year. A high exposure to mid-cap companies hurt the fund momentarily. Franklin Templeton - Franklin India Prima Plus 2,142.42 257.00 11.40 6.53 27.23 2.24 Performance hurt due to zero exposure to consumer non-durables sector. But holdings in private banks were a positive. HDFC - Equity 11,497.84 300.63 11.15 9.23 29.58 1.78 Consistent portfolio and returns. Increase in size has led to large number of holdings because of exposure to mid-cap firms. HDFC - Top 200 12,394.99 232.71 10.89 8.89 29.84 1.78 Largest equity fund with a consistent portfolio. Despite top holdings common with HDFC Equity, scheme retains individuality. ICICI Prudential - Dynamic Regular 3,961.06 120.35 10.31 7.89 27.11 1.82 Reduced exposure to the banking sector and holdings in the energy sector and firms like Bharti Airtel hurt the scheme. Mirae Asset - India Opportunities Regular 288.42 19.06 12.61 NA NA 2.40 Has a short history, comparitively, but a consistent performer. Top holdings are in large-sized companies. Quantum - Long Term Equity 150.64 25.99 13.32 11.38 NA 1.25 To retain liquidity, the fund picks stocks with an average trading volume of at least R5 crore a day over one-year period. UTI - Equity 2 2,367.47 56.04 11.07 8.30 23.96 1.90 Relative performance suffered for some quarters. Concentrated positions have helped with 40% portfolio in top 10 stocks. SATELLITE UTI - Dividend Yield 3,659.73 34.98 10.29 9.60 NA 1.83 Nearly 80% is in high dividend yield stocks. Exposure in cement, state-run banks and media worked well. Category average 7.43 2.71 20.42 BSE 200 index 6.36 1.42 20.47 Equity multi-cap CORE DSP BlackRock - Equity 2 2,660.40 50.42 8.26 6.67 29.77 2.00 Invests in large- and mid- cap scrips. Of late, consistency disrupted due to a conservative portfolio, but a good long-term pick. Franklin Templeton - Templeton India Growth 2 696.98 51.33 7.44 7.17 25.74 2.53 Very concentrated portfolio, but focus on values stocks have worked. Recent exposure to chemicals and financials has helped. Goldman Sachs - Nifty Junior BeES 2 92.94 123.70 7.74 2.69 NA 1.02 This ETF is meant for slightly aggressive equity investors who want exposure to the Nifty Junior index companies. IDBI - Nifty Junior Index 3 47.87 9.59 NA NA NA NR 1.50 For investors who want exposure to Nifty Junior index companies. Suits those who don't have a demat account. SATELLITE PineBridge - India Equity 158.27 13.29 6.34 2.35 NA 2.41 Lacks long-term track record, but singular focus on picking companies with long-term business potential gives us confidence. Reliance - Regular Savings Equity 2,973.52 33.71 7.66 4.44 NA 1.85 An aggressive fund; mid- and small-cap exposure up. Exposure to financial sector went up in 2012; this too helped the fund. Category average 7.51 2.99 24.53 BSE 200 index 6.36 1.42 20.47 Equity mid- and small-cap CORE DSP BlackRock - Small and Mid Cap Regular 1,340.03 19.56 10.78 7.25 NA 2.15 Large-cap scrips get churned actively, but mid-cap holdings are consistent. Holdings such as Pantaloons Retail has helped. IDFC - Premier Equity Plan A 3,396.71 39.50 14.21 10.28 NA 1.85 Follows a bottom-up strategy and doesn't churn much. Exposure to mid-cap scrips in consumer non-durables worked well. Religare - Mid Cap 55.07 17.30 14.51 4.31 NA 2.50 Has a bottom-up stock-picking strategy. Started to take exposures in infrastructure and capital goods sectors. SATELLITE DSP BlackRock - Micro Cap Regular 459.56 17.24 10.41 5.69 NA 2.47 Number of scrips with small holdings gone up because of lack of liquidity. Second-half of 2012 was rough on the fund. HDFC - Mid Cap Opportunities 2,756.00 18.57 15.46 9.59 NA 1.89 Focuses on top-quality mid-cap scrips. Well-diversified as the top 10 stocks accounts for less than 30% of the portfolio. ICICI Prudential - Discovery Regular 2,300.35 58.04 12.88 13.15 NA 1.90 Holdings in firms such as Amara Raja Batteries, Balkrishna Industries and Natco Pharma helped. Low exposure to FMCG. SBI - Emerging Businesses 1,163.35 60.10 22.96 6.28 NA 2.24 Had high cash balances at some points of the year, but the fund is an outperformer. Suits high-risk investors only. Category average 8.00 1.32 22.83 NSE CNX Midcap index 5.49 1.87 23.80 Equity tax planning Axis - Long Term Equity 369.05 14.75 13.94 NA NA 2.35 A new entrant. Focuses on stocks with good businesses and liquidity; the fund manager likes cash-generating companies. Religare - Tax Plan 134.23 20.05 11.30 6.35 NA 2.46 Exposure to the financial sector helped the fund. Consistent focus on quality stocks and low portfolio turnover ratio, works. Quantum - Tax Saving 9.19 25.45 12.41 NA NA 1.25 Quality and liquid holdings helped the fund. A ridiculously low expense ratio is a bonus for investors. Category average 7.51 1.83 21.90 BSE 200 index 6.36 1.42 20.47 Equity infrastructure SATELLITE PineBridge - Infrastructure and Economic Reform Standard 89.93 8.66 0.66 NA NA 2.47 Sector continued bad run, but our faith remains. A true-to-label scheme; uptake will happen once economy improves. Category average -2.84 -6.38 Hybrid equity-oriented CORE HDFC - Balanced 1,101.34 64.46 13.06 11.01 19.86 1.91 Compared with HDFC Prudence, more allocation to mid-caps, but lesser overall equity exposure. HDFC - Prudence 6,426.72 242.37 12.57 10.23 25.98 1.80 Same fund manager, Prashant Jain, for the past 20 years. Invests at least 30-40% in large-caps to protect against volatility. SATELLITE Birla Sun Life - 95 2 575.40 114.93 10.57 8.09 22.49 2.24 Equity exposure consistent at around 70%. Overweight on the financial sector helped performance. A consistent performer. DSP BlackRock - Balanced 649.36 72.22 7.95 6.89 21.56 2.31 Defensive portfolio in 2012 limited returns. The fund has, since, changed its portfolio to more interest rate-sensitive stocks. Category average 8.31 5.27 16.75 Crisil Balanced Fund Index 7.89 5.19 14.72 Hybrid asset allocation Franklin Templeton - FT India Dynamic PE Ratio FoF 4 1,280.75 46.70 8.90 8.21 NA NR 2.71 A fund of funds scheme, it decides its equity-debt split based on Nifty’s price-earnings multiple. Category average 4.00 3.18 12.98 Hybrid debt-oriented aggressive CORE HDFC - MIP Long Term 4,949.80 26.66 8.87 9.51 NA 1.55 Equity exposure up to 25% and is managed like that of HDFC Prudence, but lower exposure to mid- and small- sized firms. Category average 6.64 5.91 10.43 Hybrid debt-oriented conservative CORE Birla Sun Life - MIP 134.37 30.74 7.93 7.18 8.77 2.18 Exposure to G-secs has increased the portfolio's duration. Up to 15% goes into equities; debt is aggressively managed. Canara Robeco - MIP Regular Monthly 2 267.84 13.91 7.07 7.56 10.22 2.09 Invests up to 25% in equities, but mostly in large-caps. Overweight on banking, finance and industrial capital goods sectors. HDFC - MIP Short Term 254.37 19.70 7.09 7.11 NA 2.11 Equity exposure goes up to 15%. a conservative option for those who seek a monthly income. Reliance - MIP 3,351.18 25.50 8.59 11.55 NA 1.59 Equity exposure maintained at 20%. On fixed income, allocation shifted to money market securities at the cost of bonds. SATELLITE Birla Sun Life - MIP II Savings 5 293.76 20.93 8.56 10.66 NA 1.33 Equity exposure is maintained at around 10%. Added exposure to G-secs in the latter half of 2012. UTI - Monthly Income Scheme 320.09 22.85 7.55 8.14 8.18 1.80 Exposure to bonds has reduced and shifted to lower maturity money market securities. Financial sector exposure has helped. Category average 7.10 6.35 8.18 3-month 6-month 1-year Value Research Expense Scheme Fund size NAV return return return rating ratio Our view (R cr) R Debt short term % % CORE Canara Robeco - Short Term Regular 440.40 13.26 2.25 4.67 9.74 1.20 Conservative management has led to lower returns as fund manager focuses more on protecting downside. Franklin Templeton - Templeton India Short Term Income 5,923.00 2,322.83 2.29 5.14 10.33 1.44 Fund doesn't take active duration calls significantly. It focuses on corporate debt. Bottom up approach has worked well. PineBridge - India Short Term 648.90 1,444.93 2.24 4.64 10.13 0.89 Kept its average maturity lower than many peers in 2012. Invests in top-quality debt scrips. Low expense ratio bodes well. SATELLITE SBI - Short Term Debt Fund 2,603.10 13.31 2.35 5.23 10.57 0.63 Fund is currently running duration of around 2.1 years, close to its internally mandated upper limit. This helped performance. UTI - Short Term Income Regular 2,200.10 20.11 2.77 5.75 10.87 1.04 Increase in portfolio duration helped its performance in 2012. Focuses on corporate bonds; uses G-secs opportunistically. Category average 234.67 2.25 4.92 9.89 Net asset value (NAV) and returns as on 28 January; NAV and returns of Quantum Tax-Saving Fund are as on 30 January; corpus and total expense ratio are as per latest available; returns up to a year are absolute; more than a year are Schemes marked off with a red flag carry higher risk than the rest. Recommended for the high-risk, high-return investors, only compounded annualized; NA: not available as the fund has not completed the relevant time period; NR: not rated; 1this is an exchange-traded fund (ETF). Since ETFs are listed on stock exchanges, a demat account is necessary if you wish to buy or sell this scheme..; 2dividend plan is taken for this scheme as this is the plan that has completed the relevant tenor; 3since ETFs and index funds are mandated to mimic their benchmark indices and not beat or underperform them their Compiled by Kayezad E. Adajania and Lisa Pallavi Barbora past returns don't really make any difference; 4Value Research has not rated this scheme as this is the only scheme in the category. AUM: assets under management; FMCG: fast moving consumer goods; G-secs: government securities /graphic by Vivek Bhardwaj/Mint Data source