1. SOURCES
FUTURE PROJECTIONS
Investing with foresight: Regional wind gust parametrization for the wind energy
sectors of the UK and the Caribbean
Masaō I. Ashtine (mia35@cam.ac.uk), Dr. Michael Herzog, Dr. Hans Graf
Centre for Atmospheric Science, Department of Geography. University of Cambridge, CB3 0DG.
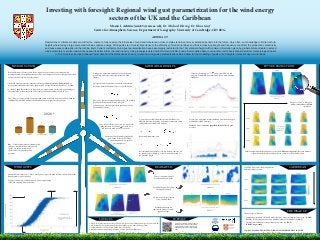
Resolutions of climate models are still far too coarse to fully capture the intricacies of wind and turbulence across complex terrains and over extended periods into the future. Very often, our knowledge is limited at hub-
heights where today’s large scale wind turbines capture energy. Wind gusts are of crucial importance to the efficiency of modern turbines and their increasing strength and frequency can affect the production of electricity
and cause severe disruption to the turbine itself. Current methods of wind gust parametrization have been largely restricted to the 10m standard height with minimal information given by global climate models to extend
wind parameters to vertical resolutions needed to better inform the wind industry. Using reanalysis data from ERA-Interim (ERA-I) and other modelled data, in conjunction with observational data from meteorological towers
(> 150 m) across Europe (Cabauw Tower data from the Netherlands shown), I examine wind gusts parametrizations which allow for the modelling of gusts at hub-heights of present day wind turbines.
ABSTRACT
For more contact information as well as
Masaō Ashtine’s research background,
please scan the adjacent code or visit:
http://www.geog.cam.ac.uk/people/phd.
html
SUPPORT
CARIBBEAN
INTRODUCTION METHODS & RESULTS
Renewable sources of energy have been a topic of debate for many years amongst more
developed and less developed nations, but their current importance bears more significance than
before in lieu of a rapidly changing climate.
»» In the UK alone, government scenarios call for approximately 30% of UK electricity to be
derived from renewable resources by 2020 (with an EU legally binding target of 15% by 2020).
»» As of 2015, the UK is at 14.1%. In capacity terms, onshore wind was the leading technology at
the end of 2013, accounting for 39.2% of capacity, followed by offshore wind (19.3%) 1
.
The UK has a set target of 30% of electrical demand to be sourced from renewables by 2020 but
individually, Scotland, Northern Ireland and Wales have proposed varying targets.
But ... Wind turbines have a maximum wind
tolerance, mechanical wear at high wind
speeds, cut-in and cut-out wind
speeds and are largely affected by
gustiness.
WIND GUSTS
2020
UK Scotland Northern Ireland Wales *
30
100
40 40
%
2
Sustained winds above 25 ms-1
have a much greater impact on wind turbines and can lead to shut
down periods as well as damage.
Highly variable winds also lead to ‘noisy’ power output owing
to the slow response times of turbines.
cut-in
cut-out
rated power
rated wind speed
Power curve from a Vesta 66 m
wind turbine with a rated power of
1.6 MW.
REANALYSIS
Using the relationship of Umax
- U and σU
from ERA-I, wind
gusts can be modelled from observed Cabauw wind with high
confidence.
Wind gusts within climate models are severely limited,
particularly with respect to heights relevant to wind
turbines.
Gust speed can be expressed as a function of turbulence
intensity within the boundary layer at a specific height:
where k is a constant of proportionality and σU
the standard
deviation of the horizontal mean wind speed.
Substituting Eq. 1 into the gust factor equation, gives the
normalized gust factor:
Thus, the gust factor can be seen as a ratio of the
difference between the max. gust speed (Umax
)
and the mean wind speed (U), to the σU
.
Expressing this relationship graphically
gives a good fit for all the Cabauw
tower heights with few outliers
present (Figure 2).
(1)
(2)
σU
is not often available from observations but Suomi et al.
modified equations describing it to produce estimation under
stable and unstable conditions whereby,
for unstable conditions, and
for stable conditions where k is the von Karman constant, h is
the boundary layer height, u*0
is the friction velocity and L is
the Obukhov length.
(3)
(4)
We can even study wind turbine shutdown times from reanalysis
modelled data (ERA-Interim).
Shutdown times can now be quantified historically with good
accuracy.
Figure 2. Maximum deviation of wind gusts from the mean wind speed as a function of the standard deviation of the 10-min wind
speed for each recording height of the Cabauw tower.
Figure 4. Deviation of ERA-I modelled gusts from parameterization of the std. of the wind speed (based on Sumoi et al.) with observed wind
gust data from the Cabauw Tower at 10 and 80 m. Overestimated (red) and underestimated (blue) gusts shown.
1. DECC. Renewable sources of energy: Chapter 6, Digest of United Kingdom energy statistics (DUKES).
2. UK Renewables Energy Roadmap, Department of Energy and Climate Change. 2013.
3. Wind turbine data retrieved from a wind farm in Germany.
4. Royal Netherlands Meteorological Insitute. Cabauw tower data (2001-2014).
3
University of
Cambridge
Department of
Geography
The final stages will involve:
• Completing results with UPSCALE model that has a finer resolution for future runs. (by MAY)
• Finishing results with gust forecasting from Met Office Unified Model. (by MAY)
• Tie loose ends with downscaling of future projections. (by JUNE)
• SUBMIT: August 2016
150 + PAGES ALREADY WRITTEN WITH THE FINISH LINE WELL IN SIGHT
4
We can see where gusts exceed
25 ms-1
and how likely
Gives us insight to seasonal
distribution of gust speeds
Even how the gusts have been
changing historically
Gusts over 25 ms-1
will happen
offshore every 3 days in 2100
instead of 8.
Turbine output from integrated power curves also will increase up to 30% in eastern offshore
regions where the largest wind farm (Hornsea Project) will be built by 2020.
Caribbean Sea presents the most potential
with little change to come.
THE WRAP UP
Trinidad and Tobago has
experienced mainly (-) trends
in power output
Seasonal trend in power output at 90m (kW-1
dec-1
)
Seasonal trend in daily max. gusts at 90m (ms-1
dec-1
)Seasonal mean daily max. gust speed at 90m (ms-1
)
Percent 6-hr gust exceedance at 90m
DJF JJA MAM SON DJF JJA MAM SON
> 25 ms-1
> 40 ms-1
> 50 ms-1
Dry Wet
Hurricane
2010-2039 2040-2069 2070-2100
Percent of gusts over 25 ms-1
at 105m
Seasonal mean daily
power poutput (MW)
2010-2039
2040-2069
2070-2100
DJF JJA MAM SON
Dry Wet
Hurricane
Umax
-Ū(ms-1
)
σu
ms-1
Maximumwindspeed(ms-1
)
2010-2039
2040-2069
2070-2100