Methods and technologies to improve efficiency of water use
fs20163037
1. Mapping Water Use—Landsat and
Water Resources in the United States
“A vision to
observe Earth
for the benefit
of all... ”
Interior Secretary
Stewart Udall, 1966
Water is one of our Nation’s most important natural resources,
a resource that has long been considered inexhaustible.
Yet changes in land use, climate, and population
demographics are placing unprecedented demands
on water supplies in the United States. As the
frequency of droughts increases and water
levels in aquifers and reservoirs decline,
people are wondering:
Is there enough water to meet all of our needs?
Landsat satellites are helping to answer
that question.
Water-Use Mapping
Using Landsat satellite data, scientists with the
U.S. Geological Survey (USGS) have helped to
refine a technique called evapotranspiration (ET)
mapping to measure how much water crops are
using across landscapes and through time. These
water-use maps are created using a computer
model that integrates Landsat and weather data.
Crucial to the process is the thermal (infrared)
band from Landsat. Using the Landsat thermal
band with its 100-meter resolution, water-use
maps can be created at a scale detailed enough
to show how much water crops are using at the
level of individual fields anywhere in the world.
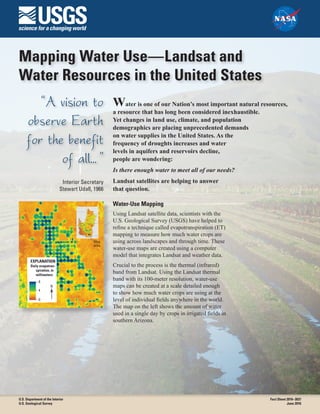
The map on the left shows the amount of water
used in a single day by crops in irrigated fields in
southern Arizona.
Map 01
Daily evapotran-
spiration, in
millimeters
EXPLANATION
8
4
0
N
Map
area
U.S. Department of the Interior
U.S. Geological Survey
Fact Sheet 2016–3037
June 2016
2. g 01
1990 seasonal evapotranspiration,
in millimeters
EXPLANATION
1,000
N
500
0 0 5 10 KILOMETERS
0 5 10 MILES
2014 seasonal evapotranspiration,
in millimeters
EXPLANATION
1,000
N
500
0 0 5 10 KILOMETERS
0 5 10 MILES
Figure 1. This pair of seasonal evapotranspiration (ET) maps (May–September) shows crop water use in the San Joaquin Valley, California,
in 1990 (left) and in 2014 (right). Comparing the maps reveals changes in irrigation patterns during this period. Notice, for example, that water
use intensified in many places (increase in blue areas) and some irrigated lands (green in 1990) transitioned out of agricultural production
(reddish brown) by 2014.
From Daily Glimpses to Long-Term Trends
Evapotranspiration (ET) maps can show how much water crops
are using in a single day or during an entire growing season.
Drawing on the vast Landsat satellite image archive, it is also
possible to create maps that span decades to reveal long-term
trends in water use (fig. 1). The Landsat archive—invaluable
to water-use mapping and so much more—might never have
become a reality without the visionary support given to Earth
observation from space by Interior Secretary Stewart Udall
during the 1960s.
How Water-Use Maps Help
U.S. Geological Survey scientists can map water use at
different scales to address different water resource questions
and concerns. Field-scale maps, for example, are powerful tools
for estimating and managing water consumption on irrigated
croplands. Field-scale maps can help answer questions such as
the following:
• Where is water being used, how much, and by whom?
• Which types of crops are using the most, or least, water?
• Can water be used more efficiently without impacting
crop yields?
Basin-scale water-use maps assist in understanding water
balance and availability in river basins and watersheds. Basin-
scale maps are large-area maps and are useful for the following:
• Estimating water use by different sectors within a watershed.
• Resolving disputes regarding water rights and allocations.
• Evaluating aquifer depletions and quantifying net
groundwater pumping.
Planning Today for Water Demand Tomorrow
According to a recent Government Accountability Office report
(GAO, 2014), 40 of 50 state water managers expect water
shortages in their states between now and 2023. Addressing
concerns about water resources in the United States begins
with a clearer understanding of water availability and water-use
trends. Mapping water use based on Landsat satellite data has
demonstrated immense potential at local and regional scales
(Senay and others, 2016), and could become the basis for
planning, monitoring, and assessing water use across the Nation.
References Cited
Senay, G.B., Friedrichs, M., Singh, R.K., and Velpuri, M.N.,
2016, Evaluating Landsat 8 evapotranspiration for water
use mapping in the Colorado River Basin. Remote Sensing
of Environment, in press, accessed May 19, 2016, at http://
dx.doi.org/10.1016/j.rse.2015.12.043.
U.S. Government Accountability Office, 2014, Freshwater—
Supply concerns continue, and uncertainties complicate
planning: Government Accountability Office (GAO),
Highlights of GAO-14-430, accessed May 16, 2016, at
http://www.gao.gov/products/GAO-14-430.
For additional information, contact:
Director
Earth Resources Observation and Science (EROS) Center
U.S. Geological Survey
47914 252nd Street
Sioux Falls, SD 57198
http://eros.usgs.gov
ISSN 2327-6932 (online)
http://dx.doi.org/10.3133/fs20163037