Basic Civil Engineering first year Notes- Chapter 4 Building.pptx
Research Method EMBA chapter 4
1. Chapter – 4 Notes Research Methods (KJAN) Summer Quarter 2016
1
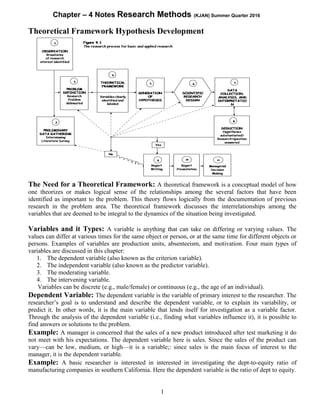
Theoretical Framework Hypothesis Development
The Need for a Theoretical Framework: A theoretical framework is a conceptual model of how
one theorizes or makes logical sense of the relationships among the several factors that have been
identified as important to the problem. This theory flows logically from the documentation of previous
research in the problem area. The theoretical framework discusses the interrelationships among the
variables that are deemed to be integral to the dynamics of the situation being investigated.
Variables and it Types: A variable is anything that can take on differing or varying values. The
values can differ at various times for the same object or person, or at the same time for different objects or
persons. Examples of variables are production units, absenteeism, and motivation. Four main types of
variables are discussed in this chapter:
1. The dependent variable (also known as the criterion variable).
2. The independent variable (also known as the predictor variable).
3. The moderating variable.
4. The intervening variable.
Variables can be discrete (e.g., male/female) or continuous (e.g., the age of an individual).
Dependent Variable: The dependent variable is the variable of primary interest to the researcher. The
researcher’s goal is to understand and describe the dependent variable, or to explain its variability, or
predict it. In other words, it is the main variable that lends itself for investigation as a variable factor.
Through the analysis of the dependent variable (i.e., finding what variables influence it), it is possible to
find answers or solutions to the problem.
Example: A manager is concerned that the sales of a new product introduced after test marketing it do
not meet with his expectations. The dependent variable here is sales. Since the sales of the product can
vary—can be low, medium, or high—it is a variable;: since sales is the main focus of interest to the
manager, it is the dependent variable.
Example: A basic researcher is interested in interested in investigating the dept-to-equity ratio of
manufacturing companies in southern California. Here the dependent variable is the ratio of dept to equity.
2. Chapter – 4 Notes Research Methods (KJAN) Summer Quarter 2016
2
Independent Variable: An independent variable is one that influences the dependent variable in
either a positive or negative way. That is, when the independent variable is present, the dependent variable
is also present, and with each unit of increase in the independent variable, there is an increase in the
dependent variable also. In other words, the variance the dependent variable is accounted for the
independent variable. Example: Research studies indicate that successful new product development has
an influence on the stock market price of the company. That is, the more successful the new product turns
out to be, the higher will be the stock market price of that firm. Therefore, the success of the new product
is the independent variable, and stock market price the dependent variable.
Diagram 5.1: Diagram of the relationship between the independent variable (New product success: and
the dependent variable (stock market price).
Diagram 5.2: Diagram of the relationship between the independent variable (managerial values) and the
dependent variable (power distance).
Diagram 5.3: Diagram of the relationship between the independent variable (availability of reference
manuals) and the dependent variable (rejects).
Moderating Variable: The moderating variable is one that has a strong contingent effect on the
independent variable—dependent variable relationship. That is, the presence of a third variable (the
moderating variable) modifies the original relationship between the independent and the dependent
variables. Diagram 5.3 B: Diagram of the relationship between the independent variable (availability of
reference materials) and the dependent variable (rejects) as modulated by the moderating variable (interest
and inclination)
Example: Organizational effectiveness is the dependent variable, which is positively influenced by
workforce diversity—the independent variable. However, to harness the potential, managers must know
how to encourage and coordinate the talents of the various groups to make things work. This managerial
expertise then becomes the moderating variable.
3. Chapter – 4 Notes Research Methods (KJAN) Summer Quarter 2016
3
Diagram 5.4: Diagram of the relationship among the three variables: workforce diversity, organizational
effectiveness, and managerial expertise.
The Distinction between an Independent Variable and a Moderating Variable: At times, confusion is
likely to arise as to when a variable is to be treated as an independent variable and when it would become
a moderating variable. For instance, there may be two situations as follows:
Situation 1: A research study indicates that the better the quality of the training programs in an
organization and the greater the growth needs of the employees (i.e. where the need to develop and grow
on the job is strong), the greater is their willingness to learn new ways of doing things.
Situation 2: Another research study indicates that the willingness of the employees to learn new ways of
doing things is not influenced by the quality of the training programs offered by the organizations to all
people without any distinction. Only those with high growth needs seem to have the yearning to learn to
do new things through specialized training.
Diagram 5.5 A: Illustration of the influence of independent variables on the dependent variable when no
moderating variable operates in the situation.
Intervening Variable: An intervening variable is one that surfaces between the time the independent
variables start operating to influence the dependent variable and the time their impact is felt on it. There is
thus a temporal quality or time dimension to the intervening variable. The intervening variable surfaces as
a function of the independent variable(s) operating in any situation, and helps to conceptualize and explain
the influence of the independent variable(s) on the dependent variable.
Diagram 5.5 B: Illustration of the influence of independent variables on the dependent variable when a
moderating variable is operating in the situation.
4. Chapter – 4 Notes Research Methods (KJAN) Summer Quarter 2016
4
Diagram 5.6: Diagram of the relationship among the independent, intervening, and dependent variable.
Example: In Example where the Independent variable workforce diversity influence the dependent
variable organizational effectiveness, the intervening variable that surfaces as a function of the diversity
in the workforce is creative synergy. This creative synergy results from a multiethnic, multiracial, and
multinational (i.e., diverse) workforce interacting and bringing together their multifaceted expertise in
problem solving. This helps us to understand how organizational effectiveness can result from having
diversity in the workforce. Note that creative synergy, the intervening variable, surfaces at time t2, as a
function of workforce diversity, which was in place at time t1, to bring about organizational effectiveness
in time t3. The intervening variable of creative synergy helps us to conceptualize and understand how
workforce diversity brings about organizational effectiveness.
It is now easy to see what the differences are among an independent variable, intervening variable, and a
moderating variable. The independent variable helps to explain the variance in the dependent variable;
the intervening variable surfaces at time t2 as a function of the independent variable, which also helps us
to conceptualize the relationship between the independent and dependent variables; and the moderating
variable has a contingent effect on the relationship between two variables. To put it differently, while the
independent variable explains the variance in the dependent variable, the intervening variable does not add
to the variance already explained by the independent variable, whereas the moderating variable has an
interaction effect with the independent variable in explaining the variance. That is, unless the moderating
variable is present, the theorized relationship between the other two variable considered will not hold.
Diagram 5.7: Diagram of the relationship among the independent intervening, moderating, and dependent
variables.
Whether a variable is an independent variable, a dependent variable, an intervening variable, or a
moderating variable should be determined by a careful reading of the dynamics operating in any given
situation. For instance, a variable such as motivation to work could be a dependent variable, an
independent variable, an intervening variable, or a moderating variable, depending on the theoretical
model that is being advanced.
Theoretical Framework: The theoretical framework is the foundation on which the entire research
project is based. It is a logically developed, described, and elaborated network of associations among the
variables deemed relevant to the problem situation and identified through such processes as interviews,
observations, and literature survey. Experience and intuition also guide in developing the theoretical
framework. The relationship between the literature survey and the theoretical framework is that the former
provides a solid foundation for developing the latter. That is, the literature survey identifies the variables
that might be important, as determined by previous research findings. This, in addition to other logical
5. Chapter – 4 Notes Research Methods (KJAN) Summer Quarter 2016
5
connections that can be conceptualized, forms the basis for the theoretical model. The theoretical
framework elaborates the relationships among the variables, explains the theory underlying these
relations, and describes the nature and direction of the relationships.
The Components of the Theoretical Framework: There are five basic features that should be
incorporated in the theoretical framework.
1. The variables considered relevant to the study should be clearly identified and labeled in the
discussions.
2. The discussions should state how two or more variables are related to one another. This should be
done for the important relationships that are theorized to exist among the variables.
3. If the nature and direction of the relationships can be theorized on the basis of the findings of
previous research, then there should be an indication in the discussions as to whether the
relationships would be positive or negative.
4. There should be a clear explanation of why we would expect these relationships to exist. The
arguments could be drawn from the previous research findings.
5. A schematic diagram of the theoretical framework should be given so that the reader can see and
easily comprehend the theoretical relationships.
Example Delta Airlines: With airline deregulation, there were price wars among the various airlines
that cut costs in different ways. According to reports, Delta Airlines faced charges of air-safety violations
when there were several near collisions in midair, and one accident that resulted in 137 deaths in1987.
Four important factors that seem to have influenced these are poor communication among the cockpit
crew members themselves, poor coordination between ground staff and cockpit crew, minimal training
given to the cockpit crew, and management philosophy that encouraged a decentralized structure. It would
be nice to know if these factors did indeed contribute to the violations, and if so, to what extent.
Theoretical framework for Example: The dependent variable is safety violation, which is the
variable of primary interest in which the variance is attempted to be explained by the four independent
variables of (1) communication among crew members, (2) communication between ground control and the
cockpit crew, (3) training received by the cockpit crew, and (4) decentralization.
Diagram 5.8: Scheme diagram for the theoretical framework in Example 5.13.
6. Chapter – 4 Notes Research Methods (KJAN) Summer Quarter 2016
6
Note how five basic features of the theoretical framework have been incorporated in the example.
1. Identification and labeling of the dependent and independent variables have been done in the
theoretical framework.
2. The relationships among the variables were discussed, establishing that the four independent
variables are related to the dependent variable, and that the independent variable, decentralization,
is related to the other two independent variables, namely, communication among the cockpit
members and between ground control and the cockpit crew. The nature and direction of the
relationship of each independent variable with the dependent variable and the relationship of
decentralization to the two independent variables were clearly stated.
3. Why these relationships can be expected was explained through several logical statements, as for
example describing why decentralization, which worked before deregulation, would not now
work. More specifically, it was argued that:
a. lower levels of communication among cockpit crew would fail to alert the pilot to the
impending hazards;
b. poor coordination between ground control and cockpit crew would be detrimental because such
coordination is the very essence of safety;
c. encouragement of decentralization would only reinforce poorer communication and
coordination efforts;
d. Inadequate training of cockpit crew would fail to build survival skills.
4. The relationships among the variables have been schematically diagrammed (see Figure 5.8).
It would now be interesting to see if we can interject an intervening variable in the model. For example,
we may say that lack of adequate training makes the pilots nervous and diffident, and this in turn
explains they are not able to confidently handle situations in midair when many aircraft share the skies.
Nervousness and diffidence are a function of lack of training and help to explain why inadequate training
would result in air-safety hazard. This scenario can be depicted as in figure 5.9.
Diagram 5.9: Schematic diagram for the theoretical framework including the intervening variable.
Diagram 5.10: Schematic diagram for the theoretical framework including a moderating variable.
7. Chapter – 4 Notes Research Methods (KJAN) Summer Quarter 2016
7
Hypotheses Development: Definition of Hypothesis: A hypothesis can be defined as a
logically conjectured relationship between two or more variables expressed in the form of a testable
statement. Relationships are conjectured on the basis of the network of associations established in the
theoretical framework formulated for the research study. By testing the hypotheses and confirming the
conjectured relationships, it is expected that solutions can be found to correct the problem encountered.
Example: Several testable statements or hypotheses can be drawn from the theoretical framework
formulated in Example 5.13. One of them could be as follows: If the pilots are given adequate training to
handle midair crowded situations, air-safety violations will be reduced. The above is a testable statement.
By measuring the extent of training given to the various pilots and the number of safety violations
committed by them over a period of time, we can statically examine the relationship between these two
variables to see if there is a significant negative correlation between the two. If we do find this to be the
case, then the hypotheses is substantiated.
Statement of Hypotheses: Formats: If—Then Statements: To examine whether or not the
conjectured relationships or differences exist, these hypotheses can be set either as propositions or in the
form of if—then statements. The two formats can be seen in the following two examples.
Example: Employees who are healthier will take sick leave less frequently.
Example: If employees are healthier, then they will take sick leave less frequently.
Directional and Non-directional Hypotheses: If, in stating the relationship between two
variables or comparing two groups, terms such as positive, negative, more than, less than, and the like are
used, then these hypotheses are directional because the direction of the relationship between the variables
(positive/negative) is indicated, as in Example 5.7 below, or the nature of the difference between two
groups on a variable (more than/less than) is postulated, as in example 5.18.
Example 5.17 The greater the stress experienced in the job, the lower the job satisfaction of employees.
Example 5.18: Women are more motivated than men. : On the other hand, non-directional
hypotheses are those that do postulate a relationship or difference, but offer no indication of the direction
of these relationships or differences. In other words, though it may be conjectured that there would be a
significant relationship between two variables, we may not be able to say whether the relationship would
be positive or negative. : Example 5.19: There is a relationship between age and job satisfaction.
Example 5.20: There is a difference between the work ethic values of American and Asian employees.
Non-directional hypotheses are formulated either because the relationships or differences have never been
previously explores and hence there is no basis for indicating the direction, or because there have been
conflicting findings in previous research studies on the variables.
Null and Alternate Hypotheses: The null hypotheses is a proposition that states a definitive, exact
relationship between two variables. That is, it states that the population correlation between two variables
is equal to zero or that the difference in the means of two groups in the population is equal to zero (or
some definite number). In general, the null statement is expressed as no (significant) relationship between
two variables or no (significant) difference between two groups, as we will see in the various examples in
this chapter. The alternate hypothesis, which is the opposite of the null, is a statement expressing a
relationship between two variables or indicating differences between groups. What we imply through the
null hypothesis is that any differences found between two sample groups or any relationship found
between two variables based on our sample is simply due to random sampling fluctuations and not due to
8. Chapter – 4 Notes Research Methods (KJAN) Summer Quarter 2016
8
any “true” differences between the two population groups (say, men and women), or relationship between
two variables (say, sales and profits). The null hypothesis is thus formulated so that it can be tested for
possible rejection. If we reject the null hypothesis, then all permissible alternative hypotheses relating to
the particular relationship tested could be supported. The null hypothesis in respect of group differences
stated in our Example 5.18 would be: H0: 𝜇M = 𝜇W Or H0: 𝜇M - 𝜇W = 0
Where H0 represents the null hypothesis, 𝜇M is the mean motivational level of the men, and 𝜇W is the
mean motivational level of the women. The alternate for the above example would statistically be set as
follows: HA: 𝜇M < 𝜇W which is the same as HA: 𝜇W > 𝜇M Where HA represents the alternate
hypothesis and 𝜇M and 𝜇W are the mean motivation levels of men and women, respectively.
For the non-directional hypothesis of the mean group differences in work ethic values in Example 5.20,
the null hypothesis would be: H0: 𝜇AM = 𝜇AS Or H0: 𝜇AM - 𝜇AS = 0 Where H0 represents the null
hypothesis, 𝜇AM is the mean work ethic value of Americans and 𝜇AS is the mean work ethic value of
Asians. The alternate hypothesis for the above example would statistically be set as: HA: 𝜇AM 𝜇AS
Where HA represents the alternate hypothesis and 𝜇AM and 𝜇AS are the mean work ethic values of
Americans and Asians, respectively. The null hypothesis for the relationship between the two variables in
Example 5.17 would be: H0: There is no relationship between stress experienced on the job and the job
satisfaction of employees. This would be statistically expressed by H0: 𝜌 = 0
where 𝜌 represents the correlation between stress and job satisfaction, which in this case is equal to 0 (i.e.,
no correlation). The alternate hypotheses for the above null, which has been expressed directionally in
Example 5.17, can be statistically expressed as HA: 𝜌 < 0 (The correlation is negative.)
For Example 5.19, which has been stated non-directionally, while the null hypothesis would be
statistically expresses as: H0: 𝜌 = 0 and the alternate hypothesis would be expressed as: H0: 𝜌 0
Steps in Hypothesis Testing:
1. State the null and the alternate hypotheses.
2. Choose the appropriate statistical test depending on whether the data collected are parametric or
nonparametric (discussed in a later chapter).
3. Determine the level of significance desired (p= 05, or more, or less).
4. See if the output results from computer analysis indicate that the significance level is met. If, as in
the case of Pearson correlation analysis in Excel software, the significance level is not indicated in
the printout, look up the critical values that define the regions of acceptance on the appropriate
table [(t, F, χ2
)—see tables at the end of the book]. This critical value demarcates the region of
rejection from that of acceptance of the null hypothesis.
5. When the resultant value is larger than the critical value, the null hypothesis is rejected, and the
alternate accepted. If the calculated value is less than the critical value, the null is accepted and the
alternate rejected.