SlideShare a Scribd company logo
1 of 35
McKinsey & Company 1
Five emerging consumer themes in October 2021
1 2 5
4
3
Slow recovery
expected
Only 14% of consumers
in Japan expect a
rebound within two to
three months
Spending intent has
increased since
February 2021; intent to
splurge remains flat,
with majorities planning
to spend the same
Omnichannel is
ascendant
Most consumers
research/purchase
product categories in an
omnichannel way
Few consumers report
recent use of digital
services or alternatives
to in-store shopping;
those consumers are
using them more often
Subdued holiday
planning
More than half of
consumers report
neutral sentiment for
the holidays and 70%
plan to spend about the
same amount as last
year.
A modified return
to out-of-home
Out-of-home activities,
especially working
outside the home and
shopping for
necessities, rebound
modestly with modified
behavior
Home-related
investments remain
small and flat since
February 2021
Consumers divided
on loyalty
Over half (54%) of
consumers facing a
stockout report either
not making a purchase
or waiting for stock at
the same retailer
One in ten say they’ve
tried a new retailer, and
only 9% a new brand in
the past three months
McKinsey & Company 2
Confidence in own country’s economic recovery after COVID-191
% of respondents
15 14 13 17 17 22
22 32
41
49 52
50 50
46
74
67
44
37 35 33 33 32
5
India China
1
21
65
14
Mixed: The economy will be
impacted for 6–12 months or
longer and will stagnate or show
slow growth thereafter
Pessimistic: COVID-19 will
have lasting impact on the
economy and show regression
or fall into lengthy recession
Optimistic: The economy will
rebound within 2–3 months and
grow just as strong as or
stronger than before COVID-19
Japan’s consumers continue to be the least optimistic among
researched countries
1. Q: What is your overall confidence level surrounding economic conditions after the coronavirus (COVID-19) crisis subsides (ie, once there is herd immunity)? Rated from 1 “very optimistic” to 6 “very pessimistic.” Bars may not sum to
100% due to rounding.
Slow recovery expected| Current as of October 2021
Germany
10/15–22
UK
10/15–22
US
10/9–15
India
10/18–25
China
10/17–22
Italy
10/15–22
Spain
10/15–22
France
10/15–22
Change in optimistic vs
Feb survey, percentage points
2 3 6 3 13 18 3
Source: McKinsey & Company COVID-19 Consumer Pulse Survey
16 14
Japan
10/18–10/20
McKinsey & Company 3
41
46
42
35 31 33
21 21
53
49 53
60
62 60
67 65
6 5 5 5 7 7 12 14
June 2020
Apr 20202
Mar 20202 May 2020 Sept 2020 Nov 2020 Oct 2021
Feb 2021
Slow recovery expected| Current as of October 2021
1. Q: What is your overall confidence level surrounding economic conditions after the coronavirus (COVID-19) crisis subsides (ie, once there is herd immunity)? Rated from 1 “very optimistic” to 6 “very pessimistic.” Figures may not sum to
100% because of rounding.
2. Average of weekly pulse surveys shown for Mar–April 2020.
Optimistic: The
economy will rebound
within 2–3 months and
grow just as strong as or
stronger than before
COVID-19
Mixed: The economy will
be impacted for 6–12
months or longer and will
stagnate or show slow
growth thereafter
Pessimistic: COVID-19
will have lasting impact
on the economy and
show regression or fall
into lengthy recession
Source: McKinsey & Company COVID-19 Japan Consumer Pulse Survey, 10/18–10/20/2021, n = 1,014; 2/24–2/27/2021, n = 1,014; 11/9–11/15/2020, n = 1,039; 9/22–9/28/2020, n = 1,034; 6/19–6/22/2020,
n = 664; 5/22–5/24/2020, n = 600; 4/17–4/19/2020, n = 600; 4/10–4/12/2020, n = 600;4/3–4/5/2020, n = 600;3/28–3/29/2020, n = 600, sampled and weighted to match Japan general population 18+ years
Confidence in Japan’s economic recovery has held steady since
February 2021
Confidence in own country’s economic recovery after COVID-19,1 % of respondents
McKinsey & Company 4
Lower-income consumers are less optimistic than higher-income
groups
Slow recovery expected| Current as of October 2021
5
8
9
8
16
9 8
17
18
10
0
5
25
20
45
15
30
35
40
50
55
Feb 2021
14
Sept 2020
7
5
Nov 2020 Oct 2021
Low (<4M yen) Medium (4M–8M yen) High (>8M yen)
35 36
24
26
28
17
27
31
16
18
20
0
30
5
10
25
15
35
40
50
45
55
Oct 2021
20
Sept 2020
31
Nov 2020 Feb 2021
1. Q: What is your overall confidence level surrounding economic conditions after the coronavirus (COVID-19) crisis subsides (ie, once there is herd immunity)? Rated from 1 “very optimistic” to 6 “very pessimistic.”
Optimism by income Pessimism by income
Source: McKinsey & Company COVID-19 Japan Consumer Pulse Survey, 10/18–10/20/2021, n = 1,014; 2/24–2/27/2021, n = 1,014; 11/9–11/15/2020, n = 1,039; 9/22–9/28/2020, n = 1,034, sampled and
weighted to match Japan general population 18+ years
Confidence in own country’s economic recovery after
COVID-19 by income level,1 % of respondents
McKinsey & Company 5
Pessimism about Japanese economic recovery varies by generation
but is not affected by vaccination status
Slow recovery expected| Current as of October 2021
Confidence in own country’s economic recovery after COVID-191
% of respondents
20 24
66
63
14 13
Vaccinated Unvaccinated
1. Q: What is your overall confidence level surrounding economic conditions after the coronavirus (COVID-19) crisis subsides (ie, once there is herd immunity)? Rated from 1 “very optimistic” to 6 “very pessimistic.”
2. Baby boomers includes silent generation.
16
26 26
13
70
59 63
72
14 15 11 15
Gen Z Millennials Gen X Baby boomers2
Optimistic Mixed Pessimistic
Source: McKinsey & Company COVID-19 Japan Consumer Pulse Survey, 10/18–10/20/2021, n = 1,014, sampled and weighted to match Japan general population 18+ years
By generation By vaccination status
McKinsey & Company 6
Slow recovery expected| Current as of October 2021
21
14
19 19
1
1
2 3
78
85
79 78
Baby boomers3
Gen Z Gen X
Millennials
16
29
2
71
82
Unvaccinated
Vaccinated
18
2
80
Overall
1. Q: When do you expect your routines will return to normal? Figures may not sum to 100% because of rounding.
2. Q: Which best describes your vaccination status?
3. Baby boomers includes silent generation.
Source: McKinsey & Company COVID-19 Japan Consumer Pulse Survey 10/18–10/20/2021, n=1,014; sampled and weighted to match Japan general population 18+ years
In or after 2022 In 2021 Not affected/already returned
By generation By vaccination status2
Expectations are
similar across the
generations,
although millennials
are somewhat more
likely to expect a
long wait for normal
routines
About 30% of
unvaccinated
consumers have
been unaffected or
are back to engaging
in normal routines
Overall, 80 percent of consumers say normal routines will return in
2022 or later
Expectations on routines returning to normal,1 % of respondents
McKinsey & Company 7
Perceived impact of COVID-19 on consumers’ income, spending,
and savings has been limited and improved slightly in October
Slow recovery expected| Current as of October 2021
26 26 24
72 71 73
2 3
Past 2 weeks Past 2 weeks
3
Past 2 weeks
65
Past 2 weeks
27
8
Past 2 weeks
65
24
11 9
68
23
Past 2 weeks
70
13
19
18
68
Past 2 weeks Past 2 weeks
19
63
12
18
Past 2 weeks
Source: McKinsey & Company COVID-19 Japan Consumer Pulse Survey, 10/18–10/20/2021, n = 1,014; 2/24–2/27/2021, n = 1,014; 11/9–11/15/2020, n = 1,039, sampled and weighted to match Japan
general population 18+ years
1. Q: How has the coronavirus (COVID-19) crisis affected the following over the past 2 weeks? Figures may not sum to 100% because of rounding.
Household income Household spending Household savings
Nov 2020 Feb 2021 Oct 2021
COVID-19 impact on household finances,1 % of respondents Reduce slightly/a lot Increase slightly/a lot
About the same
McKinsey & Company 8
Almost 40 percent of consumers expect their finances will return to
normal in 2022 or later
Slow recovery expected| Current as of October 2021
56 55 54
62
42 43 44
36
Gen Z Gen X
2
Baby boomers3
2
Millennials
2 2
57 59
41 40
2
Vaccinated
1
Unvaccinated
In 2021
In or after 2022 Not affected/already returned
57
41
2
Overall
1. Q: When do you expect your personal/household finances will return to normal? Figures may not sum to 100% because of rounding.
2. Q: Which best describes your vaccination status?
3. Baby boomers includes silent generation.
Source: McKinsey & Company COVID-19 Japan Consumer Pulse Survey, 10/18–10/20/2021, n = 1,014, sampled and weighted to match Japan general population 18+ years
By generation By vaccination status2
Baby boomers are
the most positive
about when their
finances will return
to normal
Expectations for
finances returning
to normal are
unrelated to
vaccination status
Expectations on personal/household finances
returning to normal,1 % of respondents
McKinsey & Company 9
Slow recovery expected| Current as of October 2021
Intent to splurge is greatest among higher-income Gen Z
consumers; intent for high-income Gen X has dropped 13 points
1. Q: With regard to products and services you will spend money on, do you plan to splurge/treat yourself in 2021? For example, are there categories of products or services you have spent less on over the last year and half which you feel you
will spend more on now?
2. Baby Boomers includes silent generation.
3. Small sample size (n < 25)
Source: McKinsey & Company COVID-19 Japan Consumer Pulse Survey, 10/18–10/20/2021, n = 1,014; 2/24–2/27/2021, n = 1,014, sampled and weighted to match Japan general population 18+ years
Feb 2021
73
72
28 27
Oct 2021
Plan on
splurging
Do not plan
on splurging
Millennials
Gen X
Baby boomers2
44%
4
26%3
−20
Gen Z 52%
−6
40%
11
32%
−4
34%
−1
16%
3
19%
2
28%
1
26%
9
27%
−3
20%
−13
Generation
2
Respondents who plan/do not plan to
splurge/treat themselves in 20211
% of respondents
Low
(<4M yen/year)
Middle
(4M–8M yen/year)
High
(>8M yen/year)
>70%
<30% 50–70%
30–50% p.p. change from Feb 2021
XX
Respondents who plan to splurge, by household income, %
Change < −10 pp
.
McKinsey & Company 10
Tourism is the biggest category driven by baby boomers; younger
generations want to splurge on fashion and cosmetics
Slow recovery expected| Current as of October 2021
Categories where consumers intend to treat themselves1
% of all respondents with intent to splurge
1. Q: You mentioned that you plan to splurge/treat yourself in next 6 months. Which categories do you intend to treat yourself to? Please select all that apply.
2. Baby boomers includes silent generation.
43
34
32
22
15
15
11
10
9
7
5
5
4
Personal services
Travel, lodging, and vacation
Electronics
Apparel, shoes, accessories
Items for your home
Restaurants, dining out, bars
Out-of-home entertainment
Makeup and skin care
Sports apparel and equipment
Outdoor living
Fitness, sports, and outdoors
Household essentials
Pets
Millennials Gen X
Gen Z
Baby
boomers2
24 37 45 60
49 42 28 24
19 35 25 43
30 34 15 9
14 15 19 12
16 13 15 16
11 15 9 9
8 16 8 7
11 12 9 4
By generation
5 12 5 3
5 9 3 3
11 8 1 1
8 8
Change from
Feb 2021,
percentage points
Source: McKinsey & Company COVID-19 Japan Consumer Pulse Survey, 10/18–10/20/2021, n = 1,014; 2/24–2/27/2021, n = 1,014, sampled and weighted to match Japan general population 18+ years
Between −3 and 3
< −3 >3
−6
−4
−7
N/A
9
−1
−7
N/A
N/A
N/A
−3
−2
N/A
Categories
Difference from all respondents,
percentage points
McKinsey & Company 11
Though still negative, net spending intent has increased for fashion
and self-care since February 2021
Slow recovery expected| Current as of October 2021
Net intent >1
Net intent −15 to 0
Net intent: < −15
Source: McKinsey & Company COVID-19 Japan Consumer Pulse Survey. 10/18–10/20/2021, n = 1,014; 2/24–2/27/2021, n = 1,014; sampled and weighted to match Japan general population 18+ years
12
12
13
19
31
15
19
34
23
11
7
11
14
12
6
8
16
11
8
15
7
12
7
7
11
6
Groceries
Quick-service restaurant
Restaurant
Alcohol
Tobacco products
Toys and baby supplies
10
4
Food takeout and delivery
3
Footwear
Apparel
2
Jewelry
4
Accessories
2
Household supplies
4
4
Personal-care products
Skin care and makeup
5
Home and furniture
10
Kitchen and dining
Sports and outdoors
Home improvement, garden
Decrease Stay the same Increase
6
9
11
25
6
16
12
16
12
15
55
32
52
33
35
6
23
6
7
16
6
12
16
8
16
16
18
20
16
12
Travel by car
Consumer electronics
Books, magazines, newspapers
Vehicles
Pet food and supplies 5
5
4
1
Vitamins and OTC medicine
Entertainment at home
Out-of-home entertainment
Pet-care services
Fitness and wellness
Personal-care services
Gasoline
10
Short-term home rentals
Cruises3
Adventures and tours
10
International flights
Hotel/resort stays
Domestic flights
Net
intent2
22
-3
-4
-9
0
-4
-8
0
4
1
-37
-12
-42
-17
1
-2
1. Q: Over the next 2–3 months, do you expect that you will spend more, about the same, or less money on these categories than usual? Figures may not sum to 100% because of rounding.
2. Net intent is calculated by subtracting the % of respondents stating they expect to decrease spending from the % of respondents stating they expect to increase spending.
3. Small sample size (n < 25) in Oct 2021 survey.
4. Small sample size (n < 25) in Feb 2021 survey.
Expected spending per category over the next 2–3 months vs usual1
% of respondents who bought these categories at least once since 2019
-3
-3
-10
0
+13
+27
+10
+14
+13
+13
+9
+3
0
+8
+3
+12
-6
+4
Change since
Feb 2021
percentage points
Change since
Feb 2021
percentage points
-1 -2
-1
+3
0
+6
+24
+17
+13
+13
+8
+7
+374
+8
+134
+45
+29
+37
-23 +32
Net
intent2
-32
6
1
5
-6
-4
4
-2
-11
-16
-12
-12
-19
0
0
-4
-1
0
McKinsey & Company 12
0
−40
10
−50
−30
−10
−20
20
Mar 2020 Apr 2020 May 2020 June 2020 Sept 2020 Nov 2020 Feb 2021 Oct 2021
Expected spending per category over the next 2–3 months vs usual1
Net intent2
Source: McKinsey & Company COVID-19 Japan Consumer Pulse Survey, 10/18–10/20/2021, n = 1,014; 2/24–2/27/2021, n = 1,014; 11/9–11/15/2020, n = 1,039; 9/22–9/28/2020, n = 1,034; 6/19–6/22/2020,
n = 664; 5/22–5/24/2020, n = 600; 4/17–4/19/2020, n = 600; 4/10–4/12/2020, n = 600;4/3–4/5/2020, n = 600;3/28–3/29/2020, n = 600, sampled and weighted to match Japan general population 18+ years
Increased spend intent expected across most categories over next
several months
Groceries
Skin care and makeup
Household supplies
Fitness and wellness
Consumer electronics
​Personal-care products
Apparel
1. Q: Over the next 2–3 months, do you expect that you will spend more, about the same, or less money on these categories than usual? Figures may not sum to 100% because of rounding.
2. Net intent is calculated by subtracting the % of respondents stating they expect to decrease spending from the % of respondents stating they expect to increase spending.
Slow recovery expected| Current as of October 2021
McKinsey & Company 13
1. Q: Which best described how you have researched the following categories over the last 3 months?
2. Q: Which best describes how you have purchased the following categories over the last 3 months?
24
2
Meal at quick-service restaurant
51
58
Alcoholic beverages
12
Books, magazines, and newspapers
2
44
Over-the-counter medicine
54
Food takeout/delivery
1
Household supplies
44 3
12
53
Tobacco products and smoking supplies
58
59
4
39
40
Groceries
59
4
57
Personal-care products
61
39
61
Footwear
Meal at restaurant
13
4
38
Home improvement, gardening supplies
37
23
31
Kitchen and dining
3
61
36
18
Pet food and supplies 27
51
61
27
Apparel
66
15
27
61
26
47
9
10
18
59
68
23
Home decoration and furniture
19
59
Skin care and makeup
Accessories
16
62
22
Sports and outdoors equipment, supplies
16
63
21
Consumer electronics
22
In store Omnichannel Online
In each product category, about 50 to 60 percent of consumers use
omnichannel to search for and purchase products
Omnichannel is ascendant | Current as of October 2021
Product searches1 and purchases2 by channel
% of respondents who purchased and searched these categories in the last 3 months
Source: McKinsey & Company COVID-19 Japan Consumer Pulse Survey, 10/18–10/20/2021, n = 1,014, sampled and weighted to match the Japan’s general population 18+ years
McKinsey & Company 14
In nine of 16 categories, more than one in five consumers, mainly
younger generations, say they were influenced by social media
Omnichannel is ascendant| Current as of October 2021
1. Q: Think about the purchases you have made in the following categories over the past 3 months. Were you influenced toward a certain brand by a post on social media in the following categories?
2. Baby boomers includes silent generation.
3. Small sample size (n < 25).
28
28
25
24
24
23
22
22
21
19
18
16
16
15
Books, magazines, and newspapers
Toys and baby supplies
Home improvement and gardening supplies
Skin care and makeup
Accessories
Meal at restaurant
Meal at quick-service restaurant
Sports and outdoors equipment, supplies
Food takeout/delivery
Apparel
Consumer electronics
Home decoration and furniture
Vitamins, supplements, and over-the-counter medicine
Alcoholic beverages
Millennials Gen X
Gen Z
Baby
boomers2
353 37 183 163
413 36 193 143
47 38 17 133
52 30 18 15
47 28 17 17
313 323 153 213
403 31 123 153
By generation
353 38 16 11
323 33 153 16
423 29 153 113
293 243 153 93
Source: McKinsey & Company COVID-19 Japan Consumer Pulse Survey, 10/18–10/20/2021, n = 1,014, sampled and weighted to match Japan general population 18+ years
Between −3 and 3
< −3 >3
Categories
Categories where respondents were influenced by social media1
% of all respondents who purchased in these categories in the last 3 months
133
263
203
303
163
18
73
133
14
173
18
113
Difference from all respondents,
percentage points
McKinsey & Company 15
44
59
3
52
62
25
58
31
6
7
61
35
40
7
40
0
66
3
31
56
2
38
53 44
6
8
39
36
54
7
48
32
42
10
61
58
39
61
0
3
0
52
3
49
11
36
73
71
21
39
17
Source: McKinsey & Company COVID-19 Japan Consumer Pulse Survey, 10/18–10/20/2021, n = 1,014, sampled and weighted to match Japan general population 18+ years
Consumers having used alternatives to normal in-store shopping
report using them as often or more frequently in the last three months
Omnichannel is ascendant | Current as of October 2021
Frequency of using/doing1
% shown among consumers who have participated in the activity in the last 3 months
Drive-thru line for a fast-food restaurant
Curbside pickup from a restaurant
Used a food delivery provider
Self-checkout or scan-and-go at a physical store
Buy online, pick up in store
Curbside delivery at a store
Purchased secondhand products online
Downloaded/used deal-finding plug-ins
Downloaded/used a new store/restaurant app
Purchased directly from social media
Used an app/website for same-day delivery
Used an app/website for delivery within 2 hours
Shopped at a store I had not shopped at before for groceries
Changed my primary grocery store
Cooked regularly for myself/my family
Personal care/grooming at home
Tried making something myself/DIY project
Using less Using more
Using same
14
5
12
35
10
5
12
3
10
4
3
3
7
6
38
14
5
Used or did in last 3 months
% of total respondents
1. Q: And have you used or done any of the following in the last 3 months? If yes, Q: Which best describes when you have done or used each of these items?
McKinsey & Company 16
Few consumers indicate recent use of most digital services, but
consumers who have used them report more frequently usage
Source: McKinsey & Company COVID-19 Japan Consumer Pulse Survey, 10/18–10/20/2021, n = 1,014, sampled and weighted to match Japan general population 18+ years
Omnichannel is ascendant | Current as of October 2021
46
62
59
6 35
37
0 80
3
20
50
4
73
29 67
4
30
63
34
3
55
57
43
2
2
78
72
21
0
1
26
2
56
44
0
43
0
1
47
3
53
30
25
67
67
45
53
2
Frequency of participating1
% shown among consumers who have participated in the activity in the last 3 months
Wellness app2
Online personal training/fitness
Grocery delivery
Restaurant food delivery
Meal kit delivery
Online streaming
Video conferencing for professional use
Virtual hangouts and video chats for personal use
Telemedicine for physical health care2
Telemedicine for mental health care2
Playing online games
Watching online games
Remote learning for myself
Remote learning for my kids
Used social media
Used TikTok
2
2
10
14
3
25
14
5
1
4
3
2
8
4
43
5
Used or did in last 3 months
% of total respondents
Using less Using same Using more
1. Q: Have you used or done any of the following since the coronavirus (COVID-19) crisis started? If yes, Q: Which best describes when you have done or used each of these items?
2. Small sample size (n < 25).
McKinsey & Company 17
When a product was unavailable, over 40 percent of consumers in
that situation did not buy anything
Divided loyalty | Current as of October 2021
1. Q: Over the last 3 months, have you wanted to buy something and not been able to purchase it because it was out of stock or otherwise not available?
2. Q: The most recent time this happened (when you wanted to buy something and it was not available), what did you do?
Source: McKinsey & Company COVID-19 Japan Consumer Pulse Survey, 10/18–10/20/2021, n = 1,014; sampled and weighted to match Japan general population 18+ years
78
22
Could not purchase
at least 1 item
Able to purchase
all items
Oct 2021
Respondents who planned to purchase
something but could not, due to unavailability1
% of respondents
29
12
5
11
43
Bought the product
at a different retailer
Did not buy anything
Bought a different brand or similar
product at a different retailer
Bought a different product
at the same retailer
Waited until the product was
available at the same retailer
Consumer responses to stockouts2
% of respondents who could not make a planned purchase
McKinsey & Company 18
27
11
9
8
7
7
Any new shopping behavior
Different retailer/store/website
Different brand
New shopping method2
New digital shopping method
Private label/store brand
Divided loyalty | Current as of October 2021
Source: McKinsey & Company COVID-19 Japan Consumer Pulse Survey, 10/18–10/20/2021, n = 1,014, sampled and weighted to match Japan general population 18+ years
Gen Z Millennials
49 37
16 17
24 13
22 12
11 9
19 14
By generation
All consumers
Between −3 and 3
< −3 >3
1. Q: Over the past 3 months, which of the following have you done? 73% replied “None of these.”
2. “New shopping method” includes curbside pickup and delivery apps.
3. Baby boomers includes silent generation.
Behaviors in past 3 months1
% of respondents
Less than one-third of Japanese consumers report having tried out
new shopping behaviors in the past three months
Difference from all respondents,
percentage points
Gen X Baby boomers3
20 19
7 10
5 5
7 3
5 4
4 2
McKinsey & Company 19
Reason for trying a new brand since COVID-19 began1
% of respondents who tried a new brand since COVID-19 began
Divided loyalty | Current as of October 2021
1. Q: You mentioned you tried a new/different brand than what you normally buy. What were the main reasons that drove this decision? Select up to 3 relevant reasons. “Brand” includes different brand, new
private label/store brand. Overarching reason based on % of individual respondents responding to at least 1 reason in the group.
2. Baby boomers includes silent generation.
Source: McKinsey & Company COVID-19 Japan Consumer Pulse Survey, 10/18–10/20/2021, n = 1,014, sampled and weighted to match Japan general population 18+ years
Better prices/promotions
Cleaner/has better hygiene measures
Better shipping/delivery cost
Better value
Is natural / organic
Larger package sizes
20
Wanted to try a type of product I’ve never tried before
Better quality
Wanted to try a new brand I found
Wanted variety/a change from my normal routine
27
Wanted to treat myself
3
Shares my values
16
The company treats its employees well
Is more sustainable/better for the environment
Supporting local businesses
20
Is available where I’m shopping
31
Products are in stock
25
12
8
9
24
4
3
1
13
6
6
Purpose-driven
Convenience
Quality/organic
Personal choice
Availability
Health/hygiene
Novelty 38
Value 43
37
32
30
6
6
13
Baby
boomers2
Gen Z and
millennials Gen X
21 24
32
10 20
8
8 4
12
0 4
8
33 28
16
12 36
20
29 40
28
13 4
4
19 4
36
25 12
0
25 36
8
6 0
4
2 0
8
0 4
0
8 12
24
4 4
12
10 4
0
All consumers
Between −3 and 3
< −3 >3
For the 9 percent of respondents who tried a new brand, value and
novelty seem to be the key drivers
x Net % of respondents per category
Difference from all respondents,
percentage points
McKinsey & Company 20
Modified return to out-of-home | Current as of October 2021
24
15
29
27
19
Jun 2020
Oct 2021
Feb 2021
Nov 2020
Sep 2020
Overall
Vaccinated Unvaccinated
23%
28%
Gen Z Millennials Gen X
19%
Baby boomers
34%
26% 25%
24%
Low
(<4M yen)
22%
High
(>8M yen)
Medium
(4M–8M yen)
28%
1. Q: Which best describes when you will regularly return to stores, restaurants, and other out-of-home activities? Chart shows those already participating in these activities.
2. Gen Z are people under 25 years old, millennials are 25–44 years old, Gen X are 45–54 years old, and baby boomers are 55 years old and above, including silent generation.
Source: McKinsey & Company COVID-19 Japan Consumer Pulse Survey, 10/18–10/20/2021, n = 1,014; 2/24–2/27/2021, n = 1,014; 11/9–11/15/2020, n = 1,039; 9/22–9/28/2020, n = 1,034; 6/19–6/22/2020,
n = 664, sampled and weighted to match Japan general population 18+ years
By
generation2
By
vaccination
adoption
By income
34%
of Gen Z are doing out-
of-home activities
28%
of higher income
households are doing
out-of-home activities
28%
of people that are
unvaccinated are doing
out-of-home activities
Consumers engaging in ‘normal’ out-of-home activities,1 % of respondents
About one-fourth of consumers, including one-third of Gen Z
consumers, say they have returned to normal out-of-home activities
McKinsey & Company 21
Out-of-home activities done in the past 2 weeks1
% shown for respondents who engaged in the activity at least once prior to COVID-19
Modified return to out-of-home | Current as of October 2021
Source: McKinsey & Company COVID-19 Japan Consumer Pulse Survey, 10/18–10/20/2021, n = 1,014, sampled and weighted to match Japan general population 18+ years
1. Q: Did you leave your house for the following activities over the past 2 weeks?
Social
Personal
care
Entertain-
ment 53
15
10
11
18
35
48
20
21
Get together with family
Attend an indoor cultural event
Dine indoors at a restaurant or bar
Go out for family entertainment
Go to a hair or nail salon
Attend an outdoor event
Go to the gym or fitness studio
Visit a crowded outdoor public place
Get together with friends
86
93
71
46
28
56
28
10
49
13
44
Go to a shopping mall
Work outside my home
Shop for groceries/necessities
Shop for non-necessities
Travel by airplane
Use a ride-sharing service
Travel more than 2 hours by car
Use public transportation
Travel by train
Stay in a hotel
Rent a short-term home
Work
Shopping
Transport/
travel
≥50%
<50%
A high percentage of consumers now work outside of home; more
than half of consumers shop, eat out, and use public transportation
McKinsey & Company 22
1. Q: With the rise of the Delta variant of COVID-19, how, if at all, has your out-of-home behavior changed?
Source: McKinsey & Company COVID-19 Japan Consumer Pulse Survey, 10/18–10/20/2021, n = 1,014, sampled and weighted to match Japan general population 18+ years
20
18 14
28
29
29
49 52 55
Medium
(4M–8M yen)
Low
(<4M yen)
3 1 2
High
(>8M yen)
Modified return to out-of-home | Current as of October 2021
16
21
29
28
53 48
3
2
Vaccinated Unvaccinated
17
29
52
Engage less
Engage more
Overall
2
Engage with
adjusted behavior
Engage same as
before Delta
By income By vaccination status
Lower-income
consumers are the
likeliest income group
to indicate they
engage the same as
or more than before
Delta
Vaccinated consumers
are likelier than
unvaccinated to report
adjusting their
behavior
Adjustments to out-of-home behavior due to prevalence of Delta variant,1 % of respondents
About half of consumers reduced engagement in out-of-home
activities due to the Delta variant; 30 percent engage differently
McKinsey & Company 23
Modified return to out-of-home | Current as of October 2021
Source: McKinsey & Company COVID-19 Japan Consumer Pulse Survey, 10/18–10/20/2021, n = 1,014, sampled and weighted to match Japan general population 18+ years
1. Q: Which best describes how you are engaging in each of these activities? Possible answers: “Not doing this at all”; “Doing this in the same way as pre-COVID-19, but less often”; “Doing this in a modified way vs. pre-COVID-19”;
“Doing this just as much and in the same way as I did pre-COVID-19.”
Work
Shopping
Transport/
travel
Social
Personal
care
Entertain-
ment
65
30 70
Dine indoors at a restaurant or bar
35
Go out for family entertainment
34 66
Attend an indoor cultural event
57
43
Attend an outdoor event
70
49
Visit a crowded outdoor public place 68
32
51
Go to a hair or nail salon
36
30
64
Go to the gym or fitness studio
69
31
Get together with family
Get together with friends
64
47
81
Work outside my home
36
Shop for groceries/necessities
53
42
Shop for non-necessities
41
46
68
34
33
Go to a shopping mall
66
19
Rent a short-term home
54
Use public transportation
58
41
59
Use a ride-sharing service
Travel by airplane
57
43
Travel by train
63
37
Stay in a hotel
59
Travel more than 2 hours by car
Doing less, doing in a modified way
Doing as much as and in the same way as pre-COVID-19
Japanese consumers are likeliest to have modified out-of-home
behavior for work and fitness; social activities are priorities
Out-of-home activities engagement1
% of respondents engaging in these activities today
McKinsey & Company 24
Main life events done in the last 12 months as a result of COVID,1 % of respondents
Modified return to out-of-home | Current as of October 2021
Source: McKinsey & Company COVID-19 Japan Consumer Pulse Survey 10/18–10/20/2021, n=1,014; 2/24–2/27/2021, n = 1,014; sampled and weighted to match Japan general population 18+ years
Change >3 pp
10
4
2
3
2
2
2
2
1
2
1
Worked more from home
Got a new pet at home (eg, dog, cat)
Moved into a smaller home
Decided to change jobs
Renovated/remodeled my home
Started homeschooling children
Set up a specific work-from-home space
Set up a gym at home
Moved into a bigger home
Bought a property
Sold a property
Work/study
change
Oct 2021
Pet adoption
House move
Home
renovation
Investments/
divestments
Total2
Change from
Feb 2021,
percentage points
0
−1
0
0
0
1
0
0
−2
1
1
2
14
3
6
2
1. Q: Which of the following have you done in the last 12 months as a result of the COVID-19 crisis?
2. Total percentage of people who choose option(s) in the category.
Few consumers made major changes to their living environment
due to COVID-19
McKinsey & Company 25
Over half of consumers are neutral toward the 2021 holiday
shopping season; Gen Z are more excited, millennials more anxious
Holiday Outlook | Current as of October 2021
23
37
30 29
48
47 58 65
29
16 12
6
Baby
boomers2
Gen Z Millennials Gen X
Source: McKinsey & Company COVID-19 Japan Consumer Pulse Survey, 10/18–10/20/2021, n = 1,014, sampled and weighted to match Japan general population 18+ years
1. Q: Which best describes your general attitude toward the holiday shopping season? Selected from "Anxious," "Stressed," "Neutral," "Eager,“ "Excited," and "Other."
2. Baby boomers includes silent generation.
31
57
12
Stressed/
anxious
Overall
Excited/
eager
Neutral
Consumer attitudes toward the 2021 holiday shopping season1
% of respondents
By annual income By generation
33 28 31
55 60 55
12 12 14
Low
(<4M yen)
Medium
(4M–8M yen)
High
(>8M yen)
McKinsey & Company 26
Majority of consumers plan to spend about the same as last year
across categories during 2021 holidays
Holiday Outlook | Current as of October 2021
15
Gifts (for
myself and
others)
20
65
Large
household
appliances
3
6
Personal
travel2
26
Out-of-
home eating
60
17
65
18
88
6
70
20
27
Redecorate my
home, put out
seasonal items
20
Family travel
4
70
Source: McKinsey & Company COVID-19 Japan Consumer Pulse Survey, 10/18–10/20/2021, n = 1,014, sampled and weighted to match Japan general population 18+ years
1. Q: If you compare the upcoming holidays 2021 with the ones last year, how much do you plan to change your spending level in the following categories?
2. Small sample size (n < 25).
Will spend more Will spend about the same Will spend less
2021 holiday spending plans vs spending in 20201
% of respondents who spent on the category during the holidays in 2020
Almost 90% of consumers do not
intend to change their gif- buying
behavior for the holidays this year
Home-related purchases see the
largest share of consumers
reporting they will spend less
McKinsey & Company 27
Half of consumers plan to browse in stores for the holiday season;
younger consumers over-index on using social media and websites
Holiday Outlook | Current as of October 2021
50
28
25
22
20
15
5
4
3
Browsing in stores
Browsing through holiday markets
Offline advertisements2
Social media
Retailer websites
Brand websites
Advertisements on TV or streaming media
Emails from relevant retailers
Browsing in pop-up stores
By generation
Gen Z
48
20
Millennials
51
25
Gen X
54
20
Baby
boomers3
46
8 7 2 1
7 3 5 5
26 12 15 16
19 17 25 40
17
46 38 21 15
4 5 5 1
24 30 23 16
Research channels
Between −3 and 3
< −3 >3
Difference from all respondents, percentage points
1. Q: Which channels are you planning to use to get new ideas and do research for your holiday shopping? Please select top 3.
2. Offline advertisements include catalogs, fliers, magazines, and newspaper advertisements.
3. Baby boomers includes silent generation.
Consumer research plans by channel for holiday 20211
% of all respondents
Source: McKinsey & Company COVID-19 Japan Consumer Pulse Survey, 10/18–10/20/2021, n = 1,014, sampled and weighted to match Japan general population 18+ years
McKinsey & Company 28
In all but the oldest generation, over half of consumers expect social
media to influence their purchase decisions
Holiday Outlook | Current as of October 2021
Source: McKinsey & Company COVID-19 Japan Consumer Pulse Survey, 10/18–10/20/2021, n = 1,014, sampled and weighted to match Japan general population 18+ years
1. Q: How much influence do you expect social media to have on your holiday purchase decisions this season? Selected from "Significant influence," "Some influence," and "Will not influence."
2. Q: Which channels do you think will influence your holiday purchase decisions? Asked of respondents indicating social media will influence their 2021 holiday purchases.
3. Baby boomers includes silent generation.
Expected influence of social media on 2021 holiday
purchases,1 % of respondents
44
28
37
47
52
56
72
63
53
48
Baby boomers3
Gen Z
Overall
Millennials
Gen X
Will not influence Will influence
52 48
63 5 16 2 0
56
46 47 13 5 4 2
23
47 27 19 2 3 0
8
32 14 13 0 1 0
33
43 32 14 4 2 1
Respondents who expect social-media influence2
% of respondents
YouTube Instagram Twitter Facebook TikTok Pinterest Snapchat
Top 3 platforms by %
McKinsey & Company 29
Three-quarters of Japanese consumers plan to avoid travel and
limit the size of social gatherings for the upcoming holiday
Holiday Outlook | Current as of October 2021
1. Q: What best describes what you expect to do for the holidays this year [2021]? Figures may not sum to 100% because of rounding.
2. Q: What best describes your holiday get togethers last year [2020]? Figures may not sum to 100% because of rounding.
3. Baby boomers includes silent generation.
Source: McKinsey & Company COVID-19 Japan Consumer Pulse Survey 10/18–10/20/2021, n = 1,014, sampled and weighted to match Japan general population 18+ years
4
9
11
76
Do not plan to travel and will limit getting
together to immediate family only
Will not travel but will have a family/friends
get-together outside my immediate family
Will travel to and attend a large get-
together with family and friends
Will travel to a limited family get-together
By annual income By generation
5 4 6
0 1 3 6 1
4 10 14 12 12 10
3 6
8 13 12 23 13 7
2 8
87 74 69 60 71 77
−5 85
Medium
(4M–8M
yen)
Low
(<4M yen)
High
(>8M yen) Millennials Gen X
Gen Z
Baby
boomers3
Change
from 2020,2
percentage
points
Holiday plans in 20211
% of respondents
< −3 Between −3 and 3 >3
Difference from all respondents, percentage points
McKinsey & Company 30
Consumers across all generations expect fewer in-person holiday-
related events than before COVID-19
Holiday Outlook | Current as of October 2021
1. Q: About how many in-person holiday-related events do you attend in a typical year without COVID-19?
2. Q: Compared with the number of in-person events you attended pre-COVID-19, about how many in-person events do you expect to attend over the holidays this coming year [2021]?
3. Baby boomers includes silent generation.
2.2
0.6
0.5
Family gatherings
Parties with friends
Work-related gatherings
Source: McKinsey & Company COVID-19 Japan Consumer Pulse Survey 10/18–10/20/2021, n = 1,014, sampled and weighted to match Japan general population 18+ years
Event type
Between −1 and 1
< −1 >1
Millennials Gen X
Gen Z
Baby
boomers3
By generation
1.9 2.3 2.4 2.1
1.5 1.0 0.5 0.3
0.7 0.7 0.8 0.2
Difference in
number vs
pre-COVID-19
−1.2
−1.4
−1.2
Holiday-related events consumers attended1 or expect to attend2 in 2021
Average number of events
Difference from all respondents, percentage points
McKinsey & Company 31
1. Q: Do you plan to shop for the holidays earlier or later in 2021 compared with last year’s holiday season [2020]? Possible answers: “significantly earlier”; “slightly
earlier”; “starting at about the same time”; “slightly later”; “significantly later”; “I am not planning to do any holiday season shopping.” 18% of Japanese consumers
indicated they do not plan to shop for the holidays. Figures may not sum to 100% because of rounding.
2. Income levels: low, <4 million yen; medium, 4 million–8 million yen; high, >8 million yen per year.
3. Baby boomers includes silent generation.
4. Q: What are the primary reasons you plan to shop earlier for the holidays in 2021?
5
78
17 16
Low
5
79
2
Medium
19
79
High
17
Overall
78
5
Earlier
Later
About the
same time
Source: McKinsey & Company COVID-19 Japan Consumer Pulse Survey, 10/18–10/20/2021, n = 1,014, sampled and weighted to match Japan general population 18+ years
Overall By income2 By generation
9
Gen Z
82
20
5
Gen X
71
27
5
68
Millennials
16
2
83
13
Baby
boomers3
Roughly 80 percent of consumers report no plans to change the
start of their holiday shopping
Holiday Outlook | Current as of October 2021
Main reasons for consumers
to start shopping earlier4
% of respondents who plan to shop
earlier in 2021
27%
21%
18%
52%
Holiday shopping start vs last year1
% of respondents who plan to shop for the holidays this year
of Japanese consumers
are concerned about
availability
are concerned about
shipping lead time
want to do something
fun right now
are concerned about
unexpected challenges
due to COVID-19
McKinsey & Company 32
Eighty percent of consumers indicate they will start holiday
shopping in December this year
Holiday Outlook | Current as of October 2021
Source: McKinsey & Company COVID-19 Japan Consumer Pulse Survey 10/18–10/20/2021, n = 1,014, sampled and weighted to match Japan general population 18+ years
4
14
80
2
In December
I already started
In November
In January
60%
25%
15%
75–100% of my shopping
50–74% of my shopping
1–49% of my shopping
1. Q: When do you plan to start your shopping for the seasonal holidays this year? Figures may not sum to 100% because of rounding.
2. Q: How much of your holiday season shopping have you done so far? Question asked of respondents who have indicated they already started. Small sample size (n < 25).
Timing of holiday shopping, 20211
% of respondents who plan to shop for the holidays this year
Status of holiday shopping, 20212
% of respondents having already started
McKinsey & Company 33
Just 14 percent of consumers plan to shop at a different place than
last year for the holidays; safety is their top reason to change
Holiday Outlook | Current as of October 2021
Source: McKinsey & Company COVID-19 Japan Consumer Pulse Survey 10/18–10/20/2021, n = 1,014, sampled and weighted to match Japan general population 18+ years
6
5
5
Safety
More value for money
Check more things
off my list at once
44
21
14
10
8
6
Shop earlier
Any change of shopping behavior
Shop more online
Shop more in person
Shop at a different place
Shop more at local/independent stores
1. Q: Please select all the ways you anticipate your holiday shopping might be different from last year. Figures may not sum to 100% because of rounding.
Anticipated different holiday shopping behaviors1
% of respondents who said they would shop differently than last year
Reasons to change place to shop during holiday
season
% of respondents who said they will do holiday shopping this year
McKinsey & Company 34
One-fifth of consumers plan to shop more online this year; intent is
greatest for younger and higher-income consumers
Holiday Outlook | Current as of October 2021
21
10
8
Shop more online
Shop more in person
Shop earlier
By income
Gen Z
Millen-
nials Gen X
Baby
boom-
ers2
Shopping behaviors
Between −3 and 3
< −3 >3
Difference from all respondents, percentage points
1. Q: Please select all the ways you anticipate your holiday shopping might be different compared to last year. Figures may not sum to 100% because of rounding.
2. Baby boomers includes silent generation.
Anticipated shopping behavior change for Holiday
20211, % of all respondents By generation
31 20
34 13
13 10 9 9
6 13 8 3
16 23 27
4 12 13
6 8 9
Medium
(4M–8M
yen)
Low
(<4M
yen)
High
(>8M
yen)
Source: McKinsey & Company COVID-19 Japan Consumer Pulse Survey 10/18–10/20/2021, n = 1,014, sampled and weighted to match Japan general population 18+ years
McKinsey & Company 35
Consumers say value and convenience are the top two
considerations driving their decisions of where to shop
Holiday Outlook | Current as of October 2021
Source: McKinsey & Company COVID-19 Japan Consumer Pulse Survey 10/18–10/20/2021, n = 1,014, sampled and weighted to match Japan general population 18+ years
37
26
34
19
39
26
8
5
16
7
3
5
Companies treating its employees well
Convenience
Better prices/promotions
Better shipping/delivery costs
Easy to shop across store and online
Offers unique items
Ability to purchase most gifts from 1 place
Ability to see products in person
Better quality
Product availability
Cleaner/better hygiene measures
Supporting local businesses
By generation
45
32
23
33
34
7
2
5
20
5
10
Gen Z
38
38
20
34
24
9
6
6
7
4
3
21
Millennials
31
37
30
32
20
11
3
5
16
4
5
22
Gen X
37
41
27
36
25
8
2
4
13
5
6
17
Baby
boomers2
17
1. Q: Please tell us what your primary considerations will be when deciding where to shop. Please select up to 3.
2. Baby boomers includes traditional or silent generation.
Between −3 and 3
< −3 >3
Primary considerations when deciding where to shop1
% of respondents
Availability
Value
Convenience
Quality
Purpose-driven
Uniqueness
Health/hygiene
48
52
x Net % of respondents per category
36
39
16
9
5
Difference from all respondents, percentage points

More Related Content

What's hot

#BainWebinar Commercial Aviation Outlook and Scenarios
#BainWebinar Commercial Aviation Outlook and Scenarios#BainWebinar Commercial Aviation Outlook and Scenarios
#BainWebinar Commercial Aviation Outlook and ScenariosBain & Company Brasil
 
Bain Covid 19 situation report & action agenda
Bain   Covid 19 situation report & action agendaBain   Covid 19 situation report & action agenda
Bain Covid 19 situation report & action agendaAnne LEHMAN
 
Colombia's Consumer Pulse Update - August 2020
Colombia's Consumer Pulse Update - August 2020Colombia's Consumer Pulse Update - August 2020
Colombia's Consumer Pulse Update - August 2020Bain & Company Brasil
 
McKinsey Survey: US consumer sentiment during the coronavirus crisis
McKinsey Survey: US consumer sentiment during the coronavirus crisisMcKinsey Survey: US consumer sentiment during the coronavirus crisis
McKinsey Survey: US consumer sentiment during the coronavirus crisisMcKinsey on Marketing & Sales
 
Insurance Customer Market Pulse Survey 2021
Insurance Customer Market Pulse Survey 2021Insurance Customer Market Pulse Survey 2021
Insurance Customer Market Pulse Survey 2021Accenture BeLux
 
Digital Europe: Pushing the frontier, capturing the benefits
Digital Europe: Pushing the frontier, capturing the benefitsDigital Europe: Pushing the frontier, capturing the benefits
Digital Europe: Pushing the frontier, capturing the benefitsMcKinsey & Company
 
Q4 2022 DBX Investor Presentation.pdf
Q4 2022 DBX Investor Presentation.pdfQ4 2022 DBX Investor Presentation.pdf
Q4 2022 DBX Investor Presentation.pdfDropbox
 
Argentina's Consumer Pulse Update - August 2020
Argentina's Consumer Pulse Update - August 2020Argentina's Consumer Pulse Update - August 2020
Argentina's Consumer Pulse Update - August 2020Bain & Company Brasil
 
2018 Local Dynamos: Emerging-Market Companies Up Their Game
2018 Local Dynamos: Emerging-Market Companies Up Their Game2018 Local Dynamos: Emerging-Market Companies Up Their Game
2018 Local Dynamos: Emerging-Market Companies Up Their GameBoston Consulting Group
 
The Great Mobility Tech Race: Winning the battle for future profits
The Great Mobility Tech Race: Winning the battle for future profitsThe Great Mobility Tech Race: Winning the battle for future profits
The Great Mobility Tech Race: Winning the battle for future profitsBoston Consulting Group
 
How Collaboration Advances Your Sustainability Efforts
How Collaboration Advances Your Sustainability EffortsHow Collaboration Advances Your Sustainability Efforts
How Collaboration Advances Your Sustainability EffortsBoston Consulting Group
 
Shattering the Glass Screen: Gender inequality in media and entertainment
 Shattering the Glass Screen: Gender inequality in media and entertainment Shattering the Glass Screen: Gender inequality in media and entertainment
Shattering the Glass Screen: Gender inequality in media and entertainmentMcKinsey & Company
 
Federal Technology Vision 2021: Full U.S. Federal Survey Findings | Accenture
Federal Technology Vision 2021: Full U.S. Federal Survey Findings | AccentureFederal Technology Vision 2021: Full U.S. Federal Survey Findings | Accenture
Federal Technology Vision 2021: Full U.S. Federal Survey Findings | Accentureaccenture
 
Digital 2019 Taiwan (January 2019) v01
Digital 2019 Taiwan (January 2019) v01Digital 2019 Taiwan (January 2019) v01
Digital 2019 Taiwan (January 2019) v01DataReportal
 
McKinsey Survey: Japanese consumer sentiment during the coronavirus crisis
McKinsey Survey: Japanese consumer sentiment during the coronavirus crisisMcKinsey Survey: Japanese consumer sentiment during the coronavirus crisis
McKinsey Survey: Japanese consumer sentiment during the coronavirus crisisMcKinsey on Marketing & Sales
 
CTG-Cap nhat ket qua KD quy 1.2023_final_EN_31.05.2023.pptx
CTG-Cap nhat ket qua KD quy 1.2023_final_EN_31.05.2023.pptxCTG-Cap nhat ket qua KD quy 1.2023_final_EN_31.05.2023.pptx
CTG-Cap nhat ket qua KD quy 1.2023_final_EN_31.05.2023.pptxngothithungan1
 
e-Conomy SEA 2021: Kỷ nguyên số của Đông Nam Á
e-Conomy SEA 2021: Kỷ nguyên số của Đông Nam Áe-Conomy SEA 2021: Kỷ nguyên số của Đông Nam Á
e-Conomy SEA 2021: Kỷ nguyên số của Đông Nam ÁMarketingTrips
 
Race in the workplace: The Black experience in the US private sector
Race in the workplace: The Black experience in the US private sectorRace in the workplace: The Black experience in the US private sector
Race in the workplace: The Black experience in the US private sectorMcKinsey & Company
 
What Your Competitors Are Already Doing with Big Data
What Your Competitors Are Already Doing with Big DataWhat Your Competitors Are Already Doing with Big Data
What Your Competitors Are Already Doing with Big DataBoston Consulting Group
 

What's hot (20)

Brazil's Consumer Pulse Update
Brazil's Consumer Pulse UpdateBrazil's Consumer Pulse Update
Brazil's Consumer Pulse Update
 
#BainWebinar Commercial Aviation Outlook and Scenarios
#BainWebinar Commercial Aviation Outlook and Scenarios#BainWebinar Commercial Aviation Outlook and Scenarios
#BainWebinar Commercial Aviation Outlook and Scenarios
 
Bain Covid 19 situation report & action agenda
Bain   Covid 19 situation report & action agendaBain   Covid 19 situation report & action agenda
Bain Covid 19 situation report & action agenda
 
Colombia's Consumer Pulse Update - August 2020
Colombia's Consumer Pulse Update - August 2020Colombia's Consumer Pulse Update - August 2020
Colombia's Consumer Pulse Update - August 2020
 
McKinsey Survey: US consumer sentiment during the coronavirus crisis
McKinsey Survey: US consumer sentiment during the coronavirus crisisMcKinsey Survey: US consumer sentiment during the coronavirus crisis
McKinsey Survey: US consumer sentiment during the coronavirus crisis
 
Insurance Customer Market Pulse Survey 2021
Insurance Customer Market Pulse Survey 2021Insurance Customer Market Pulse Survey 2021
Insurance Customer Market Pulse Survey 2021
 
Digital Europe: Pushing the frontier, capturing the benefits
Digital Europe: Pushing the frontier, capturing the benefitsDigital Europe: Pushing the frontier, capturing the benefits
Digital Europe: Pushing the frontier, capturing the benefits
 
Q4 2022 DBX Investor Presentation.pdf
Q4 2022 DBX Investor Presentation.pdfQ4 2022 DBX Investor Presentation.pdf
Q4 2022 DBX Investor Presentation.pdf
 
Argentina's Consumer Pulse Update - August 2020
Argentina's Consumer Pulse Update - August 2020Argentina's Consumer Pulse Update - August 2020
Argentina's Consumer Pulse Update - August 2020
 
2018 Local Dynamos: Emerging-Market Companies Up Their Game
2018 Local Dynamos: Emerging-Market Companies Up Their Game2018 Local Dynamos: Emerging-Market Companies Up Their Game
2018 Local Dynamos: Emerging-Market Companies Up Their Game
 
The Great Mobility Tech Race: Winning the battle for future profits
The Great Mobility Tech Race: Winning the battle for future profitsThe Great Mobility Tech Race: Winning the battle for future profits
The Great Mobility Tech Race: Winning the battle for future profits
 
How Collaboration Advances Your Sustainability Efforts
How Collaboration Advances Your Sustainability EffortsHow Collaboration Advances Your Sustainability Efforts
How Collaboration Advances Your Sustainability Efforts
 
Shattering the Glass Screen: Gender inequality in media and entertainment
 Shattering the Glass Screen: Gender inequality in media and entertainment Shattering the Glass Screen: Gender inequality in media and entertainment
Shattering the Glass Screen: Gender inequality in media and entertainment
 
Federal Technology Vision 2021: Full U.S. Federal Survey Findings | Accenture
Federal Technology Vision 2021: Full U.S. Federal Survey Findings | AccentureFederal Technology Vision 2021: Full U.S. Federal Survey Findings | Accenture
Federal Technology Vision 2021: Full U.S. Federal Survey Findings | Accenture
 
Digital 2019 Taiwan (January 2019) v01
Digital 2019 Taiwan (January 2019) v01Digital 2019 Taiwan (January 2019) v01
Digital 2019 Taiwan (January 2019) v01
 
McKinsey Survey: Japanese consumer sentiment during the coronavirus crisis
McKinsey Survey: Japanese consumer sentiment during the coronavirus crisisMcKinsey Survey: Japanese consumer sentiment during the coronavirus crisis
McKinsey Survey: Japanese consumer sentiment during the coronavirus crisis
 
CTG-Cap nhat ket qua KD quy 1.2023_final_EN_31.05.2023.pptx
CTG-Cap nhat ket qua KD quy 1.2023_final_EN_31.05.2023.pptxCTG-Cap nhat ket qua KD quy 1.2023_final_EN_31.05.2023.pptx
CTG-Cap nhat ket qua KD quy 1.2023_final_EN_31.05.2023.pptx
 
e-Conomy SEA 2021: Kỷ nguyên số của Đông Nam Á
e-Conomy SEA 2021: Kỷ nguyên số của Đông Nam Áe-Conomy SEA 2021: Kỷ nguyên số của Đông Nam Á
e-Conomy SEA 2021: Kỷ nguyên số của Đông Nam Á
 
Race in the workplace: The Black experience in the US private sector
Race in the workplace: The Black experience in the US private sectorRace in the workplace: The Black experience in the US private sector
Race in the workplace: The Black experience in the US private sector
 
What Your Competitors Are Already Doing with Big Data
What Your Competitors Are Already Doing with Big DataWhat Your Competitors Are Already Doing with Big Data
What Your Competitors Are Already Doing with Big Data
 

Similar to McKinsey Survey: Japanese consumer sentiment during the coronavirus crisis

McKinsey Survey: Japanese consumer sentiment during the coronavirus crisis
McKinsey Survey: Japanese consumer sentiment during the coronavirus crisisMcKinsey Survey: Japanese consumer sentiment during the coronavirus crisis
McKinsey Survey: Japanese consumer sentiment during the coronavirus crisisMcKinsey on Marketing & Sales
 
McKinsey Survey: Italian consumer sentiment during the coronavirus crisis
McKinsey Survey: Italian consumer sentiment during the coronavirus crisisMcKinsey Survey: Italian consumer sentiment during the coronavirus crisis
McKinsey Survey: Italian consumer sentiment during the coronavirus crisisMcKinsey on Marketing & Sales
 
McKinsey Survey: Korean consumer sentiment during the coronavirus crisis
McKinsey Survey: Korean consumer sentiment during the coronavirus crisisMcKinsey Survey: Korean consumer sentiment during the coronavirus crisis
McKinsey Survey: Korean consumer sentiment during the coronavirus crisisMcKinsey on Marketing & Sales
 
McKinsey Survey: German consumer sentiment during the coronavirus crisis
McKinsey Survey: German consumer sentiment during the coronavirus crisisMcKinsey Survey: German consumer sentiment during the coronavirus crisis
McKinsey Survey: German consumer sentiment during the coronavirus crisisMcKinsey on Marketing & Sales
 
McKinsey: Survey: Indonesian consumer sentiment during the coronavirus crisis
McKinsey: Survey: Indonesian consumer sentiment during the coronavirus crisisMcKinsey: Survey: Indonesian consumer sentiment during the coronavirus crisis
McKinsey: Survey: Indonesian consumer sentiment during the coronavirus crisisMcKinsey on Marketing & Sales
 
McKinsey Survey: Indian consumer sentiment during the coronavirus crisis
McKinsey Survey: Indian consumer sentiment during the coronavirus crisisMcKinsey Survey: Indian consumer sentiment during the coronavirus crisis
McKinsey Survey: Indian consumer sentiment during the coronavirus crisisMcKinsey on Marketing & Sales
 
McKinsey Survey: Chinese consumer sentiment during the coronavirus crisis
McKinsey Survey: Chinese consumer sentiment during the coronavirus crisisMcKinsey Survey: Chinese consumer sentiment during the coronavirus crisis
McKinsey Survey: Chinese consumer sentiment during the coronavirus crisisMcKinsey on Marketing & Sales
 
McKinsey Survey: US consumer sentiment during the coronavirus crisis
McKinsey Survey: US consumer sentiment during the coronavirus crisisMcKinsey Survey: US consumer sentiment during the coronavirus crisis
McKinsey Survey: US consumer sentiment during the coronavirus crisisMcKinsey on Marketing & Sales
 
McKinsey Survey: Spanish consumer sentiment during the coronavirus crisis
McKinsey Survey: Spanish consumer sentiment during the coronavirus crisisMcKinsey Survey: Spanish consumer sentiment during the coronavirus crisis
McKinsey Survey: Spanish consumer sentiment during the coronavirus crisisMcKinsey on Marketing & Sales
 
McKinsey Survey: Filipino consumer sentiment during the coronavirus crisis
McKinsey Survey: Filipino consumer sentiment during the coronavirus crisisMcKinsey Survey: Filipino consumer sentiment during the coronavirus crisis
McKinsey Survey: Filipino consumer sentiment during the coronavirus crisisMcKinsey on Marketing & Sales
 
McKinsey Survey: US consumer sentiment during the coronavirus crisis
McKinsey Survey: US consumer sentiment during the coronavirus crisisMcKinsey Survey: US consumer sentiment during the coronavirus crisis
McKinsey Survey: US consumer sentiment during the coronavirus crisisMcKinsey on Marketing & Sales
 
McKinsey Survey: Chinese consumer sentiment during the coronavirus crisis
McKinsey Survey: Chinese consumer sentiment during the coronavirus crisisMcKinsey Survey: Chinese consumer sentiment during the coronavirus crisis
McKinsey Survey: Chinese consumer sentiment during the coronavirus crisisMcKinsey on Marketing & Sales
 

Similar to McKinsey Survey: Japanese consumer sentiment during the coronavirus crisis (20)

McKinsey Survey: Japanese consumer sentiment during the coronavirus crisis
McKinsey Survey: Japanese consumer sentiment during the coronavirus crisisMcKinsey Survey: Japanese consumer sentiment during the coronavirus crisis
McKinsey Survey: Japanese consumer sentiment during the coronavirus crisis
 
McKinsey Survey: Italian consumer sentiment during the coronavirus crisis
McKinsey Survey: Italian consumer sentiment during the coronavirus crisisMcKinsey Survey: Italian consumer sentiment during the coronavirus crisis
McKinsey Survey: Italian consumer sentiment during the coronavirus crisis
 
McKinsey Survey: Japanese consumer sentiment during the coronavirus crisis
McKinsey Survey: Japanese consumer sentiment during the coronavirus crisisMcKinsey Survey: Japanese consumer sentiment during the coronavirus crisis
McKinsey Survey: Japanese consumer sentiment during the coronavirus crisis
 
McKinsey Survey: Italian consumer sentiment during the coronavirus crisis
McKinsey Survey: Italian consumer sentiment during the coronavirus crisisMcKinsey Survey: Italian consumer sentiment during the coronavirus crisis
McKinsey Survey: Italian consumer sentiment during the coronavirus crisis
 
McKinsey Survey: Korean consumer sentiment during the coronavirus crisis
McKinsey Survey: Korean consumer sentiment during the coronavirus crisisMcKinsey Survey: Korean consumer sentiment during the coronavirus crisis
McKinsey Survey: Korean consumer sentiment during the coronavirus crisis
 
McKinsey Survey: Korean consumer sentiment during the coronavirus crisis
McKinsey Survey: Korean consumer sentiment during the coronavirus crisisMcKinsey Survey: Korean consumer sentiment during the coronavirus crisis
McKinsey Survey: Korean consumer sentiment during the coronavirus crisis
 
McKinsey Survey: German consumer sentiment during the coronavirus crisis
McKinsey Survey: German consumer sentiment during the coronavirus crisisMcKinsey Survey: German consumer sentiment during the coronavirus crisis
McKinsey Survey: German consumer sentiment during the coronavirus crisis
 
McKinsey Survey: German consumer sentiment during the coronavirus crisis
McKinsey Survey: German consumer sentiment during the coronavirus crisisMcKinsey Survey: German consumer sentiment during the coronavirus crisis
McKinsey Survey: German consumer sentiment during the coronavirus crisis
 
McKinsey: Survey: Indonesian consumer sentiment during the coronavirus crisis
McKinsey: Survey: Indonesian consumer sentiment during the coronavirus crisisMcKinsey: Survey: Indonesian consumer sentiment during the coronavirus crisis
McKinsey: Survey: Indonesian consumer sentiment during the coronavirus crisis
 
McKinsey: Survey: Indonesian consumer sentiment during the coronavirus crisis
McKinsey: Survey: Indonesian consumer sentiment during the coronavirus crisisMcKinsey: Survey: Indonesian consumer sentiment during the coronavirus crisis
McKinsey: Survey: Indonesian consumer sentiment during the coronavirus crisis
 
McKinsey Survey: Indian consumer sentiment during the coronavirus crisis
McKinsey Survey: Indian consumer sentiment during the coronavirus crisisMcKinsey Survey: Indian consumer sentiment during the coronavirus crisis
McKinsey Survey: Indian consumer sentiment during the coronavirus crisis
 
McKinsey Survey: Chinese consumer sentiment during the coronavirus crisis
McKinsey Survey: Chinese consumer sentiment during the coronavirus crisisMcKinsey Survey: Chinese consumer sentiment during the coronavirus crisis
McKinsey Survey: Chinese consumer sentiment during the coronavirus crisis
 
McKinsey Survey: US consumer sentiment during the coronavirus crisis
McKinsey Survey: US consumer sentiment during the coronavirus crisisMcKinsey Survey: US consumer sentiment during the coronavirus crisis
McKinsey Survey: US consumer sentiment during the coronavirus crisis
 
McKinsey Survey: Spanish consumer sentiment during the coronavirus crisis
McKinsey Survey: Spanish consumer sentiment during the coronavirus crisisMcKinsey Survey: Spanish consumer sentiment during the coronavirus crisis
McKinsey Survey: Spanish consumer sentiment during the coronavirus crisis
 
McKinsey Survey: Filipino consumer sentiment during the coronavirus crisis
McKinsey Survey: Filipino consumer sentiment during the coronavirus crisisMcKinsey Survey: Filipino consumer sentiment during the coronavirus crisis
McKinsey Survey: Filipino consumer sentiment during the coronavirus crisis
 
McKinsey Survey: US consumer sentiment during the coronavirus crisis
McKinsey Survey: US consumer sentiment during the coronavirus crisisMcKinsey Survey: US consumer sentiment during the coronavirus crisis
McKinsey Survey: US consumer sentiment during the coronavirus crisis
 
McKinsey Survey: US consumer sentiment during the coronavirus crisis
McKinsey Survey: US consumer sentiment during the coronavirus crisisMcKinsey Survey: US consumer sentiment during the coronavirus crisis
McKinsey Survey: US consumer sentiment during the coronavirus crisis
 
McKinsey Survey: Chinese consumer sentiment during the coronavirus crisis
McKinsey Survey: Chinese consumer sentiment during the coronavirus crisisMcKinsey Survey: Chinese consumer sentiment during the coronavirus crisis
McKinsey Survey: Chinese consumer sentiment during the coronavirus crisis
 
McKinsey Survey: Chinese consumer sentiment during the coronavirus crisis
McKinsey Survey: Chinese consumer sentiment during the coronavirus crisisMcKinsey Survey: Chinese consumer sentiment during the coronavirus crisis
McKinsey Survey: Chinese consumer sentiment during the coronavirus crisis
 

More from McKinsey on Marketing & Sales

McKinsey European consumer sentiment survey: How current events are shaping S...
McKinsey European consumer sentiment survey: How current events are shaping S...McKinsey European consumer sentiment survey: How current events are shaping S...
McKinsey European consumer sentiment survey: How current events are shaping S...McKinsey on Marketing & Sales
 
McKinsey European consumer sentiment survey: How current events are shaping U...
McKinsey European consumer sentiment survey: How current events are shaping U...McKinsey European consumer sentiment survey: How current events are shaping U...
McKinsey European consumer sentiment survey: How current events are shaping U...McKinsey on Marketing & Sales
 
McKinsey European consumer sentiment survey: How current events are shaping I...
McKinsey European consumer sentiment survey: How current events are shaping I...McKinsey European consumer sentiment survey: How current events are shaping I...
McKinsey European consumer sentiment survey: How current events are shaping I...McKinsey on Marketing & Sales
 
McKinsey European consumer sentiment survey: How current events are shaping G...
McKinsey European consumer sentiment survey: How current events are shaping G...McKinsey European consumer sentiment survey: How current events are shaping G...
McKinsey European consumer sentiment survey: How current events are shaping G...McKinsey on Marketing & Sales
 
McKinsey European consumer sentiment survey: How current events are shaping F...
McKinsey European consumer sentiment survey: How current events are shaping F...McKinsey European consumer sentiment survey: How current events are shaping F...
McKinsey European consumer sentiment survey: How current events are shaping F...McKinsey on Marketing & Sales
 
McKinsey Survey: Australian consumer sentiment during the coronavirus crisis
McKinsey Survey: Australian consumer sentiment during the coronavirus crisisMcKinsey Survey: Australian consumer sentiment during the coronavirus crisis
McKinsey Survey: Australian consumer sentiment during the coronavirus crisisMcKinsey on Marketing & Sales
 
McKinsey Survey: Indian consumer sentiment during the coronavirus crisis
McKinsey Survey: Indian consumer sentiment during the coronavirus crisisMcKinsey Survey: Indian consumer sentiment during the coronavirus crisis
McKinsey Survey: Indian consumer sentiment during the coronavirus crisisMcKinsey on Marketing & Sales
 
McKinsey European consumer sentiment survey: How current events are shaping U...
McKinsey European consumer sentiment survey: How current events are shaping U...McKinsey European consumer sentiment survey: How current events are shaping U...
McKinsey European consumer sentiment survey: How current events are shaping U...McKinsey on Marketing & Sales
 
McKinsey European consumer sentiment survey: How current events are shaping G...
McKinsey European consumer sentiment survey: How current events are shaping G...McKinsey European consumer sentiment survey: How current events are shaping G...
McKinsey European consumer sentiment survey: How current events are shaping G...McKinsey on Marketing & Sales
 
McKinsey European consumer sentiment survey: How current events in Europe are...
McKinsey European consumer sentiment survey: How current events in Europe are...McKinsey European consumer sentiment survey: How current events in Europe are...
McKinsey European consumer sentiment survey: How current events in Europe are...McKinsey on Marketing & Sales
 
McKinsey European consumer sentiment survey: How current events are shaping S...
McKinsey European consumer sentiment survey: How current events are shaping S...McKinsey European consumer sentiment survey: How current events are shaping S...
McKinsey European consumer sentiment survey: How current events are shaping S...McKinsey on Marketing & Sales
 
McKinsey European consumer sentiment survey: How current events are shaping I...
McKinsey European consumer sentiment survey: How current events are shaping I...McKinsey European consumer sentiment survey: How current events are shaping I...
McKinsey European consumer sentiment survey: How current events are shaping I...McKinsey on Marketing & Sales
 
McKinsey survey: European consumer sentiment survey: How current events are s...
McKinsey survey: European consumer sentiment survey: How current events are s...McKinsey survey: European consumer sentiment survey: How current events are s...
McKinsey survey: European consumer sentiment survey: How current events are s...McKinsey on Marketing & Sales
 
McKinsey Survey: European consumer sentiment during the coronavirus crisis
McKinsey Survey: European consumer sentiment during the coronavirus crisisMcKinsey Survey: European consumer sentiment during the coronavirus crisis
McKinsey Survey: European consumer sentiment during the coronavirus crisisMcKinsey on Marketing & Sales
 
McKinsey Survey: Indian consumer sentiment during the coronavirus crisis
McKinsey Survey: Indian consumer sentiment during the coronavirus crisisMcKinsey Survey: Indian consumer sentiment during the coronavirus crisis
McKinsey Survey: Indian consumer sentiment during the coronavirus crisisMcKinsey on Marketing & Sales
 
McKinsey Survey: Australian consumer sentiment during the coronavirus crisis
McKinsey Survey: Australian consumer sentiment during the coronavirus crisisMcKinsey Survey: Australian consumer sentiment during the coronavirus crisis
McKinsey Survey: Australian consumer sentiment during the coronavirus crisisMcKinsey on Marketing & Sales
 

More from McKinsey on Marketing & Sales (20)

McKinsey European consumer sentiment survey: How current events are shaping S...
McKinsey European consumer sentiment survey: How current events are shaping S...McKinsey European consumer sentiment survey: How current events are shaping S...
McKinsey European consumer sentiment survey: How current events are shaping S...
 
McKinsey European consumer sentiment survey: How current events are shaping U...
McKinsey European consumer sentiment survey: How current events are shaping U...McKinsey European consumer sentiment survey: How current events are shaping U...
McKinsey European consumer sentiment survey: How current events are shaping U...
 
McKinsey European consumer sentiment survey: How current events are shaping I...
McKinsey European consumer sentiment survey: How current events are shaping I...McKinsey European consumer sentiment survey: How current events are shaping I...
McKinsey European consumer sentiment survey: How current events are shaping I...
 
McKinsey European consumer sentiment survey: How current events are shaping G...
McKinsey European consumer sentiment survey: How current events are shaping G...McKinsey European consumer sentiment survey: How current events are shaping G...
McKinsey European consumer sentiment survey: How current events are shaping G...
 
McKinsey European consumer sentiment survey: How current events are shaping F...
McKinsey European consumer sentiment survey: How current events are shaping F...McKinsey European consumer sentiment survey: How current events are shaping F...
McKinsey European consumer sentiment survey: How current events are shaping F...
 
McKinsey Survey: Australian consumer sentiment during the coronavirus crisis
McKinsey Survey: Australian consumer sentiment during the coronavirus crisisMcKinsey Survey: Australian consumer sentiment during the coronavirus crisis
McKinsey Survey: Australian consumer sentiment during the coronavirus crisis
 
McKinsey Survey: Indian consumer sentiment during the coronavirus crisis
McKinsey Survey: Indian consumer sentiment during the coronavirus crisisMcKinsey Survey: Indian consumer sentiment during the coronavirus crisis
McKinsey Survey: Indian consumer sentiment during the coronavirus crisis
 
McKinsey European consumer sentiment survey: How current events are shaping U...
McKinsey European consumer sentiment survey: How current events are shaping U...McKinsey European consumer sentiment survey: How current events are shaping U...
McKinsey European consumer sentiment survey: How current events are shaping U...
 
McKinsey European consumer sentiment survey: How current events are shaping G...
McKinsey European consumer sentiment survey: How current events are shaping G...McKinsey European consumer sentiment survey: How current events are shaping G...
McKinsey European consumer sentiment survey: How current events are shaping G...
 
McKinsey European consumer sentiment survey: How current events in Europe are...
McKinsey European consumer sentiment survey: How current events in Europe are...McKinsey European consumer sentiment survey: How current events in Europe are...
McKinsey European consumer sentiment survey: How current events in Europe are...
 
McKinsey European consumer sentiment survey: How current events are shaping S...
McKinsey European consumer sentiment survey: How current events are shaping S...McKinsey European consumer sentiment survey: How current events are shaping S...
McKinsey European consumer sentiment survey: How current events are shaping S...
 
McKinsey European consumer sentiment survey: How current events are shaping I...
McKinsey European consumer sentiment survey: How current events are shaping I...McKinsey European consumer sentiment survey: How current events are shaping I...
McKinsey European consumer sentiment survey: How current events are shaping I...
 
McKinsey survey: European consumer sentiment survey: How current events are s...
McKinsey survey: European consumer sentiment survey: How current events are s...McKinsey survey: European consumer sentiment survey: How current events are s...
McKinsey survey: European consumer sentiment survey: How current events are s...
 
McKinsey survey: European consumer sentiment survey: How current events are s...
McKinsey survey: European consumer sentiment survey: How current events are s...McKinsey survey: European consumer sentiment survey: How current events are s...
McKinsey survey: European consumer sentiment survey: How current events are s...
 
McKinsey Survey: European consumer sentiment during the coronavirus crisis
McKinsey Survey: European consumer sentiment during the coronavirus crisisMcKinsey Survey: European consumer sentiment during the coronavirus crisis
McKinsey Survey: European consumer sentiment during the coronavirus crisis
 
McKinsey Survey: Indian consumer sentiment during the coronavirus crisis
McKinsey Survey: Indian consumer sentiment during the coronavirus crisisMcKinsey Survey: Indian consumer sentiment during the coronavirus crisis
McKinsey Survey: Indian consumer sentiment during the coronavirus crisis
 
McKinsey Survey: Australian consumer sentiment during the coronavirus crisis
McKinsey Survey: Australian consumer sentiment during the coronavirus crisisMcKinsey Survey: Australian consumer sentiment during the coronavirus crisis
McKinsey Survey: Australian consumer sentiment during the coronavirus crisis
 

Recently uploaded

Call Girls in Delhi, Escort Service Available 24x7 in Delhi 959961-/-3876
Call Girls in Delhi, Escort Service Available 24x7 in Delhi 959961-/-3876Call Girls in Delhi, Escort Service Available 24x7 in Delhi 959961-/-3876
Call Girls in Delhi, Escort Service Available 24x7 in Delhi 959961-/-3876dlhescort
 
The Abortion pills for sale in Qatar@Doha [+27737758557] []Deira Dubai Kuwait
The Abortion pills for sale in Qatar@Doha [+27737758557] []Deira Dubai KuwaitThe Abortion pills for sale in Qatar@Doha [+27737758557] []Deira Dubai Kuwait
The Abortion pills for sale in Qatar@Doha [+27737758557] []Deira Dubai Kuwaitdaisycvs
 
Famous Olympic Siblings from the 21st Century
Famous Olympic Siblings from the 21st CenturyFamous Olympic Siblings from the 21st Century
Famous Olympic Siblings from the 21st Centuryrwgiffor
 
FULL ENJOY Call Girls In Majnu Ka Tilla, Delhi Contact Us 8377877756
FULL ENJOY Call Girls In Majnu Ka Tilla, Delhi Contact Us 8377877756FULL ENJOY Call Girls In Majnu Ka Tilla, Delhi Contact Us 8377877756
FULL ENJOY Call Girls In Majnu Ka Tilla, Delhi Contact Us 8377877756dollysharma2066
 
Malegaon Call Girls Service ☎ ️82500–77686 ☎️ Enjoy 24/7 Escort Service
Malegaon Call Girls Service ☎ ️82500–77686 ☎️ Enjoy 24/7 Escort ServiceMalegaon Call Girls Service ☎ ️82500–77686 ☎️ Enjoy 24/7 Escort Service
Malegaon Call Girls Service ☎ ️82500–77686 ☎️ Enjoy 24/7 Escort ServiceDamini Dixit
 
Organizational Transformation Lead with Culture
Organizational Transformation Lead with CultureOrganizational Transformation Lead with Culture
Organizational Transformation Lead with CultureSeta Wicaksana
 
Cracking the Cultural Competence Code.pptx
Cracking the Cultural Competence Code.pptxCracking the Cultural Competence Code.pptx
Cracking the Cultural Competence Code.pptxWorkforce Group
 
Business Model Canvas (BMC)- A new venture concept
Business Model Canvas (BMC)-  A new venture conceptBusiness Model Canvas (BMC)-  A new venture concept
Business Model Canvas (BMC)- A new venture conceptP&CO
 
Value Proposition canvas- Customer needs and pains
Value Proposition canvas- Customer needs and painsValue Proposition canvas- Customer needs and pains
Value Proposition canvas- Customer needs and painsP&CO
 
RSA Conference Exhibitor List 2024 - Exhibitors Data
RSA Conference Exhibitor List 2024 - Exhibitors DataRSA Conference Exhibitor List 2024 - Exhibitors Data
RSA Conference Exhibitor List 2024 - Exhibitors DataExhibitors Data
 
Dr. Admir Softic_ presentation_Green Club_ENG.pdf
Dr. Admir Softic_ presentation_Green Club_ENG.pdfDr. Admir Softic_ presentation_Green Club_ENG.pdf
Dr. Admir Softic_ presentation_Green Club_ENG.pdfAdmir Softic
 
BAGALUR CALL GIRL IN 98274*61493 ❤CALL GIRLS IN ESCORT SERVICE❤CALL GIRL
BAGALUR CALL GIRL IN 98274*61493 ❤CALL GIRLS IN ESCORT SERVICE❤CALL GIRLBAGALUR CALL GIRL IN 98274*61493 ❤CALL GIRLS IN ESCORT SERVICE❤CALL GIRL
BAGALUR CALL GIRL IN 98274*61493 ❤CALL GIRLS IN ESCORT SERVICE❤CALL GIRLkapoorjyoti4444
 
Falcon Invoice Discounting: The best investment platform in india for investors
Falcon Invoice Discounting: The best investment platform in india for investorsFalcon Invoice Discounting: The best investment platform in india for investors
Falcon Invoice Discounting: The best investment platform in india for investorsFalcon Invoice Discounting
 
Chandigarh Escorts Service 📞8868886958📞 Just📲 Call Nihal Chandigarh Call Girl...
Chandigarh Escorts Service 📞8868886958📞 Just📲 Call Nihal Chandigarh Call Girl...Chandigarh Escorts Service 📞8868886958📞 Just📲 Call Nihal Chandigarh Call Girl...
Chandigarh Escorts Service 📞8868886958📞 Just📲 Call Nihal Chandigarh Call Girl...Sheetaleventcompany
 
JAYNAGAR CALL GIRL IN 98274*61493 ❤CALL GIRLS IN ESCORT SERVICE❤CALL GIRL
JAYNAGAR CALL GIRL IN 98274*61493 ❤CALL GIRLS IN ESCORT SERVICE❤CALL GIRLJAYNAGAR CALL GIRL IN 98274*61493 ❤CALL GIRLS IN ESCORT SERVICE❤CALL GIRL
JAYNAGAR CALL GIRL IN 98274*61493 ❤CALL GIRLS IN ESCORT SERVICE❤CALL GIRLkapoorjyoti4444
 
👉Chandigarh Call Girls 👉9878799926👉Just Call👉Chandigarh Call Girl In Chandiga...
👉Chandigarh Call Girls 👉9878799926👉Just Call👉Chandigarh Call Girl In Chandiga...👉Chandigarh Call Girls 👉9878799926👉Just Call👉Chandigarh Call Girl In Chandiga...
👉Chandigarh Call Girls 👉9878799926👉Just Call👉Chandigarh Call Girl In Chandiga...rajveerescorts2022
 
Call Girls Kengeri Satellite Town Just Call 👗 7737669865 👗 Top Class Call Gir...
Call Girls Kengeri Satellite Town Just Call 👗 7737669865 👗 Top Class Call Gir...Call Girls Kengeri Satellite Town Just Call 👗 7737669865 👗 Top Class Call Gir...
Call Girls Kengeri Satellite Town Just Call 👗 7737669865 👗 Top Class Call Gir...amitlee9823
 
Marel Q1 2024 Investor Presentation from May 8, 2024
Marel Q1 2024 Investor Presentation from May 8, 2024Marel Q1 2024 Investor Presentation from May 8, 2024
Marel Q1 2024 Investor Presentation from May 8, 2024Marel
 
Russian Call Girls In Rajiv Chowk Gurgaon ❤️8448577510 ⊹Best Escorts Service ...
Russian Call Girls In Rajiv Chowk Gurgaon ❤️8448577510 ⊹Best Escorts Service ...Russian Call Girls In Rajiv Chowk Gurgaon ❤️8448577510 ⊹Best Escorts Service ...
Russian Call Girls In Rajiv Chowk Gurgaon ❤️8448577510 ⊹Best Escorts Service ...lizamodels9
 

Recently uploaded (20)

Call Girls in Delhi, Escort Service Available 24x7 in Delhi 959961-/-3876
Call Girls in Delhi, Escort Service Available 24x7 in Delhi 959961-/-3876Call Girls in Delhi, Escort Service Available 24x7 in Delhi 959961-/-3876
Call Girls in Delhi, Escort Service Available 24x7 in Delhi 959961-/-3876
 
The Abortion pills for sale in Qatar@Doha [+27737758557] []Deira Dubai Kuwait
The Abortion pills for sale in Qatar@Doha [+27737758557] []Deira Dubai KuwaitThe Abortion pills for sale in Qatar@Doha [+27737758557] []Deira Dubai Kuwait
The Abortion pills for sale in Qatar@Doha [+27737758557] []Deira Dubai Kuwait
 
Famous Olympic Siblings from the 21st Century
Famous Olympic Siblings from the 21st CenturyFamous Olympic Siblings from the 21st Century
Famous Olympic Siblings from the 21st Century
 
FULL ENJOY Call Girls In Majnu Ka Tilla, Delhi Contact Us 8377877756
FULL ENJOY Call Girls In Majnu Ka Tilla, Delhi Contact Us 8377877756FULL ENJOY Call Girls In Majnu Ka Tilla, Delhi Contact Us 8377877756
FULL ENJOY Call Girls In Majnu Ka Tilla, Delhi Contact Us 8377877756
 
Malegaon Call Girls Service ☎ ️82500–77686 ☎️ Enjoy 24/7 Escort Service
Malegaon Call Girls Service ☎ ️82500–77686 ☎️ Enjoy 24/7 Escort ServiceMalegaon Call Girls Service ☎ ️82500–77686 ☎️ Enjoy 24/7 Escort Service
Malegaon Call Girls Service ☎ ️82500–77686 ☎️ Enjoy 24/7 Escort Service
 
Organizational Transformation Lead with Culture
Organizational Transformation Lead with CultureOrganizational Transformation Lead with Culture
Organizational Transformation Lead with Culture
 
Cracking the Cultural Competence Code.pptx
Cracking the Cultural Competence Code.pptxCracking the Cultural Competence Code.pptx
Cracking the Cultural Competence Code.pptx
 
Business Model Canvas (BMC)- A new venture concept
Business Model Canvas (BMC)-  A new venture conceptBusiness Model Canvas (BMC)-  A new venture concept
Business Model Canvas (BMC)- A new venture concept
 
Value Proposition canvas- Customer needs and pains
Value Proposition canvas- Customer needs and painsValue Proposition canvas- Customer needs and pains
Value Proposition canvas- Customer needs and pains
 
RSA Conference Exhibitor List 2024 - Exhibitors Data
RSA Conference Exhibitor List 2024 - Exhibitors DataRSA Conference Exhibitor List 2024 - Exhibitors Data
RSA Conference Exhibitor List 2024 - Exhibitors Data
 
Dr. Admir Softic_ presentation_Green Club_ENG.pdf
Dr. Admir Softic_ presentation_Green Club_ENG.pdfDr. Admir Softic_ presentation_Green Club_ENG.pdf
Dr. Admir Softic_ presentation_Green Club_ENG.pdf
 
BAGALUR CALL GIRL IN 98274*61493 ❤CALL GIRLS IN ESCORT SERVICE❤CALL GIRL
BAGALUR CALL GIRL IN 98274*61493 ❤CALL GIRLS IN ESCORT SERVICE❤CALL GIRLBAGALUR CALL GIRL IN 98274*61493 ❤CALL GIRLS IN ESCORT SERVICE❤CALL GIRL
BAGALUR CALL GIRL IN 98274*61493 ❤CALL GIRLS IN ESCORT SERVICE❤CALL GIRL
 
Falcon Invoice Discounting: The best investment platform in india for investors
Falcon Invoice Discounting: The best investment platform in india for investorsFalcon Invoice Discounting: The best investment platform in india for investors
Falcon Invoice Discounting: The best investment platform in india for investors
 
Chandigarh Escorts Service 📞8868886958📞 Just📲 Call Nihal Chandigarh Call Girl...
Chandigarh Escorts Service 📞8868886958📞 Just📲 Call Nihal Chandigarh Call Girl...Chandigarh Escorts Service 📞8868886958📞 Just📲 Call Nihal Chandigarh Call Girl...
Chandigarh Escorts Service 📞8868886958📞 Just📲 Call Nihal Chandigarh Call Girl...
 
JAYNAGAR CALL GIRL IN 98274*61493 ❤CALL GIRLS IN ESCORT SERVICE❤CALL GIRL
JAYNAGAR CALL GIRL IN 98274*61493 ❤CALL GIRLS IN ESCORT SERVICE❤CALL GIRLJAYNAGAR CALL GIRL IN 98274*61493 ❤CALL GIRLS IN ESCORT SERVICE❤CALL GIRL
JAYNAGAR CALL GIRL IN 98274*61493 ❤CALL GIRLS IN ESCORT SERVICE❤CALL GIRL
 
👉Chandigarh Call Girls 👉9878799926👉Just Call👉Chandigarh Call Girl In Chandiga...
👉Chandigarh Call Girls 👉9878799926👉Just Call👉Chandigarh Call Girl In Chandiga...👉Chandigarh Call Girls 👉9878799926👉Just Call👉Chandigarh Call Girl In Chandiga...
👉Chandigarh Call Girls 👉9878799926👉Just Call👉Chandigarh Call Girl In Chandiga...
 
(Anamika) VIP Call Girls Napur Call Now 8617697112 Napur Escorts 24x7
(Anamika) VIP Call Girls Napur Call Now 8617697112 Napur Escorts 24x7(Anamika) VIP Call Girls Napur Call Now 8617697112 Napur Escorts 24x7
(Anamika) VIP Call Girls Napur Call Now 8617697112 Napur Escorts 24x7
 
Call Girls Kengeri Satellite Town Just Call 👗 7737669865 👗 Top Class Call Gir...
Call Girls Kengeri Satellite Town Just Call 👗 7737669865 👗 Top Class Call Gir...Call Girls Kengeri Satellite Town Just Call 👗 7737669865 👗 Top Class Call Gir...
Call Girls Kengeri Satellite Town Just Call 👗 7737669865 👗 Top Class Call Gir...
 
Marel Q1 2024 Investor Presentation from May 8, 2024
Marel Q1 2024 Investor Presentation from May 8, 2024Marel Q1 2024 Investor Presentation from May 8, 2024
Marel Q1 2024 Investor Presentation from May 8, 2024
 
Russian Call Girls In Rajiv Chowk Gurgaon ❤️8448577510 ⊹Best Escorts Service ...
Russian Call Girls In Rajiv Chowk Gurgaon ❤️8448577510 ⊹Best Escorts Service ...Russian Call Girls In Rajiv Chowk Gurgaon ❤️8448577510 ⊹Best Escorts Service ...
Russian Call Girls In Rajiv Chowk Gurgaon ❤️8448577510 ⊹Best Escorts Service ...
 

McKinsey Survey: Japanese consumer sentiment during the coronavirus crisis

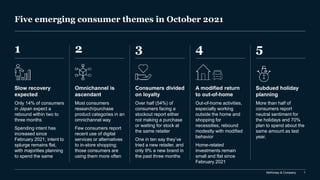
  • 1. McKinsey & Company 1 Five emerging consumer themes in October 2021 1 2 5 4 3 Slow recovery expected Only 14% of consumers in Japan expect a rebound within two to three months Spending intent has increased since February 2021; intent to splurge remains flat, with majorities planning to spend the same Omnichannel is ascendant Most consumers research/purchase product categories in an omnichannel way Few consumers report recent use of digital services or alternatives to in-store shopping; those consumers are using them more often Subdued holiday planning More than half of consumers report neutral sentiment for the holidays and 70% plan to spend about the same amount as last year. A modified return to out-of-home Out-of-home activities, especially working outside the home and shopping for necessities, rebound modestly with modified behavior Home-related investments remain small and flat since February 2021 Consumers divided on loyalty Over half (54%) of consumers facing a stockout report either not making a purchase or waiting for stock at the same retailer One in ten say they’ve tried a new retailer, and only 9% a new brand in the past three months
  • 2. McKinsey & Company 2 Confidence in own country’s economic recovery after COVID-191 % of respondents 15 14 13 17 17 22 22 32 41 49 52 50 50 46 74 67 44 37 35 33 33 32 5 India China 1 21 65 14 Mixed: The economy will be impacted for 6–12 months or longer and will stagnate or show slow growth thereafter Pessimistic: COVID-19 will have lasting impact on the economy and show regression or fall into lengthy recession Optimistic: The economy will rebound within 2–3 months and grow just as strong as or stronger than before COVID-19 Japan’s consumers continue to be the least optimistic among researched countries 1. Q: What is your overall confidence level surrounding economic conditions after the coronavirus (COVID-19) crisis subsides (ie, once there is herd immunity)? Rated from 1 “very optimistic” to 6 “very pessimistic.” Bars may not sum to 100% due to rounding. Slow recovery expected| Current as of October 2021 Germany 10/15–22 UK 10/15–22 US 10/9–15 India 10/18–25 China 10/17–22 Italy 10/15–22 Spain 10/15–22 France 10/15–22 Change in optimistic vs Feb survey, percentage points 2 3 6 3 13 18 3 Source: McKinsey & Company COVID-19 Consumer Pulse Survey 16 14 Japan 10/18–10/20
  • 3. McKinsey & Company 3 41 46 42 35 31 33 21 21 53 49 53 60 62 60 67 65 6 5 5 5 7 7 12 14 June 2020 Apr 20202 Mar 20202 May 2020 Sept 2020 Nov 2020 Oct 2021 Feb 2021 Slow recovery expected| Current as of October 2021 1. Q: What is your overall confidence level surrounding economic conditions after the coronavirus (COVID-19) crisis subsides (ie, once there is herd immunity)? Rated from 1 “very optimistic” to 6 “very pessimistic.” Figures may not sum to 100% because of rounding. 2. Average of weekly pulse surveys shown for Mar–April 2020. Optimistic: The economy will rebound within 2–3 months and grow just as strong as or stronger than before COVID-19 Mixed: The economy will be impacted for 6–12 months or longer and will stagnate or show slow growth thereafter Pessimistic: COVID-19 will have lasting impact on the economy and show regression or fall into lengthy recession Source: McKinsey & Company COVID-19 Japan Consumer Pulse Survey, 10/18–10/20/2021, n = 1,014; 2/24–2/27/2021, n = 1,014; 11/9–11/15/2020, n = 1,039; 9/22–9/28/2020, n = 1,034; 6/19–6/22/2020, n = 664; 5/22–5/24/2020, n = 600; 4/17–4/19/2020, n = 600; 4/10–4/12/2020, n = 600;4/3–4/5/2020, n = 600;3/28–3/29/2020, n = 600, sampled and weighted to match Japan general population 18+ years Confidence in Japan’s economic recovery has held steady since February 2021 Confidence in own country’s economic recovery after COVID-19,1 % of respondents
  • 4. McKinsey & Company 4 Lower-income consumers are less optimistic than higher-income groups Slow recovery expected| Current as of October 2021 5 8 9 8 16 9 8 17 18 10 0 5 25 20 45 15 30 35 40 50 55 Feb 2021 14 Sept 2020 7 5 Nov 2020 Oct 2021 Low (<4M yen) Medium (4M–8M yen) High (>8M yen) 35 36 24 26 28 17 27 31 16 18 20 0 30 5 10 25 15 35 40 50 45 55 Oct 2021 20 Sept 2020 31 Nov 2020 Feb 2021 1. Q: What is your overall confidence level surrounding economic conditions after the coronavirus (COVID-19) crisis subsides (ie, once there is herd immunity)? Rated from 1 “very optimistic” to 6 “very pessimistic.” Optimism by income Pessimism by income Source: McKinsey & Company COVID-19 Japan Consumer Pulse Survey, 10/18–10/20/2021, n = 1,014; 2/24–2/27/2021, n = 1,014; 11/9–11/15/2020, n = 1,039; 9/22–9/28/2020, n = 1,034, sampled and weighted to match Japan general population 18+ years Confidence in own country’s economic recovery after COVID-19 by income level,1 % of respondents
  • 5. McKinsey & Company 5 Pessimism about Japanese economic recovery varies by generation but is not affected by vaccination status Slow recovery expected| Current as of October 2021 Confidence in own country’s economic recovery after COVID-191 % of respondents 20 24 66 63 14 13 Vaccinated Unvaccinated 1. Q: What is your overall confidence level surrounding economic conditions after the coronavirus (COVID-19) crisis subsides (ie, once there is herd immunity)? Rated from 1 “very optimistic” to 6 “very pessimistic.” 2. Baby boomers includes silent generation. 16 26 26 13 70 59 63 72 14 15 11 15 Gen Z Millennials Gen X Baby boomers2 Optimistic Mixed Pessimistic Source: McKinsey & Company COVID-19 Japan Consumer Pulse Survey, 10/18–10/20/2021, n = 1,014, sampled and weighted to match Japan general population 18+ years By generation By vaccination status
  • 6. McKinsey & Company 6 Slow recovery expected| Current as of October 2021 21 14 19 19 1 1 2 3 78 85 79 78 Baby boomers3 Gen Z Gen X Millennials 16 29 2 71 82 Unvaccinated Vaccinated 18 2 80 Overall 1. Q: When do you expect your routines will return to normal? Figures may not sum to 100% because of rounding. 2. Q: Which best describes your vaccination status? 3. Baby boomers includes silent generation. Source: McKinsey & Company COVID-19 Japan Consumer Pulse Survey 10/18–10/20/2021, n=1,014; sampled and weighted to match Japan general population 18+ years In or after 2022 In 2021 Not affected/already returned By generation By vaccination status2 Expectations are similar across the generations, although millennials are somewhat more likely to expect a long wait for normal routines About 30% of unvaccinated consumers have been unaffected or are back to engaging in normal routines Overall, 80 percent of consumers say normal routines will return in 2022 or later Expectations on routines returning to normal,1 % of respondents
  • 7. McKinsey & Company 7 Perceived impact of COVID-19 on consumers’ income, spending, and savings has been limited and improved slightly in October Slow recovery expected| Current as of October 2021 26 26 24 72 71 73 2 3 Past 2 weeks Past 2 weeks 3 Past 2 weeks 65 Past 2 weeks 27 8 Past 2 weeks 65 24 11 9 68 23 Past 2 weeks 70 13 19 18 68 Past 2 weeks Past 2 weeks 19 63 12 18 Past 2 weeks Source: McKinsey & Company COVID-19 Japan Consumer Pulse Survey, 10/18–10/20/2021, n = 1,014; 2/24–2/27/2021, n = 1,014; 11/9–11/15/2020, n = 1,039, sampled and weighted to match Japan general population 18+ years 1. Q: How has the coronavirus (COVID-19) crisis affected the following over the past 2 weeks? Figures may not sum to 100% because of rounding. Household income Household spending Household savings Nov 2020 Feb 2021 Oct 2021 Nov 2020 Feb 2021 Oct 2021 Nov 2020 Feb 2021 Oct 2021 COVID-19 impact on household finances,1 % of respondents Reduce slightly/a lot Increase slightly/a lot About the same
  • 8. McKinsey & Company 8 Almost 40 percent of consumers expect their finances will return to normal in 2022 or later Slow recovery expected| Current as of October 2021 56 55 54 62 42 43 44 36 Gen Z Gen X 2 Baby boomers3 2 Millennials 2 2 57 59 41 40 2 Vaccinated 1 Unvaccinated In 2021 In or after 2022 Not affected/already returned 57 41 2 Overall 1. Q: When do you expect your personal/household finances will return to normal? Figures may not sum to 100% because of rounding. 2. Q: Which best describes your vaccination status? 3. Baby boomers includes silent generation. Source: McKinsey & Company COVID-19 Japan Consumer Pulse Survey, 10/18–10/20/2021, n = 1,014, sampled and weighted to match Japan general population 18+ years By generation By vaccination status2 Baby boomers are the most positive about when their finances will return to normal Expectations for finances returning to normal are unrelated to vaccination status Expectations on personal/household finances returning to normal,1 % of respondents
  • 9. McKinsey & Company 9 Slow recovery expected| Current as of October 2021 Intent to splurge is greatest among higher-income Gen Z consumers; intent for high-income Gen X has dropped 13 points 1. Q: With regard to products and services you will spend money on, do you plan to splurge/treat yourself in 2021? For example, are there categories of products or services you have spent less on over the last year and half which you feel you will spend more on now? 2. Baby Boomers includes silent generation. 3. Small sample size (n < 25) Source: McKinsey & Company COVID-19 Japan Consumer Pulse Survey, 10/18–10/20/2021, n = 1,014; 2/24–2/27/2021, n = 1,014, sampled and weighted to match Japan general population 18+ years Feb 2021 73 72 28 27 Oct 2021 Plan on splurging Do not plan on splurging Millennials Gen X Baby boomers2 44% 4 26%3 −20 Gen Z 52% −6 40% 11 32% −4 34% −1 16% 3 19% 2 28% 1 26% 9 27% −3 20% −13 Generation 2 Respondents who plan/do not plan to splurge/treat themselves in 20211 % of respondents Low (<4M yen/year) Middle (4M–8M yen/year) High (>8M yen/year) >70% <30% 50–70% 30–50% p.p. change from Feb 2021 XX Respondents who plan to splurge, by household income, % Change < −10 pp .
  • 10. McKinsey & Company 10 Tourism is the biggest category driven by baby boomers; younger generations want to splurge on fashion and cosmetics Slow recovery expected| Current as of October 2021 Categories where consumers intend to treat themselves1 % of all respondents with intent to splurge 1. Q: You mentioned that you plan to splurge/treat yourself in next 6 months. Which categories do you intend to treat yourself to? Please select all that apply. 2. Baby boomers includes silent generation. 43 34 32 22 15 15 11 10 9 7 5 5 4 Personal services Travel, lodging, and vacation Electronics Apparel, shoes, accessories Items for your home Restaurants, dining out, bars Out-of-home entertainment Makeup and skin care Sports apparel and equipment Outdoor living Fitness, sports, and outdoors Household essentials Pets Millennials Gen X Gen Z Baby boomers2 24 37 45 60 49 42 28 24 19 35 25 43 30 34 15 9 14 15 19 12 16 13 15 16 11 15 9 9 8 16 8 7 11 12 9 4 By generation 5 12 5 3 5 9 3 3 11 8 1 1 8 8 Change from Feb 2021, percentage points Source: McKinsey & Company COVID-19 Japan Consumer Pulse Survey, 10/18–10/20/2021, n = 1,014; 2/24–2/27/2021, n = 1,014, sampled and weighted to match Japan general population 18+ years Between −3 and 3 < −3 >3 −6 −4 −7 N/A 9 −1 −7 N/A N/A N/A −3 −2 N/A Categories Difference from all respondents, percentage points
  • 11. McKinsey & Company 11 Though still negative, net spending intent has increased for fashion and self-care since February 2021 Slow recovery expected| Current as of October 2021 Net intent >1 Net intent −15 to 0 Net intent: < −15 Source: McKinsey & Company COVID-19 Japan Consumer Pulse Survey. 10/18–10/20/2021, n = 1,014; 2/24–2/27/2021, n = 1,014; sampled and weighted to match Japan general population 18+ years 12 12 13 19 31 15 19 34 23 11 7 11 14 12 6 8 16 11 8 15 7 12 7 7 11 6 Groceries Quick-service restaurant Restaurant Alcohol Tobacco products Toys and baby supplies 10 4 Food takeout and delivery 3 Footwear Apparel 2 Jewelry 4 Accessories 2 Household supplies 4 4 Personal-care products Skin care and makeup 5 Home and furniture 10 Kitchen and dining Sports and outdoors Home improvement, garden Decrease Stay the same Increase 6 9 11 25 6 16 12 16 12 15 55 32 52 33 35 6 23 6 7 16 6 12 16 8 16 16 18 20 16 12 Travel by car Consumer electronics Books, magazines, newspapers Vehicles Pet food and supplies 5 5 4 1 Vitamins and OTC medicine Entertainment at home Out-of-home entertainment Pet-care services Fitness and wellness Personal-care services Gasoline 10 Short-term home rentals Cruises3 Adventures and tours 10 International flights Hotel/resort stays Domestic flights Net intent2 22 -3 -4 -9 0 -4 -8 0 4 1 -37 -12 -42 -17 1 -2 1. Q: Over the next 2–3 months, do you expect that you will spend more, about the same, or less money on these categories than usual? Figures may not sum to 100% because of rounding. 2. Net intent is calculated by subtracting the % of respondents stating they expect to decrease spending from the % of respondents stating they expect to increase spending. 3. Small sample size (n < 25) in Oct 2021 survey. 4. Small sample size (n < 25) in Feb 2021 survey. Expected spending per category over the next 2–3 months vs usual1 % of respondents who bought these categories at least once since 2019 -3 -3 -10 0 +13 +27 +10 +14 +13 +13 +9 +3 0 +8 +3 +12 -6 +4 Change since Feb 2021 percentage points Change since Feb 2021 percentage points -1 -2 -1 +3 0 +6 +24 +17 +13 +13 +8 +7 +374 +8 +134 +45 +29 +37 -23 +32 Net intent2 -32 6 1 5 -6 -4 4 -2 -11 -16 -12 -12 -19 0 0 -4 -1 0
  • 12. McKinsey & Company 12 0 −40 10 −50 −30 −10 −20 20 Mar 2020 Apr 2020 May 2020 June 2020 Sept 2020 Nov 2020 Feb 2021 Oct 2021 Expected spending per category over the next 2–3 months vs usual1 Net intent2 Source: McKinsey & Company COVID-19 Japan Consumer Pulse Survey, 10/18–10/20/2021, n = 1,014; 2/24–2/27/2021, n = 1,014; 11/9–11/15/2020, n = 1,039; 9/22–9/28/2020, n = 1,034; 6/19–6/22/2020, n = 664; 5/22–5/24/2020, n = 600; 4/17–4/19/2020, n = 600; 4/10–4/12/2020, n = 600;4/3–4/5/2020, n = 600;3/28–3/29/2020, n = 600, sampled and weighted to match Japan general population 18+ years Increased spend intent expected across most categories over next several months Groceries Skin care and makeup Household supplies Fitness and wellness Consumer electronics ​Personal-care products Apparel 1. Q: Over the next 2–3 months, do you expect that you will spend more, about the same, or less money on these categories than usual? Figures may not sum to 100% because of rounding. 2. Net intent is calculated by subtracting the % of respondents stating they expect to decrease spending from the % of respondents stating they expect to increase spending. Slow recovery expected| Current as of October 2021
  • 13. McKinsey & Company 13 1. Q: Which best described how you have researched the following categories over the last 3 months? 2. Q: Which best describes how you have purchased the following categories over the last 3 months? 24 2 Meal at quick-service restaurant 51 58 Alcoholic beverages 12 Books, magazines, and newspapers 2 44 Over-the-counter medicine 54 Food takeout/delivery 1 Household supplies 44 3 12 53 Tobacco products and smoking supplies 58 59 4 39 40 Groceries 59 4 57 Personal-care products 61 39 61 Footwear Meal at restaurant 13 4 38 Home improvement, gardening supplies 37 23 31 Kitchen and dining 3 61 36 18 Pet food and supplies 27 51 61 27 Apparel 66 15 27 61 26 47 9 10 18 59 68 23 Home decoration and furniture 19 59 Skin care and makeup Accessories 16 62 22 Sports and outdoors equipment, supplies 16 63 21 Consumer electronics 22 In store Omnichannel Online In each product category, about 50 to 60 percent of consumers use omnichannel to search for and purchase products Omnichannel is ascendant | Current as of October 2021 Product searches1 and purchases2 by channel % of respondents who purchased and searched these categories in the last 3 months Source: McKinsey & Company COVID-19 Japan Consumer Pulse Survey, 10/18–10/20/2021, n = 1,014, sampled and weighted to match the Japan’s general population 18+ years
  • 14. McKinsey & Company 14 In nine of 16 categories, more than one in five consumers, mainly younger generations, say they were influenced by social media Omnichannel is ascendant| Current as of October 2021 1. Q: Think about the purchases you have made in the following categories over the past 3 months. Were you influenced toward a certain brand by a post on social media in the following categories? 2. Baby boomers includes silent generation. 3. Small sample size (n < 25). 28 28 25 24 24 23 22 22 21 19 18 16 16 15 Books, magazines, and newspapers Toys and baby supplies Home improvement and gardening supplies Skin care and makeup Accessories Meal at restaurant Meal at quick-service restaurant Sports and outdoors equipment, supplies Food takeout/delivery Apparel Consumer electronics Home decoration and furniture Vitamins, supplements, and over-the-counter medicine Alcoholic beverages Millennials Gen X Gen Z Baby boomers2 353 37 183 163 413 36 193 143 47 38 17 133 52 30 18 15 47 28 17 17 313 323 153 213 403 31 123 153 By generation 353 38 16 11 323 33 153 16 423 29 153 113 293 243 153 93 Source: McKinsey & Company COVID-19 Japan Consumer Pulse Survey, 10/18–10/20/2021, n = 1,014, sampled and weighted to match Japan general population 18+ years Between −3 and 3 < −3 >3 Categories Categories where respondents were influenced by social media1 % of all respondents who purchased in these categories in the last 3 months 133 263 203 303 163 18 73 133 14 173 18 113 Difference from all respondents, percentage points
  • 15. McKinsey & Company 15 44 59 3 52 62 25 58 31 6 7 61 35 40 7 40 0 66 3 31 56 2 38 53 44 6 8 39 36 54 7 48 32 42 10 61 58 39 61 0 3 0 52 3 49 11 36 73 71 21 39 17 Source: McKinsey & Company COVID-19 Japan Consumer Pulse Survey, 10/18–10/20/2021, n = 1,014, sampled and weighted to match Japan general population 18+ years Consumers having used alternatives to normal in-store shopping report using them as often or more frequently in the last three months Omnichannel is ascendant | Current as of October 2021 Frequency of using/doing1 % shown among consumers who have participated in the activity in the last 3 months Drive-thru line for a fast-food restaurant Curbside pickup from a restaurant Used a food delivery provider Self-checkout or scan-and-go at a physical store Buy online, pick up in store Curbside delivery at a store Purchased secondhand products online Downloaded/used deal-finding plug-ins Downloaded/used a new store/restaurant app Purchased directly from social media Used an app/website for same-day delivery Used an app/website for delivery within 2 hours Shopped at a store I had not shopped at before for groceries Changed my primary grocery store Cooked regularly for myself/my family Personal care/grooming at home Tried making something myself/DIY project Using less Using more Using same 14 5 12 35 10 5 12 3 10 4 3 3 7 6 38 14 5 Used or did in last 3 months % of total respondents 1. Q: And have you used or done any of the following in the last 3 months? If yes, Q: Which best describes when you have done or used each of these items?
  • 16. McKinsey & Company 16 Few consumers indicate recent use of most digital services, but consumers who have used them report more frequently usage Source: McKinsey & Company COVID-19 Japan Consumer Pulse Survey, 10/18–10/20/2021, n = 1,014, sampled and weighted to match Japan general population 18+ years Omnichannel is ascendant | Current as of October 2021 46 62 59 6 35 37 0 80 3 20 50 4 73 29 67 4 30 63 34 3 55 57 43 2 2 78 72 21 0 1 26 2 56 44 0 43 0 1 47 3 53 30 25 67 67 45 53 2 Frequency of participating1 % shown among consumers who have participated in the activity in the last 3 months Wellness app2 Online personal training/fitness Grocery delivery Restaurant food delivery Meal kit delivery Online streaming Video conferencing for professional use Virtual hangouts and video chats for personal use Telemedicine for physical health care2 Telemedicine for mental health care2 Playing online games Watching online games Remote learning for myself Remote learning for my kids Used social media Used TikTok 2 2 10 14 3 25 14 5 1 4 3 2 8 4 43 5 Used or did in last 3 months % of total respondents Using less Using same Using more 1. Q: Have you used or done any of the following since the coronavirus (COVID-19) crisis started? If yes, Q: Which best describes when you have done or used each of these items? 2. Small sample size (n < 25).
  • 17. McKinsey & Company 17 When a product was unavailable, over 40 percent of consumers in that situation did not buy anything Divided loyalty | Current as of October 2021 1. Q: Over the last 3 months, have you wanted to buy something and not been able to purchase it because it was out of stock or otherwise not available? 2. Q: The most recent time this happened (when you wanted to buy something and it was not available), what did you do? Source: McKinsey & Company COVID-19 Japan Consumer Pulse Survey, 10/18–10/20/2021, n = 1,014; sampled and weighted to match Japan general population 18+ years 78 22 Could not purchase at least 1 item Able to purchase all items Oct 2021 Respondents who planned to purchase something but could not, due to unavailability1 % of respondents 29 12 5 11 43 Bought the product at a different retailer Did not buy anything Bought a different brand or similar product at a different retailer Bought a different product at the same retailer Waited until the product was available at the same retailer Consumer responses to stockouts2 % of respondents who could not make a planned purchase
  • 18. McKinsey & Company 18 27 11 9 8 7 7 Any new shopping behavior Different retailer/store/website Different brand New shopping method2 New digital shopping method Private label/store brand Divided loyalty | Current as of October 2021 Source: McKinsey & Company COVID-19 Japan Consumer Pulse Survey, 10/18–10/20/2021, n = 1,014, sampled and weighted to match Japan general population 18+ years Gen Z Millennials 49 37 16 17 24 13 22 12 11 9 19 14 By generation All consumers Between −3 and 3 < −3 >3 1. Q: Over the past 3 months, which of the following have you done? 73% replied “None of these.” 2. “New shopping method” includes curbside pickup and delivery apps. 3. Baby boomers includes silent generation. Behaviors in past 3 months1 % of respondents Less than one-third of Japanese consumers report having tried out new shopping behaviors in the past three months Difference from all respondents, percentage points Gen X Baby boomers3 20 19 7 10 5 5 7 3 5 4 4 2
  • 19. McKinsey & Company 19 Reason for trying a new brand since COVID-19 began1 % of respondents who tried a new brand since COVID-19 began Divided loyalty | Current as of October 2021 1. Q: You mentioned you tried a new/different brand than what you normally buy. What were the main reasons that drove this decision? Select up to 3 relevant reasons. “Brand” includes different brand, new private label/store brand. Overarching reason based on % of individual respondents responding to at least 1 reason in the group. 2. Baby boomers includes silent generation. Source: McKinsey & Company COVID-19 Japan Consumer Pulse Survey, 10/18–10/20/2021, n = 1,014, sampled and weighted to match Japan general population 18+ years Better prices/promotions Cleaner/has better hygiene measures Better shipping/delivery cost Better value Is natural / organic Larger package sizes 20 Wanted to try a type of product I’ve never tried before Better quality Wanted to try a new brand I found Wanted variety/a change from my normal routine 27 Wanted to treat myself 3 Shares my values 16 The company treats its employees well Is more sustainable/better for the environment Supporting local businesses 20 Is available where I’m shopping 31 Products are in stock 25 12 8 9 24 4 3 1 13 6 6 Purpose-driven Convenience Quality/organic Personal choice Availability Health/hygiene Novelty 38 Value 43 37 32 30 6 6 13 Baby boomers2 Gen Z and millennials Gen X 21 24 32 10 20 8 8 4 12 0 4 8 33 28 16 12 36 20 29 40 28 13 4 4 19 4 36 25 12 0 25 36 8 6 0 4 2 0 8 0 4 0 8 12 24 4 4 12 10 4 0 All consumers Between −3 and 3 < −3 >3 For the 9 percent of respondents who tried a new brand, value and novelty seem to be the key drivers x Net % of respondents per category Difference from all respondents, percentage points
  • 20. McKinsey & Company 20 Modified return to out-of-home | Current as of October 2021 24 15 29 27 19 Jun 2020 Oct 2021 Feb 2021 Nov 2020 Sep 2020 Overall Vaccinated Unvaccinated 23% 28% Gen Z Millennials Gen X 19% Baby boomers 34% 26% 25% 24% Low (<4M yen) 22% High (>8M yen) Medium (4M–8M yen) 28% 1. Q: Which best describes when you will regularly return to stores, restaurants, and other out-of-home activities? Chart shows those already participating in these activities. 2. Gen Z are people under 25 years old, millennials are 25–44 years old, Gen X are 45–54 years old, and baby boomers are 55 years old and above, including silent generation. Source: McKinsey & Company COVID-19 Japan Consumer Pulse Survey, 10/18–10/20/2021, n = 1,014; 2/24–2/27/2021, n = 1,014; 11/9–11/15/2020, n = 1,039; 9/22–9/28/2020, n = 1,034; 6/19–6/22/2020, n = 664, sampled and weighted to match Japan general population 18+ years By generation2 By vaccination adoption By income 34% of Gen Z are doing out- of-home activities 28% of higher income households are doing out-of-home activities 28% of people that are unvaccinated are doing out-of-home activities Consumers engaging in ‘normal’ out-of-home activities,1 % of respondents About one-fourth of consumers, including one-third of Gen Z consumers, say they have returned to normal out-of-home activities
  • 21. McKinsey & Company 21 Out-of-home activities done in the past 2 weeks1 % shown for respondents who engaged in the activity at least once prior to COVID-19 Modified return to out-of-home | Current as of October 2021 Source: McKinsey & Company COVID-19 Japan Consumer Pulse Survey, 10/18–10/20/2021, n = 1,014, sampled and weighted to match Japan general population 18+ years 1. Q: Did you leave your house for the following activities over the past 2 weeks? Social Personal care Entertain- ment 53 15 10 11 18 35 48 20 21 Get together with family Attend an indoor cultural event Dine indoors at a restaurant or bar Go out for family entertainment Go to a hair or nail salon Attend an outdoor event Go to the gym or fitness studio Visit a crowded outdoor public place Get together with friends 86 93 71 46 28 56 28 10 49 13 44 Go to a shopping mall Work outside my home Shop for groceries/necessities Shop for non-necessities Travel by airplane Use a ride-sharing service Travel more than 2 hours by car Use public transportation Travel by train Stay in a hotel Rent a short-term home Work Shopping Transport/ travel ≥50% <50% A high percentage of consumers now work outside of home; more than half of consumers shop, eat out, and use public transportation
  • 22. McKinsey & Company 22 1. Q: With the rise of the Delta variant of COVID-19, how, if at all, has your out-of-home behavior changed? Source: McKinsey & Company COVID-19 Japan Consumer Pulse Survey, 10/18–10/20/2021, n = 1,014, sampled and weighted to match Japan general population 18+ years 20 18 14 28 29 29 49 52 55 Medium (4M–8M yen) Low (<4M yen) 3 1 2 High (>8M yen) Modified return to out-of-home | Current as of October 2021 16 21 29 28 53 48 3 2 Vaccinated Unvaccinated 17 29 52 Engage less Engage more Overall 2 Engage with adjusted behavior Engage same as before Delta By income By vaccination status Lower-income consumers are the likeliest income group to indicate they engage the same as or more than before Delta Vaccinated consumers are likelier than unvaccinated to report adjusting their behavior Adjustments to out-of-home behavior due to prevalence of Delta variant,1 % of respondents About half of consumers reduced engagement in out-of-home activities due to the Delta variant; 30 percent engage differently
  • 23. McKinsey & Company 23 Modified return to out-of-home | Current as of October 2021 Source: McKinsey & Company COVID-19 Japan Consumer Pulse Survey, 10/18–10/20/2021, n = 1,014, sampled and weighted to match Japan general population 18+ years 1. Q: Which best describes how you are engaging in each of these activities? Possible answers: “Not doing this at all”; “Doing this in the same way as pre-COVID-19, but less often”; “Doing this in a modified way vs. pre-COVID-19”; “Doing this just as much and in the same way as I did pre-COVID-19.” Work Shopping Transport/ travel Social Personal care Entertain- ment 65 30 70 Dine indoors at a restaurant or bar 35 Go out for family entertainment 34 66 Attend an indoor cultural event 57 43 Attend an outdoor event 70 49 Visit a crowded outdoor public place 68 32 51 Go to a hair or nail salon 36 30 64 Go to the gym or fitness studio 69 31 Get together with family Get together with friends 64 47 81 Work outside my home 36 Shop for groceries/necessities 53 42 Shop for non-necessities 41 46 68 34 33 Go to a shopping mall 66 19 Rent a short-term home 54 Use public transportation 58 41 59 Use a ride-sharing service Travel by airplane 57 43 Travel by train 63 37 Stay in a hotel 59 Travel more than 2 hours by car Doing less, doing in a modified way Doing as much as and in the same way as pre-COVID-19 Japanese consumers are likeliest to have modified out-of-home behavior for work and fitness; social activities are priorities Out-of-home activities engagement1 % of respondents engaging in these activities today
  • 24. McKinsey & Company 24 Main life events done in the last 12 months as a result of COVID,1 % of respondents Modified return to out-of-home | Current as of October 2021 Source: McKinsey & Company COVID-19 Japan Consumer Pulse Survey 10/18–10/20/2021, n=1,014; 2/24–2/27/2021, n = 1,014; sampled and weighted to match Japan general population 18+ years Change >3 pp 10 4 2 3 2 2 2 2 1 2 1 Worked more from home Got a new pet at home (eg, dog, cat) Moved into a smaller home Decided to change jobs Renovated/remodeled my home Started homeschooling children Set up a specific work-from-home space Set up a gym at home Moved into a bigger home Bought a property Sold a property Work/study change Oct 2021 Pet adoption House move Home renovation Investments/ divestments Total2 Change from Feb 2021, percentage points 0 −1 0 0 0 1 0 0 −2 1 1 2 14 3 6 2 1. Q: Which of the following have you done in the last 12 months as a result of the COVID-19 crisis? 2. Total percentage of people who choose option(s) in the category. Few consumers made major changes to their living environment due to COVID-19
  • 25. McKinsey & Company 25 Over half of consumers are neutral toward the 2021 holiday shopping season; Gen Z are more excited, millennials more anxious Holiday Outlook | Current as of October 2021 23 37 30 29 48 47 58 65 29 16 12 6 Baby boomers2 Gen Z Millennials Gen X Source: McKinsey & Company COVID-19 Japan Consumer Pulse Survey, 10/18–10/20/2021, n = 1,014, sampled and weighted to match Japan general population 18+ years 1. Q: Which best describes your general attitude toward the holiday shopping season? Selected from "Anxious," "Stressed," "Neutral," "Eager,“ "Excited," and "Other." 2. Baby boomers includes silent generation. 31 57 12 Stressed/ anxious Overall Excited/ eager Neutral Consumer attitudes toward the 2021 holiday shopping season1 % of respondents By annual income By generation 33 28 31 55 60 55 12 12 14 Low (<4M yen) Medium (4M–8M yen) High (>8M yen)
  • 26. McKinsey & Company 26 Majority of consumers plan to spend about the same as last year across categories during 2021 holidays Holiday Outlook | Current as of October 2021 15 Gifts (for myself and others) 20 65 Large household appliances 3 6 Personal travel2 26 Out-of- home eating 60 17 65 18 88 6 70 20 27 Redecorate my home, put out seasonal items 20 Family travel 4 70 Source: McKinsey & Company COVID-19 Japan Consumer Pulse Survey, 10/18–10/20/2021, n = 1,014, sampled and weighted to match Japan general population 18+ years 1. Q: If you compare the upcoming holidays 2021 with the ones last year, how much do you plan to change your spending level in the following categories? 2. Small sample size (n < 25). Will spend more Will spend about the same Will spend less 2021 holiday spending plans vs spending in 20201 % of respondents who spent on the category during the holidays in 2020 Almost 90% of consumers do not intend to change their gif- buying behavior for the holidays this year Home-related purchases see the largest share of consumers reporting they will spend less
  • 27. McKinsey & Company 27 Half of consumers plan to browse in stores for the holiday season; younger consumers over-index on using social media and websites Holiday Outlook | Current as of October 2021 50 28 25 22 20 15 5 4 3 Browsing in stores Browsing through holiday markets Offline advertisements2 Social media Retailer websites Brand websites Advertisements on TV or streaming media Emails from relevant retailers Browsing in pop-up stores By generation Gen Z 48 20 Millennials 51 25 Gen X 54 20 Baby boomers3 46 8 7 2 1 7 3 5 5 26 12 15 16 19 17 25 40 17 46 38 21 15 4 5 5 1 24 30 23 16 Research channels Between −3 and 3 < −3 >3 Difference from all respondents, percentage points 1. Q: Which channels are you planning to use to get new ideas and do research for your holiday shopping? Please select top 3. 2. Offline advertisements include catalogs, fliers, magazines, and newspaper advertisements. 3. Baby boomers includes silent generation. Consumer research plans by channel for holiday 20211 % of all respondents Source: McKinsey & Company COVID-19 Japan Consumer Pulse Survey, 10/18–10/20/2021, n = 1,014, sampled and weighted to match Japan general population 18+ years
  • 28. McKinsey & Company 28 In all but the oldest generation, over half of consumers expect social media to influence their purchase decisions Holiday Outlook | Current as of October 2021 Source: McKinsey & Company COVID-19 Japan Consumer Pulse Survey, 10/18–10/20/2021, n = 1,014, sampled and weighted to match Japan general population 18+ years 1. Q: How much influence do you expect social media to have on your holiday purchase decisions this season? Selected from "Significant influence," "Some influence," and "Will not influence." 2. Q: Which channels do you think will influence your holiday purchase decisions? Asked of respondents indicating social media will influence their 2021 holiday purchases. 3. Baby boomers includes silent generation. Expected influence of social media on 2021 holiday purchases,1 % of respondents 44 28 37 47 52 56 72 63 53 48 Baby boomers3 Gen Z Overall Millennials Gen X Will not influence Will influence 52 48 63 5 16 2 0 56 46 47 13 5 4 2 23 47 27 19 2 3 0 8 32 14 13 0 1 0 33 43 32 14 4 2 1 Respondents who expect social-media influence2 % of respondents YouTube Instagram Twitter Facebook TikTok Pinterest Snapchat Top 3 platforms by %
  • 29. McKinsey & Company 29 Three-quarters of Japanese consumers plan to avoid travel and limit the size of social gatherings for the upcoming holiday Holiday Outlook | Current as of October 2021 1. Q: What best describes what you expect to do for the holidays this year [2021]? Figures may not sum to 100% because of rounding. 2. Q: What best describes your holiday get togethers last year [2020]? Figures may not sum to 100% because of rounding. 3. Baby boomers includes silent generation. Source: McKinsey & Company COVID-19 Japan Consumer Pulse Survey 10/18–10/20/2021, n = 1,014, sampled and weighted to match Japan general population 18+ years 4 9 11 76 Do not plan to travel and will limit getting together to immediate family only Will not travel but will have a family/friends get-together outside my immediate family Will travel to and attend a large get- together with family and friends Will travel to a limited family get-together By annual income By generation 5 4 6 0 1 3 6 1 4 10 14 12 12 10 3 6 8 13 12 23 13 7 2 8 87 74 69 60 71 77 −5 85 Medium (4M–8M yen) Low (<4M yen) High (>8M yen) Millennials Gen X Gen Z Baby boomers3 Change from 2020,2 percentage points Holiday plans in 20211 % of respondents < −3 Between −3 and 3 >3 Difference from all respondents, percentage points
  • 30. McKinsey & Company 30 Consumers across all generations expect fewer in-person holiday- related events than before COVID-19 Holiday Outlook | Current as of October 2021 1. Q: About how many in-person holiday-related events do you attend in a typical year without COVID-19? 2. Q: Compared with the number of in-person events you attended pre-COVID-19, about how many in-person events do you expect to attend over the holidays this coming year [2021]? 3. Baby boomers includes silent generation. 2.2 0.6 0.5 Family gatherings Parties with friends Work-related gatherings Source: McKinsey & Company COVID-19 Japan Consumer Pulse Survey 10/18–10/20/2021, n = 1,014, sampled and weighted to match Japan general population 18+ years Event type Between −1 and 1 < −1 >1 Millennials Gen X Gen Z Baby boomers3 By generation 1.9 2.3 2.4 2.1 1.5 1.0 0.5 0.3 0.7 0.7 0.8 0.2 Difference in number vs pre-COVID-19 −1.2 −1.4 −1.2 Holiday-related events consumers attended1 or expect to attend2 in 2021 Average number of events Difference from all respondents, percentage points
  • 31. McKinsey & Company 31 1. Q: Do you plan to shop for the holidays earlier or later in 2021 compared with last year’s holiday season [2020]? Possible answers: “significantly earlier”; “slightly earlier”; “starting at about the same time”; “slightly later”; “significantly later”; “I am not planning to do any holiday season shopping.” 18% of Japanese consumers indicated they do not plan to shop for the holidays. Figures may not sum to 100% because of rounding. 2. Income levels: low, <4 million yen; medium, 4 million–8 million yen; high, >8 million yen per year. 3. Baby boomers includes silent generation. 4. Q: What are the primary reasons you plan to shop earlier for the holidays in 2021? 5 78 17 16 Low 5 79 2 Medium 19 79 High 17 Overall 78 5 Earlier Later About the same time Source: McKinsey & Company COVID-19 Japan Consumer Pulse Survey, 10/18–10/20/2021, n = 1,014, sampled and weighted to match Japan general population 18+ years Overall By income2 By generation 9 Gen Z 82 20 5 Gen X 71 27 5 68 Millennials 16 2 83 13 Baby boomers3 Roughly 80 percent of consumers report no plans to change the start of their holiday shopping Holiday Outlook | Current as of October 2021 Main reasons for consumers to start shopping earlier4 % of respondents who plan to shop earlier in 2021 27% 21% 18% 52% Holiday shopping start vs last year1 % of respondents who plan to shop for the holidays this year of Japanese consumers are concerned about availability are concerned about shipping lead time want to do something fun right now are concerned about unexpected challenges due to COVID-19
  • 32. McKinsey & Company 32 Eighty percent of consumers indicate they will start holiday shopping in December this year Holiday Outlook | Current as of October 2021 Source: McKinsey & Company COVID-19 Japan Consumer Pulse Survey 10/18–10/20/2021, n = 1,014, sampled and weighted to match Japan general population 18+ years 4 14 80 2 In December I already started In November In January 60% 25% 15% 75–100% of my shopping 50–74% of my shopping 1–49% of my shopping 1. Q: When do you plan to start your shopping for the seasonal holidays this year? Figures may not sum to 100% because of rounding. 2. Q: How much of your holiday season shopping have you done so far? Question asked of respondents who have indicated they already started. Small sample size (n < 25). Timing of holiday shopping, 20211 % of respondents who plan to shop for the holidays this year Status of holiday shopping, 20212 % of respondents having already started
  • 33. McKinsey & Company 33 Just 14 percent of consumers plan to shop at a different place than last year for the holidays; safety is their top reason to change Holiday Outlook | Current as of October 2021 Source: McKinsey & Company COVID-19 Japan Consumer Pulse Survey 10/18–10/20/2021, n = 1,014, sampled and weighted to match Japan general population 18+ years 6 5 5 Safety More value for money Check more things off my list at once 44 21 14 10 8 6 Shop earlier Any change of shopping behavior Shop more online Shop more in person Shop at a different place Shop more at local/independent stores 1. Q: Please select all the ways you anticipate your holiday shopping might be different from last year. Figures may not sum to 100% because of rounding. Anticipated different holiday shopping behaviors1 % of respondents who said they would shop differently than last year Reasons to change place to shop during holiday season % of respondents who said they will do holiday shopping this year
  • 34. McKinsey & Company 34 One-fifth of consumers plan to shop more online this year; intent is greatest for younger and higher-income consumers Holiday Outlook | Current as of October 2021 21 10 8 Shop more online Shop more in person Shop earlier By income Gen Z Millen- nials Gen X Baby boom- ers2 Shopping behaviors Between −3 and 3 < −3 >3 Difference from all respondents, percentage points 1. Q: Please select all the ways you anticipate your holiday shopping might be different compared to last year. Figures may not sum to 100% because of rounding. 2. Baby boomers includes silent generation. Anticipated shopping behavior change for Holiday 20211, % of all respondents By generation 31 20 34 13 13 10 9 9 6 13 8 3 16 23 27 4 12 13 6 8 9 Medium (4M–8M yen) Low (<4M yen) High (>8M yen) Source: McKinsey & Company COVID-19 Japan Consumer Pulse Survey 10/18–10/20/2021, n = 1,014, sampled and weighted to match Japan general population 18+ years
  • 35. McKinsey & Company 35 Consumers say value and convenience are the top two considerations driving their decisions of where to shop Holiday Outlook | Current as of October 2021 Source: McKinsey & Company COVID-19 Japan Consumer Pulse Survey 10/18–10/20/2021, n = 1,014, sampled and weighted to match Japan general population 18+ years 37 26 34 19 39 26 8 5 16 7 3 5 Companies treating its employees well Convenience Better prices/promotions Better shipping/delivery costs Easy to shop across store and online Offers unique items Ability to purchase most gifts from 1 place Ability to see products in person Better quality Product availability Cleaner/better hygiene measures Supporting local businesses By generation 45 32 23 33 34 7 2 5 20 5 10 Gen Z 38 38 20 34 24 9 6 6 7 4 3 21 Millennials 31 37 30 32 20 11 3 5 16 4 5 22 Gen X 37 41 27 36 25 8 2 4 13 5 6 17 Baby boomers2 17 1. Q: Please tell us what your primary considerations will be when deciding where to shop. Please select up to 3. 2. Baby boomers includes traditional or silent generation. Between −3 and 3 < −3 >3 Primary considerations when deciding where to shop1 % of respondents Availability Value Convenience Quality Purpose-driven Uniqueness Health/hygiene 48 52 x Net % of respondents per category 36 39 16 9 5 Difference from all respondents, percentage points