SlideShare une entreprise Scribd logo
1  sur  44
Télécharger pour lire hors ligne
EMBARGOED UNTIL 12:01 AM ON JUNE 4, 2018
1
An Impact Analysis of North Carolina’s Opportunity Scholarship Program on Student
Achievement
Anna J. Egalite
D.T. Stallings
Stephen R. Porter
North Carolina State University
Working Paper
Abstract
The North Carolina Opportunity Scholarship Program is a statewide private school voucher
program, enacted in 2013 and launched in 2014 to provide state-funded vouchers worth up to
$4,200 to eligible students entering Kindergarten through twelfth grade. Because public schools
administer the criterion-referenced state test, whereas private schools administer any nationally
normed test of their choosing, the research team recruited 698 students from the public and
private school sectors to take a common third-party nationally-normed standardized test in spring
2017. Relying on baseline achievement and demographic data from the North Carolina
Department of Public Instruction, a matching approach is utilized to maximize comparability
between the public and private school student samples. Our preferred specification utilizes
observations from 245 public and private students, controlling for a host of covariates, revealing
first year impact estimates of .36 SD in math and .44 SD in language. Policy implications are
discussed.
Keywords: school choice; education policy; vouchers; academic achievement; private schooling
EMBARGOED UNTIL 12:01 AM ON JUNE 4, 2018
2
An Impact Analysis of North Carolina’s Opportunity Scholarship Program on Student
Achievement
Established by North Carolina General Statute 115C-562 in 2013 and launched in the
2014-15 school year, the North Carolina Opportunity Scholarship Program provides state-funded
vouchers of up to $4,200 per year for eligible students in kindergarten through twelfth grade to
attend participating private schools. The program is funded by an annual appropriation
established during the biennial state budget process and administered by the North Carolina State
Education Assistance Authority (SEAA). Since the inception of the program in 2014-15, nearly
$53 million dollars have been disbursed in scholarship funds.
This analysis focuses on identifying the impact of the North Carolina Opportunity
Scholarship Program on participating students’ academic achievement in math and reading.
Although the legislation that established the program calls for an evaluation of the “learning
gains or losses of students receiving scholarship grants,” as compared to similar students in
public schools, no such evaluation has been conducted until now. Two primary challenges have
inhibited an evaluation to date. First, the accountability requirements associated with the
program require participating non-public schools to administer and submit scores from any
nationally-normed standardized test of their choosing, whereas comparable public school
students take the criterion-referenced state test, the North Carolina End of Grade exam. Thus,
participating students do not have scores on a common metric that could be pooled for
comparison to students in the public school sector. Second, although the establishing legislation
calls for an evaluation of the program, it doesn’t incentivize applicants to participate in one, for
example as a condition for applying to the program. This introduces recruitment challenges with
regard to the collection of original test score data.
EMBARGOED UNTIL 12:01 AM ON JUNE 4, 2018
3
In the spring of 2017, this research team traveled to the four regions of North Carolina
with the highest number of Opportunity Scholarship users. Relying on a volunteer sample of
students in the public and private school sectors in those regions, we administered Form E of the
Iowa Test of Basic Skills—a nationally-normed standardized assessment of math and reading
achievement. Using inverse propensity weights in a regression model to compare similar public
school students to those students attending private schools with an Opportunity Scholarship, we
generate impact estimates in mathematics, reading, and language. Although we do not claim to
present causal estimates of the program impact, we can account for observed differences between
the two groups in terms of demographic characteristics, disciplinary records, and prior test
scores. The effect sizes observed are positive, large, and statistically significant, ranging from .25
to .49 standard deviations (henceforth SD).
Background
Program description. North Carolina’s Opportunity Scholarship Program joins a wave
of recently-enacted private school choice programs that feature relatively broad eligibility
criteria, expanding access to an entire state instead of a single city such as earlier programs
established in Cleveland, OH; Milwaukee, WI; or Washington D.C. Compared to similar
programs in other states, students participating in North Carolina’s voucher program are eligible
to receive a relatively modest scholarship of up to $4,200 per year for tuition and fees for books,
transportation, or school equipment (Table 1). Eligibility is determined by a two-part test. First,
the student must meet at least one of the following initial criteria: students must have been
enrolled in a North Carolina public school during the previous semester; students must be
entering kindergarten or first grade; students must have received a scholarship for the previous
semester; students must be in foster care or recently adopted; or students must have a parent or
EMBARGOED UNTIL 12:01 AM ON JUNE 4, 2018
4
legal guardian who is on full-time active duty in the military. Second, students must reside in a
household with an income level that doesn’t exceed 133 percent of the amount required for the
federal free or reduced-price lunch program.
Table One About Here
The youngest of the four programs highlighted here, North Carolina’s Opportunity
Scholarship program is relatively small. In 2016-17, 5,624 students used a state-funded voucher
to attend a private school but changes to the statute in April 2016 added eligibility pathways for
children in military families and the 2016 Appropriations Act called for increasing funds by at
least ten million dollars every year for ten years, which will likely drive up enrollment numbers
in future years. Of the four statewide programs highlighted in Table 1, Florida’s program is the
largest with 98,936 participants in 2016-17, followed by Indiana’s program with 34,299
participants. A notable feature of Florida’s program that has likely contributed to recent
enrollment growth in the program is that students are no longer required to have been enrolled in
a public school before applying for a scholarship. Eligibility is determined solely by household
income or a child’s foster care status. The second-largest program, Indiana’s Choice Scholarship
Program stands out for having the highest number of eligibility pathways by which students can
qualify for the program. With eight pathways in total, Hoosier students can qualify through a
sibling, by applying from a failing public school, or numerous other routes. None of these
pathways allow a student’s household income to exceed 200% of federal free/ reduced price
lunch program limit, however, which ensures the program retains its means-tested focus.
Although currently in third place in terms of student participants (6,995 in 2016-17),
Louisiana’s program has the strictest eligibility criteria. Students older than kindergarten age
must meet the income requirement and be currently attending an underperforming public school.
EMBARGOED UNTIL 12:01 AM ON JUNE 4, 2018
5
Thus, it is reasonable to expect enrollment in North Carolina’s program to overtake Louisiana’s
program in the coming years based on eligibility criteria alone.
Evaluation mandate. The legislation that created the Opportunity Scholarship Program
calls for an evaluation that compares the learning gains or losses of participating students on a
statewide basis (North Carolina General Statute 115C- 562, 2013). One way to accomplish this
task would be to rely on annual test results that are submitted annually to the SEAA and
corresponding records of comparable public school students who took the same assessment. This
is how researchers have evaluated Indiana’s Choice Scholarship Program (Waddington &
Berends, 2017), Ohio’s EdChoice Program (Figlio & Karbownik, 2016), and Louisiana’s
Opportunity Scholarship Program (Abdulkadiroglu, Pathak, & Walters, 2018: Mills & Wolf,
2017), where students in both the public and private school sector took the state assessment.
However, participating schools in North Carolina’s Opportunity Scholarship program are not
required to administer the state test or any other common assessment; rather, they are free to
administer any nationally-normed standardized test of their choosing. This has resulted in
schools’ use of a diverse set of tests from different publishers, which means student performance
cannot be easily compared within the non-public school sector or between the public and non-
public school sectors (Table 2).
<< Table Two About Here >>
Because there is no common metric on which to judge student performance, a second
way to accomplish the task set forth by the legislation would be to invite students to participate
in new data collection efforts, for example by incentivizing or requiring their participation in an
evaluation at the time of application to the program or by reaching out to scholarship recipients
and inviting them to attend an optional test administration session. In such a scenario, researchers
EMBARGOED UNTIL 12:01 AM ON JUNE 4, 2018
6
could administer a common standardized test to a sample of OS students and comparable public
school students with similar socioeconomic backgrounds. This approach has been used to
evaluate the Milwaukee Parental Choice Program (Witte, Carlson, Cowen, Fleming, & Wolf,
2012), the Charlotte Scholarship Fund (Greene, 2001), the Indianapolis Voucher Program
(Weinschrott & Kilgore, 1998) and the Washington D.C. Opportunity Scholarship Program
(Wolf et al., 2013) and it is the approach adopted here to evaluate the academic impact of North
Carolina’s Opportunity Scholarship Program.
Literature Review
Since the establishment of the nation’s first private school choice program in Milwaukee
in 1990, researchers have conducted numerous lottery-based studies to quantify the achievement
impact of these programs, which have been both publicly-funded (such as the voucher programs
in Milwaukee, WI; Cleveland, OH; and Washington D.C.) and privately-funded (such as the
New York City School Choice Scholarships Foundation Program and the Charlotte Scholarship
Fund). In general, these lottery-based studies have revealed small positive impacts overall, with
larger positive impacts observed for subgroups of interest, such as African American students,
students of low socioeconomic status, or students who were initially low-achieving (Table 3).
Table Three About Here
Among the 15 random-assignment studies detailed in Table 1, eight have revealed
positive impacts in math or reading overall or for at least one subgroup of interest (Barnard,
Frangakis, Jin, & Rubin, 2003; Cowen, 2008; Greene, 2001; Greene, Peterson & Du, 1999;
Howell, Wolf, Campbell, & Peterson, 2002; Jin, Barnard, & Rubin, 2010; Rouse, 1998), two
studies revealed null impacts (Bitler, Domina, Penner, & Hoynes, 2014; Krueger & Zhu, 2004),
and three studies revealed negative impacts for the overall sample or for at least one subgroup
EMBARGOED UNTIL 12:01 AM ON JUNE 4, 2018
7
(Abdulkadiroglu, Pathak, and Walters, 2018; Dynarksi, Rui, Webber Gutmann & Bachman,
2017; Mills & Wolf, 2017). Although the weight of the evidence, therefore, points towards a
positive impact associated with voucher usage, the three most recent studies all reveal negative
impacts. This raises interesting questions about the characteristics of contemporary programs and
the contexts in which they’ve been studied.
In Washington D.C., for example, a 2017 lottery analysis of the D.C. Opportunity
Scholarship Program reveals null impacts on reading scores and a statistically significant
negative impact of 7.3 percentile points on the math achievement of students who used a voucher
(Dynarksi, Rui, Webber Gutmann & Bachman, 2017). Given the dramatic spread of charter
schooling in the nation’s capital, it is important to acknowledge that 42 percent of students in the
control group were attending a charter school. Thus, the negative impact of private school
voucher usage in this study should be interpreted as being relative to the impact of attending a
traditional public or a charter school whereas in earlier studies detailed in Table 2, the
counterfactual was almost always a traditional public school.
The other two negative studies in Table 2 are evaluations of the Louisiana Scholarship
Program. Given that statewide private school choice programs are a newer policy development
than the highly targeted citywide programs that predominated the private school choice
landscape throughout the 1990s and early 2000s, it is not surprising that there have been fewer
lottery-based studies of such programs. Nonetheless, the evidence marshalled to date has raised
concerns among many in the school choice community because of the unprecedented and large
negative impacts associated with voucher usage in the Pelican State.
Abdulkadiroglu, Pathak, and Walters (2018) leverage Louisiana’s oversubscribed
application lottery to experimentally examine the impact of the Louisiana Scholarship Program
EMBARGOED UNTIL 12:01 AM ON JUNE 4, 2018
8
in the first year after its statewide expansion in 2012, finding large and statistically significant
negative impacts across all subjects examined. Attending a private school with a voucher
reduced student achievement in math by 41 percent of a SD, with reductions of 8, 26, and 33
percent in reading, science, and social studies achievement, respectively. Second year impact
estimates by Mills and Wolf (2017) reveal similarly large and statistically significant negative
impacts in both English Language Arts and mathematics for students who enrolled in their first-
choice private school through the program. Specifically, voucher users score 18 percent of a SD
lower in English Language Arts and 34 percent of a SD lower in math after two years in the
program. Given these large negative effects, many have questioned what differs about the
Louisiana context that might explain the negative impacts. An ancillary analysis by
Abdulkadiroglu and colleagues raises questions about the quality of private schools accepting
voucher students in Louisiana, as participating schools appear to have been experiencing
declining enrollment prior to the passage of the voucher law. Further evaluation work will be
necessary to determine how the quality of participating private schools is evolving as the
program ages and regulations to address private school quality are implemented (White, 2016).
Two other evaluations of statewide voucher programs have been conducted in recent
years that do not rely on a lottery-based design but employ alternative approaches to causal
inference that attempt to approximate a gold-standard design. First, Figlio and Karbownik (2016)
employ a propensity score matching approach to evaluate Ohio’s EdChoice program. Utilizing
student records from 2003-04 to 2012-13, Figlio and Karbownik report substantial negative
program impacts in both math and English Language Arts, with the largest negative effects
observed in math. The authors note that these negative effects cannot be explained by the
transition effects of switching to a new private school because they persist over time.
EMBARGOED UNTIL 12:01 AM ON JUNE 4, 2018
9
Second, Waddington and Berends (2017) employ a difference-in-differences model with
propensity score matched students to evaluate achievement changes for students in grades three
through eight in the first four years of the Indiana Choice Scholarship Program. After one year in
program, there are no differences in ELA outcomes but math scores decline by 10 percent of a
SD, on average, for students who participate in the voucher program. After four years, however,
there are no longer any statistically significant differences in either math or ELA outcomes,
leading the authors to conclude that the program had a null average impact.
In summary, recent evaluations of the relatively young, statewide voucher programs in
Louisiana, Ohio, and Indiana point to potentially substantial negative impacts associated with
initial voucher use, contrary to a consistent body of evidence prior to 2017 that showed null to
positive impacts associated with voucher usage in the United States. A high-quality analysis of
North Carolina’s Opportunity Scholarship Program, a close cousin of these three programs,
would provide a valuable data point on the impact of contemporary private school choice
programs.
Literature on the OS Program. Enacted in 2013 and first implemented in the 2014-15
school year, the North Carolina Opportunity Scholarship program is currently serving its fourth
cohort of voucher students. To date, the only evaluation of the program’s impact on student
achievement is a report by the Children’s Law Clinic at Duke Law School (Wettach, 2017). No
statistical tests are employed to compare student performance in this report, nor are students
assessed using a common test. Instead, the author presents the percentage of voucher students
scoring above average on any of the standardized tests given in a subset of private schools (i.e.,
those schools with greater than 25 voucher enrollees) and compares this percentage to the
average National Assessment of Educational Progress (NAEP) performance by all low-income
EMBARGOED UNTIL 12:01 AM ON JUNE 4, 2018
10
students in the public schools. Vastly different sample sizes in the two groups under comparison
raise questions about uneven measurement error in the two sectors being compared. Further,
students in these two groups differ in terms of gender, race, age, family background, prior
academic achievement, and numerous other background characteristics that are not accounted for
with a statistical model of any kind. This is an important omission because descriptive data on
program participants demonstrates that voucher students represent a distinct subgroup of students
in the state (Egalite, Porter, & Stallings, 2017). For example, voucher students reside in some of
the lowest-income households in North Carolina, with an adjusted median household income in
2016-17 of $16,213 for new voucher recipients and $15,000 for renewal voucher recipients.1
Methodology
Recruitment. In Spring 2017, the research team collaborated with the leadership of
public schools, non-public schools, and partner organizations in four geographic regions of North
Carolina to recruit a volunteer sample of low-income students in grades 4 through 8 who likely
qualified for the Opportunity Scholarship Program, which has an eligibility threshold of 133% of
the federal free and reduced lunch guideline. Student eligibility for the free and reduced-price
lunch program was later confirmed by accessing public school student records made available by
the Department of Public Instruction and those students who did not meet the income criteria
were excluded from our analyses.
Recruitment on the public school side adhered to the following protocol: We first applied
for separate IRB approval in each participating school district, as well as at the university level,
then commenced a four-stage approach to recruiting unpaid student volunteers to participate in
1
Adjusted per-household income is calculated as household income / square root of household
size, a commonly used approach to account for household savings resulting from economies of
scale and resource-sharing.
EMBARGOED UNTIL 12:01 AM ON JUNE 4, 2018
11
data collection. Starting at the district level, we approached the public school superintendents of
those geographic regions that featured high numbers of OS students to request permission to
recruit volunteers in their schools to serve as our comparison group. Once a cooperation
agreement was established with four public school superintendents, we coordinated with the
head of testing in each district to identify the highest-poverty public schools in those districts.
We next reached out to individual school principals to request their cooperation with the study.
Once principals consented, school personnel distributed explanatory letters to families on our
behalf, describing the goals of the research project and requesting parental consent for student
participation in the research project. Finally, we requested student assent to participate in data
collection. Specifically, on the day of testing, students were given a children’s version of the
parental information letter, written in simple language that explained the purpose of the research,
any expected risks or benefits, and notifying them that their participation was voluntary and they
were free to opt out at any time.
Recruitment procedures on the private school side adhered to the following protocol: We
started by making courtesy calls to the private school associations in the state, notifying them
about the project so they would have information at their fingertips to answer questions from
private school leaders in their network. We then commenced one-on-one recruitment phone calls
with individual school principals and meetings with advocacy groups and legislators on both
sides of the issue. The bulk of recruitment support was ultimately provided by the organization,
Parents for Educational Freedom in North Carolina, which encouraged private schools to
respond to our request to participate in the study and helped schools schedule data collection
sessions with us. Parent and student consent procedures followed the protocols already described
and were identical for private and public school students.
EMBARGOED UNTIL 12:01 AM ON JUNE 4, 2018
12
All test administration was conducted by our research team and by third-party research
contractors on school grounds during the school day. The test administrators were all trained in
common protocols and ethical considerations to ensure that the testing conditions were consistent
across sites. The team arrived at each school site at the start of the school day and coordinated
with school personnel to set up the room with testing booklets, scratch paper, and pencils.
Parental consent letters were collected prior to our arrival by school personnel. In addition,
students were provided with an assent form on the day that further allowed them to opt out of
testing, if necessary. Testing sessions took approximately two hours in total. Unfortunately,
students with special educational needs were excluded from all data collection efforts as the
researchers did not have the manpower to provide special testing accommodations as needed.
School description. In total, we collected test scores from volunteer students in 24
private schools and 14 public schools (Table 4). Sample sizes were larger in the public schools,
with a mean of 35 tested students per site and a median of 23 students. On the private school
side, there was a mean of 12 tested students per site and a median of seven students. We visited
every private school that agreed to be in the study, including a school with just one student
volunteer and another with 43 students. Data for 19 private schools were located in federal data
files and data for 16 schools were located in state records from the Division of Non Public
Education. The reader should note that no descriptive data was located for three private schools
in the testing sample so those schools are excluded from the descriptive data presented in Table 4
and the discussion presented in the next section.
<< Table Four About Here >>
Almost all (95 percent) of the private schools in our sample had a library or media center,
one indicator of how well resourced a given school is. Approximately half (53 percent) of the
EMBARGOED UNTIL 12:01 AM ON JUNE 4, 2018
13
private schools visited were Catholic schools, 26 percent were Christian (no specific
denomination), 16 percent were Baptist, and 5 percent were some other religion such as
Methodist or Episcopal. The private schools visited had a median enrollment of 225, with a
minimum enrollment of 107 and a maximum of 1,402. The majority of the private schools (74
percent) were located in a city or suburb (16 percent), the median pupil teacher ratio was 12, and
the median number of full time equivalent teachers was 28. All private schools in the state are
required to report which standardized tests they use for accountability purposes to the North
Carolina Division of Non Public Education so we also report this information for the schools in
our sample. The most commonly used test was the Iowa Test of Basic Skills (used by 44 percent
of the schools), followed by the Terra Nova (31 percent) and the Stanford Achievement Test (25
percent).
Data for all 14 of the public schools in our sample were located in federal files. All of the
public schools visited were traditional public (93 percent) or magnet schools (7 percent) and all
qualified for school wide Title 1, a common proxy for high-poverty schools. This latter selection
criteria was by design, to maximize the chance of recruiting comparable low-income matches for
the OS students in the treatment condition. The public schools were slightly larger than the
private schools visited, with a median enrollment of 650, a minimum of 340 and a maximum of
930. Although half of the public schools in our sample are coded as being located in a rural area,
they were all located in the same geographic regions of the state as the private schools visited.
This difference in urban locale may also reflect differences in how the Private School Universe
Survey and the Public Elementary/Secondary School Universe Survey code urbanity (i.e., the
private school survey uses the categories city, suburb, town, rural; whereas the public school
survey uses the categories city, large; city, mid-size; city, small; suburb, large; suburb, midsize;
EMBARGOED UNTIL 12:01 AM ON JUNE 4, 2018
14
suburb, small; town, fringe; town, distant; town, remote; rural, fringe; rural, distant; rural,
remote). Finally, the median public school pupil teacher ratio was 14, and the median number of
full time equivalent teachers was 45. All of the public schools administer the North Carolina End
of Grade tests.
Estimation strategy. We conduct a propensity score analysis to estimate the impact of
the program, a commonly used approach to causal inference in the voucher literature when a
lottery study is not possible. Students’ observable characteristics are used to predict their
likelihood of using a voucher and these propensities are then used to construct estimation
weights that result in comparable treatment and control groups. Within-study comparisons are
one approach researchers have employed to assess the validity of matching approaches such as
the one employed here, with generally encouraging results.
Ackerman and Egalite (2017) leverage data on Florida charter schools between 2001 and
2009 to assess the validity and sensitivity of a commonly-used matching approach in the school
choice literature, popularized by the Stanford Center for Research on Education Outcomes
(CREDO). One of the primary contributions of the Ackerman and Egalite paper is its test of the
sensitivity of results that rely on “virtual control records” that are generated from the records of
up to seven comparison group students for every one student in the treatment group. They find
no differences in estimates produced by models that feature up to seven-to-one versus one-to-one
matching. Second, this analysis assesses the internal validity of the matching approach generally,
by comparing the point estimates produced by a matching approach to those produced by an
instrumental variables analysis. The authors note that the two sets of results are comparable in
both magnitude and direction.
EMBARGOED UNTIL 12:01 AM ON JUNE 4, 2018
15
Bifulco (2012) employs an even more rigorous test of the validity of nonexperimental
estimators by judging their performance against experimental data from two interdistrict magnet
schools. He concludes that the use of pretreatment measures of academic performance is critical,
reducing the bias in a nonexperimental approach by 64 to 96 percent. Similarly, within-study
comparisons of non-experimental methodological approaches by Angrist, Cohodes, Dynarksi,
Fullerton, Kane, Pathak, & Walters (2011), Abdulkadiroğlu, Angrist, Cohodes, Dynarksi,
Fullerton, Kane, & Pathak (2009) and Fortson, Verbitsky-Savitz, Kopa, & Gleason (2012) report
promising replication results when the non-experimental method accounts for prior test scores
and draws the comparison group from the same traditional public schools previously attended by
the students in the treatment group.
Data and Methodology
Sample. In total, there were 698 low-income students tested in spring 2017: 297 in
private schools and 401 in public schools (Table 5). Student answer sheets were machine-scored
by Houghton Mifflin Harcourt and the scores were returned to us in a digital format. To
construct the final analysis sample, we merge these records with student data from the North
Carolina Department of Public Instruction (DPI). This allows us to add rich demographic data
and prior test scores to each student record. Because we have to merge by student name, 124
observations are dropped at this stage, either because a reliable match could not be made with
DPI data (e.g., the student reported a nickname instead of their legal name on the ITBS answer
sheet), or because a name matched with multiple records for that grade level in the DPI data
(e.g., in the case of students with very common first and last names), creating uncertainty as to
the true match. In both of these scenarios, we opt for the conservative approach of dropping
records when we cannot be sure of an exact match. A further eight students are dropped because
EMBARGOED UNTIL 12:01 AM ON JUNE 4, 2018
16
they were mistakenly given the wrong test for their grade level in 2017 (i.e., some 4th
graders
took the 5th
grade test and vice versa). An additional seven students opted not to complete the
tests on testing day and are dropped from the sample as a result. To ensure comparability
between OS students and students in public schools, 58 public school students who were not
listed as free and reduced lunch eligible in the 2016 DPI data are removed from the analysis,
along with three students who could not be verified in the OS records. These final two screens
ensure that every student in both public and private schools in our sample has been identified as
low-income. The final student count in the analytic dataset is 497 students, with 245 in private
schools and 252 in public schools.
<< Table Five About Here >>
Once the analytic dataset has been established, we next define the matching algorithm.
Every public and private school student in our sample has already been verified as being low-
income so our primary matching covariates are End of Grade (EOG) standardized test scores
from 2016. As detailed in the description of the analytic approach below, we also account for
demographic differences between the two groups.
EOG scores. All public school students have EOG records from 2016, but only 89 out of
245 private school students have EOG records from 2016. Of these, 29 (i.e., 12%) attended a
public school in 2016 but the number of membership days suggest they did not attend for the
entire school year, which may explain why they are missing EOG exam scores from spring 2016.
Another 31 (i.e., 13%) have EOG records from 2015, suggesting that their missing 2016 EOG
records are due to participation in the OS program for two years rather than just one. In the latter
scenario, we run the analyses both with and without these students in order to cleanly estimate
EMBARGOED UNTIL 12:01 AM ON JUNE 4, 2018
17
one-year impacts, as compared to running models that would estimate a mixture of one and two-
year impacts.
Outcome measures. The Iowa Test of Basic Skills (ITBS) is a standardized, nationally
norm-referenced test. This evaluation relies upon Form E, which is the ITBS Survey Battery, a
shorter version of the ITBS Complete Battery, which would take several days to administer. The
survey battery consists of three 30-minute tests in the areas of reading, language, and math,
which we administered in a single testing session. We relied upon the tests at Levels 10 through
14, which correspond to grade levels four through eight. Students were administered the test that
matched their current grade level. Students’ answer booklets were machine-scored by the test
publishers and the results were made available to the research team for analysis.2
Analytical approach. We use inverse propensity weights (IPW) in a regression model to
estimate the effect of private school attendance through the Opportunity Scholarship Program on
students’ academic performance. IPW adjusts for differences between the treatment and control
groups by using some form of the inverse of the predicted probability of treatment as a weight in
a statistical model. IPW is one of a general class of techniques commonly referred to as matching
or propensity score analysis. Propensity score analysis relies on two assumptions (Rosenbaum &
Rubin, 1983):
1. The covariates used to generate the propensities are such that the potential outcomes
under treatment and control are independent of treatment status, conditional on the
covariates.
2
Specific information on the validity and reliability of the Iowa tests is available here:
https://itp.education.uiowa.edu/ia/documents/ITBS-Research-Guide.pdf
EMBARGOED UNTIL 12:01 AM ON JUNE 4, 2018
18
2. There are a sufficient number of observations with similar propensities for both treatment
and control.
The first assumption cannot be tested empirically and is instead a matter of argument. In
other words, reasonable people can disagree as to whether a particular propensity score analysis
has used the relevant set of covariates in the propensity model. In the next section, therefore, we
present an argument in favor of the covariates selected in this analysis.
We rely upon those variables that are expected to differ between voucher and non-
voucher students and that are expected to influence student outcomes on a standardized
assessment. These include gender, race/ethnicity, school grade level in 2017, and whether the
student had any disciplinary incidents in public school in 2016. In addition, we match on state
EOG math and reading scores from 2016, which are vertically scaled and thus appropriate for
matching in this manner. The charter school literature shows that matching on gender, race,
cohort, and pretreatment test scores typically yields treatment effect estimates similar to analyses
using lotteries (Dobbie & Fryer, 2017). Of these variables, pretreatment test scores are the most
important (Bifulco, 2012). We note that by limiting the public school sample to students who
qualify for free or reduced lunch, we have exact matched both groups by low income status.
We tested three versions of the logistic regression model predicting voucher receipt. The
base model included the covariates listed above and squared terms for math and reading EOG
scores. The second model added interactions between the grade indicators and EOG scores, and
the third included interactions between the grade indicators and the squared EOG terns. For each
analysis we chose the model specification that yielded the lowest average standardized bias
across the covariates. Given our small sample sizes after establishing common support, we reset
individual student’s propensity weights to 4 if they were greater than 4, to prevent undue
EMBARGOED UNTIL 12:01 AM ON JUNE 4, 2018
19
influence over our results (Cole and Hernan, 2008; Lee et al., 2011). The second assumption can
be verified visually by inspecting the distribution of propensities for treated and control students.
Figure 2 shows the distribution of the propensities for private and public school attendees in our
five sets of analyses, and indicates sufficient overlap for analysis. We established common
support by removing from the analysis students whose propensities were less than the maximum
of the minimum propensities for the two groups, or greater than the minimum of the maximum
propensities of the two groups. The majority of students removed due to lack of overlap were
public school students with very low propensities of treatment.
<<Figure Two About Here >>
Because families who choose to use a voucher are typically unrepresentative of the
general population (Egalite, Porter, & Stallings, 2017), we use inverse propensity weights to
estimate the average treatment effect of the treated (ATT), rather than the average treatment
effect. Table 6 shows the raw and weighted covariate means for the public and private school
students in the five analytic samples. The weighted means use the ATT weights as survey
weights, adjusting for the propensity of being a voucher participant.
<< Table Six About Here >>
Table 6 reveals any differences between the two groups before the matching process
occurs. Focusing on the sample of new OS recipients (top panel), students attending private
schools are less likely to be female (-8 percentage points), less likely to be Black (-3 percentage
points), and less likely to be Latino/a (-9 percentage points). They are also more likely to be in
lower grades and less likely to be in higher grades in the 2017 school year. Private school
students were less likely to have experienced a disciplinary incident during the 2016 school year
EMBARGOED UNTIL 12:01 AM ON JUNE 4, 2018
20
(-.10 percentage points) and scored higher on the previous year reading EOG exam (.16 SD). The
average covariate bias before weighting is .17 SD.
After weighting, these differences largely disappear. All of the bias measures for the
covariates are less than .10, with over half less than .05. The average covariate bias after
weighting drops to .04 SD. Results are similar for the other analytics samples.
Results
We estimate the effect of the Opportunity Scholarship Program in two ways (Table 7).
First, we use a bivariate regression model with a dummy variable indicating treatment; this is
equivalent to a simple t-test between the two groups. Second, we use a multiple regression model
with the matching covariates included as control variables. The second approach controls for
remaining differences between the two groups after weighting and increases our statistical
power; this is our preferred specification. For each analysis, the ATT inverse propensity weights
are used to ensure comparability between the two groups.
<< Table Seven About Here >>
We first estimate the effect of voucher receipt on the sample of new voucher recipients.
These are students in their first year of private school using the voucher during the 2016-2017
school year. The top panel of Table 7 shows the differences in performance on the ITBS for this
treatment group compared to the public school sample. In general, the results show that in our
testing sample, voucher recipients scored higher than their public school counterparts in all three
subject areas examined—mathematics, reading, and language. The standard deviation in our
sample for the three tests is around 18 points, so the effect sizes for voucher recipients range
from .22 to .44 SD).
EMBARGOED UNTIL 12:01 AM ON JUNE 4, 2018
21
This analysis accounts for static differences between OS students and public school
students, but not dynamic changes. For example, both sets of students may appear similar in
terms of previous year EOG test scores, but parents may pull students from public schools based
on dynamic changes in their EOG test performance over time. As a robustness check, therefore,
we repeat our analyses, but include as well the change in math and reading EOG test scores from
2015 to 2016. Results are generally still positive, but only the math effect is statistically
significant now, which may be related to the reduction in statistical power associated with going
from 245 observations to 170, a 31 percent drop in sample size.
One downside associated with focusing on new OS students is that the estimated impact
of the voucher cannot be separated from the impact of switching schools. If the treatment group
students are slow to adjust to the standards, expectations, and culture of their new schooling
environment, this may attenuate the estimated impact of the voucher. The bias could work in the
opposite direction too, if the initial excitement of having “won” a voucher seat motivates
students to put forth greater effort in the short run, temporarily boosting achievement but not
resulting in sustained gains into the second year of voucher use.
To generate estimates that are clean of these potential biases therefore, we next estimate
the impact of voucher use on renewal students instead. Here, the treatment group consists of
voucher students in their second year of voucher use, and the propensity weights for both the
public and private school matched groups are constructed using the 2015 EOG instead of the
2016 EOG. In these models, impacts in all three subjects—math, reading, and language—remain
positive, although only the language impacts are statistically significant at p < .05, which may be
related to the drop in sample size required to run these models. Of note, the estimated impacts on
reading and language scores actually increase by 3.742 points (i.e., 7.644 – 3.902) and 1.521
EMBARGOED UNTIL 12:01 AM ON JUNE 4, 2018
22
(i.e., 9.412- 7.891), respectively, whereas math scores decrease slightly, by approximately one-
half of one point (i.e., 6.487-6.012). Thus, we conclude that students in our sample who are still
participating in the OS program after two years perform nine points higher on the language
assessment than comparable students who remain in public schools. This is equivalent to .52 SD.
A central issue in the evaluation of voucher programs is the assessment used to compare
private and public school students. If private schools are required to administer the state
assessment to voucher recipients, they may find themselves at a disadvantage if their curriculum
is not aligned with the test in the same way as the public school curriculum is aligned. Although
we do not rely on the criterion-referenced North Carolina state test for this evaluation, which
would potentially advantage the public school students, a similar issue could be at play here if
some of the private schools have aligned their curriculum to the assessment we use. While it is
important to note that none of the schools in our sample actually use the assessment administered
for this evaluation—the short battery (Form E) of the ITBS—some of the private schools in our
sample do administer the complete battery of the ITBS to students in 3rd
, 6th
, and 12th
grade for
internal assessment purposes. While they may not explicitly focus their instruction to ensure their
students perform well on the ITBS, they may have selected the ITBS because the scope and
sequence of tested content most closely aligns to their curriculum. Thus, our positive results
could be explained, in part, by an alignment with the assessment used to measure student
achievement.
One way to test this theory is to repeat our analysis of new OS recipients and split the
treatment group into two, depending on whether or not the private school attended by a student
administers the ITBS. The bottom panel of Table 7 shows the results of these analyses. The large
positive effects from our previous analyses largely disappear when analyzing students from
EMBARGOED UNTIL 12:01 AM ON JUNE 4, 2018
23
private schools that do not use ITBS, implying that OS students attending these schools perform
about the same as their public school counterparts on this assessment. The treatment variable is
no longer statistically significant, and the effect sizes range from .04 to .10. The results for the
ITBS sample, meanwhile, remain statistically significant, with implausibly large effect sizes that
range from .39 to .86.
These large, positive effect sizes may, in part, reflect curricular alignment with the ITBS,
but we also cannot rule out other explanations. For instance, it could be the case that use of the
ITBS is correlated with other influential school characteristics, such as school age, school size,
teacher quality, school leader quality, peer group quality, etc. It could also be driven by student
selection into certain types of schools. It is also worth noting that all of the Catholic schools in
our sample use the ITBS, such that half of the students in the ITBS-only private school group
attend Catholic schools, versus none in the non-ITBS sample, making it challenging to tease
apart the impact of attending a Catholic school from the impact of attending an ITBS-using
school. In conclusion, we cannot rule out the possibility that the large effect sizes for this
analysis may reflect factors other than curricular alignment with the assessment.
Discussion
The results presented here reveal large positive impacts associated with voucher usage in
North Carolina. Our preferred specification utilizes observations from 245 students, controlling
for a host of covariates, revealing first year impact estimates of .36 SD in math and .44 SD in
language. Two-year impact estimates suggest that student achievement in language improved by
.52 SD. These findings are surprising in that they run contrary to recent evidence from Louisiana
(Abdulkadiroglu, Pathak, & Walters, 2018; Mills & Wolf, 2017), Ohio (Figlio & Karbownik,
2016), and Indiana (Waddington & Berends, 2017), but the positive impacts observed here are in
EMBARGOED UNTIL 12:01 AM ON JUNE 4, 2018
24
line with the bulk of the literature on voucher usage in the United States since the 1990s (Table
2). It may be the case that the North Carolina Opportunity Scholarship Program truly has a
positive impact on student achievement, perhaps because it reaches highly economically-
disadvantaged students (Egalite, Stallings, & Porter, 2017) who have few school choice options
in the absence of the program and perhaps the highest potential for academic growth, as a result.
Two other potential explanations also merit consideration.
The first alternative explanation for the positive impacts reported here relates to the
research design. As with any quasi-experimental design, it is possible that unobserved
characteristics of students not captured in the statistical model explain the variation in test scores
that is currently attributed to the voucher indicator. For instance, even though all students in the
analysis sample are low-income by sample construction criteria, voucher students may still be
relatively advantaged compared to their public school matched peers and these unobserved
characteristics may lead to higher test scores after the student switches into private school. OS
parents have to provide school transportation and pay for breakfast and lunches now that the
child is in a private school (Egalite, Gray, and Stallings, 2017), which suggests they might have
more disposable income to draw upon but a descriptive analysis of household income suggests
that voucher-receiving families are actually among the poorest households in the state (Egalite,
Stallings, & Porter, 2017). It may still be the case that parents of voucher-receiving students are
more motivated, but this would have to be a dynamic characteristic or it would already be
accounted for by the variables documenting students’ prior test scores and disciplinary records.
Second, it is possible that the choice of test unfairly advantaged the private school
students. This would be a serious concern if the test chosen for this analysis was a criterion-
referenced test, aligned to a specific set of standards and content sequence, such as the North
EMBARGOED UNTIL 12:01 AM ON JUNE 4, 2018
25
Carolina End-of-Grade tests, but the Iowa Test of Basic Skills is a norm-referenced test that is
not aligned with any one curriculum. A related concern is if the private schools in our sample use
the Iowa Test of Basic Skills for their annual assessment and students in the study sample were
seeing the same set of questions for the second time. We tried to avoid this scenario in two
ways—by testing early enough in the spring so that the students took the test for our study before
taking the test for their own school’s accountability protocol. A complementary benefit of this
timing decision was that we avoided unfair test fatigue among public and private school students,
because neither side had started their own spring testing yet. We also avoided this potential
pitfall by selecting a short battery test that had not previously been reported to the SEAA as
being used among private schools for accountability purposes (recall, Table 2).
Although not a threat to internal validity, it is also important to consider sample
construction when interpreting these results. Because our sample is not comprehensive and
students were not randomly selected to be in the study, our sample is not representative of all
voucher users in 2016-17. On both the public and private school sides, we were forced to rely on
volunteer samples, which may have resulted in unusually high performers in our sample.
Recruitment efforts were supported by public and private school partners including individual
school leaders, school district central office staff, and a school choice interest group. Thus, the
results reported here are not reflective of the average test score impact on a typical voucher
student attending a North Carolina private school by way of the Opportunity Scholarship
program. The sample construction protocol also raises interesting questions about how we should
conceptualize the “treatment.” Students in the comparison group attend large, high-poverty
public schools, whereas students in the treatment group attend smaller, less racially diverse
private schools (Table 4). As with any private school voucher study, the treatment impact may
EMBARGOED UNTIL 12:01 AM ON JUNE 4, 2018
26
reflect differences in peer effects, school size, and resources as much as it reflects a simple
switch from the public to private sector.
Limitations. There are three important limitations to this analysis that merit further
discussion. The first limitation relates to our research design. Propensity score matching allows
us to mitigate potential selection bias by accounting for observable differences between students
in the treatment and comparison groups. This is greatly strengthened by our inclusion of
pretreatment measures of students’ academic performance (Bifulco, 2012). Nonetheless, it is
possible that the matched students are not perfectly aligned along unobservable dimensions,
which could introduce potential selection bias. This is always a possibility in research designs
that cannot leverage a lottery for causal inference.
Second, the outcome examined, student performance on a nationally-normed
standardized test, captures just one dimension of student learning. Many in the private school
community would likely wish to see more diverse outcomes examined, such as less tangible but
equally important character skills, such as perseverance, grit, and persistence in the face of
failure. Nonetheless, there is a strong argument to be made for a close examination of student test
scores as they are strongly related to high school completion and college attendance (Rivkin,
1995), college quality (Behrman, Kletzer, McPherson, & Schapiro, 1998), college completion
(Hanushek & Pace, 1995), and individual incomes (Neal & Johnson, 1996).
The third limitation is one of external validity. The students in this sample were not
randomly selected among all Opportunity Scholarship users in the state so they may not be
representative of the average Scholarship user. Furthermore, the private schools that participated
in our data collection efforts were also not randomly selected among all participating private
schools so they too may not be representative of the average private school attended by a student
EMBARGOED UNTIL 12:01 AM ON JUNE 4, 2018
27
utilizing an Opportunity Scholarship. We are not concerned that either of these limitations
introduces bias by compromising internal validity; they just limit the generalizability of the
results.
Conclusion
We use inverse propensity weights in a regression model to estimate the impact of North
Carolina’s Opportunity Scholarship Program on student performance in mathematics, reading,
and language. The effect sizes observed are positive, large, and statistically significant, ranging
from .25 to .49 SD. As a robustness check, we also run models that account for pre-existing
trends in student achievement by controlling for both 2015 and 2016 test scores. Impacts remain
positive and statistically significant, but shrink slightly to .21 to .39 SD. Although not a
comprehensive analysis of all 5,624 voucher recipients in the 2016-17 school year, this analysis
presents the first estimate of the achievement impacts associated with the use of a means-tested
voucher in the Tar Heel state.
EMBARGOED UNTIL 12:01 AM ON JUNE 4, 2018
28
References
Abdulkadiroglu, A., Pathak, P. A., & Walters, C. R. (2018). Free to choose: Can school choice
reduce student achievement? American Economic Journal: Applied Economics, 10(1),
175–206.
Abdulkadiroglu, A., Angrist, J. D., Cohodes, S., Dynarski, S. M., Fullerton, J., Kane, T. J., &
Pathak, P. A. (2009). Informing the debate: comparing Boston’s charter, pilot and
traditional schools. Boston, MA: Boston Foundation Report.
Ackerman, M., & Egalite, A. J. (2017). A critical look at methodologies used to evaluate charter
school effectiveness. Educational Assessment, Evaluation and Accountability, 29(4),
363–396.
Angrist, J. D., Cohodes, S. R., Dynarski, S. M., Fullerton, J. B., Kane, T. J., Pathak, P. A., &
Walters, C. R. (2011). Student achievement in Massachusetts’ charter schools.
Cambridge, MA: Center for Education Policy Research, Harvard University.
Barnard J., Frangakis C. E., Hill J. L., Rubin D. B. (2003). Principal stratification approach to
broken randomized experiments: A case study of School Choice vouchers in New York
City. Journal of the American Statistical Association, 98, 288–311.
Behrman, J.R., Kletzer, L.G., McPherson, & M.S., Schapiro, M.O. (1998). The microeconomics
of college choice, careers, and wages: Measuring the impact of higher education. Annals
of the American Academy of Political and Social Science, 559: 12–23.
Bettinger, E. & Slonim, R. (2006). The effect of educational vouchers on academic and non-
academic outcomes: Using experimental economic methods to study a randomized
natural experiment. Journal of Public Economics, 90: 1625-48.
EMBARGOED UNTIL 12:01 AM ON JUNE 4, 2018
29
Bifulco, R. (2012). Can nonexperimental estimates replicate estimates based on random
assignment in evaluations of school choice? A within-study comparison. Journal of
Policy Analysis and Management, 31(3), 729–751.
Cole, S.R. & Hernan, M.A. (2008). Constructing inverse probability weights for marginal
structural models. American Journal of Epidemiology, 168(6), 656-664.
Cowen, J., M. (2008). School Choice as a Latent Variable: Estimating the “Complier Average
Causal Effect” of Vouchers in Charlotte. Policy Studies Journal, 36(2), 301–315
Dobbie, W.S. & Fryer, R.G. (2017). Charter schools and labor market outcomes. NBER
Working Paper no. 22502. Retrieved from http://www.nber.org/papers/w22502.
Egalite, A.J., Gray, A.M., & Stallings, D.T. (2017). Parent perspectives: Applicants to North
Carolina’s Opportunity Scholarship Program share their experiences. OS Evaluation
Report #2. Raleigh, N.C.: North Carolina State University. Retrieved from
https://ced.ncsu.edu/elphd/wp-content/uploads/sites/2/2017/07/Parent-Perspectives.pdf.
Egalite, A.J., Porter, S. R., & Stallings, T. (2017). A profile of applicants to North Carolina’s
Opportunity Scholarship Program: Descriptive data on 2016-17 applicants. OS
Evaluation Report #3, Raleigh, N.C.: North Carolina State University. Retrieved from
https://ced.ncsu.edu/elphd/research/the-impact-of-the-north-carolina-opportunity-
scholarship-program/
Figlio, D. N., & Karbownik, K. (2016). Evaluation of Ohio’s EdChoice Scholarship Program:
Selection, Competition, and Performance Effects. Washington, D.C.: Thomas B.
Fordham Institute. Retrieved from https://edex.s3-us-west-
2.amazonaws.com/publication/pdfs/FORDHAM%20Ed%20Choice%20Evaluation%20R
eport_online%20edition.pdf.
EMBARGOED UNTIL 12:01 AM ON JUNE 4, 2018
30
Fortson, K., Verbitsky-Savitz, N., Kopa, E., & Gleason, P. (2012). Using an experimental
evaluation of charter schools to test whether nonexperimental comparison group methods
can replicate experimental impact estimates. NCEE Technical Methods Report No.
2012–4019. Washington, D.C.: National Center for Education Evaluation and Regional
Assistance, Institute of Education Sciences, U.S. Department of Education.
Hanushek, E.A., & Pace, R.R. (1995). Who chooses to teach (and why)? Economics of
Education Review, 14 (2): 101–117.
Howell, W., Wolf, P., J., Campbell, D., & Peterson, P. E. (2002). School vouchers and academic
performance: Results from three randomized field trials. Journal of Policy Analysis and
Management, 21(2), 191–217.
Jin, H., Barnard, J., & Rubin, D., B. (2010). A Modified General Location Model for
Noncompliance With Missing Data: Revisiting the New York City School Choice
Scholarship Program Using Principal Stratification. Journal of Educational and
Behavioral Statistics, 35(2), 154–173.
Krueger, A., & Zhu, P. (2004). Another look at the New York City voucher experiment.
American Behavioral Scientist, 47(5), 658–698.
Lee, B.K., Lessler, J. & Stuart, E.A. (2011). Weight trimming and propensity score weighting.
PLoS ONE, 6(3), 1-6.
Mills, J. N., & Wolf, P. J. (2017). Vouchers in the Bayou: The effects of the Louisiana
Scholarship Program on student achievement after two years. Forthcoming in
Educational Evaluation and Policy Analysis.
Neal, D.A., & Johnson, W.R. (1996). The role of pre-market factors in black–white differences.
Journal of Political Economy, 104 (5): 869–895.
EMBARGOED UNTIL 12:01 AM ON JUNE 4, 2018
31
Rivkin, S.G. (1995). Black/white differences in schooling and employment. Journal of Human
Resources, 30 (4): 826–852.
Rosenbaum, P. R., & Rubin, D. B. (1983b). The central role of the propensity score in
observational studies for causal effects. Biometrika, 70(1), 41–55.
Waddington, R. J., & Berends, M. (2017). Early Impacts of Indiana Choice Scholarship
Program: Achievement Effects for Students in Upper Elementary and Middle
School. Paper presented at the annual meeting of the Society for Research on
Educational Effectiveness, Washington, DC.
Wettach, J.R. (2017). School vouchers in North Carolina: The first three years. Durham, NC:
The Children’s Law Clinic at Duke Law School. Retrieved from
https://law.duke.edu/childedlaw/docs/School_Vouchers_NC.pdf.
White, J. (2016). Give vouchers time: Low-income families need as many quality school options
as possible. Washington D.C.: Brookings Institution. Retrieved from
https://www.brookings.edu/research/give-vouchers-time-low-income-families-need-as-
many-quality-school-options-as-possible/.
Weinschrott, D.J., & Kilgore, S. B. (1998). Evidence from the Indianapolis Voucher Program. In
P. E. Peterson & B. C. Hassel (Eds.), Learning from school choice (pp. 307-333).
Washington D.C.: Brookings Institution.
Witte, J., Carlson, D., Cowen, J.M., Fleming, D.J., & Wolf, P.J. (2012). MPCP longitudinal
educational growth study: Fifth year report. SCDP Milwaukee Evaluation Report #29.
Fayetteville, AR: The School Choice. Demonstration Project. Retrieved from
http://www.uaedreform.org/category/department-of-education-reform/scdp/milwaukee-
evaluation/mpcp-final-reports/.
EMBARGOED UNTIL 12:01 AM ON JUNE 4, 2018
32
Wolf, P. J., Kisida, B., Gutmann, B., Puma, M., Eissa, N., & Rizzo, L. (2013). School vouchers
and student outcomes: Experimental evidence from Washington, DC. Journal of Policy
Analysis and Management, 32(2), 246–270.
EMBARGOED UNTIL 12:01 AM ON JUNE 4, 2018
33
Figure 1. Distribution of Student Propensity Scores by 2017 School Type
01234
0 .2 .4 .6 .8 1
Predicted probability of treatment
Public Private
New OS recipients
0123
0 .2 .4 .6 .8 1
Predicted probability of treatment
Public Private
Change in EOG
0123
0 .2 .4 .6 .8
Predicted probability of treatment
Public Private
Renewal OS Recipients01234
0 .2 .4 .6 .8
Predicted probability of treatment
Public Private
Privates: No ITBS
02468
0 .2 .4 .6 .8
Predicted probability of treatment
Public Private
Privates: ITBS only
EMBARGOED UNTIL 12:01 AM ON JUNE 4, 2018
34
Table 1.
North Carolina’s Opportunity Scholarship Program, Compared to Selected Programs in Other States
State North Carolina Florida Indiana Louisiana
Program Name NC Opportunity
Scholarship Program
FL Tax Credit
Scholarship Program
IN Choice Scholarship Program LA Scholarship
Program
Program Type Voucher Tax Credit Voucher Voucher
Year Enacted 2013 2001 2011 2008
Eligibility Pathways a. Household income
doesn’t exceed 133% of
the federal free/ reduced-
price lunch program
limit, and b. Student
either has prior public
school attendance, is
entering K or G1,
parent/guardian is active-
duty military, or child is
in foster care/ recently
adopted
Either the student is
in foster care or
meets the household
income requirement
(260% of federal
poverty line). Note:
prior year enrollment
in a public school no
longer required
Eight potential pathways, none
of which allow household
income to exceed 200% of
federal free/ reduced price
lunch program limit:
Continuing Choice Scholarship
Student, Previous Choice
Scholarship Student, Previous
Scholarship Granting
Organization (SGO) Award,
Special Education, "F" Public
School, Two Semesters in a
Public School, Sibling, and Pre-
K.
Student must be a
Louisiana resident;
Household income
does not exceed 250%
of the federal poverty
guidelines; Either
entering kindergarten
or enrolled in a public
school with a C, D, F,
or T grade; OR a
continuing
Scholarship student
Max Value of
Voucher Award
$4,200 $5,886 The lesser of private school
tuition and fees OR the 50% or
90% award amounts based on
the funding formula for the
student’s public school
corporation of residence
The lesser of private
school tuition and fees
OR the maximum
state allocation per
student
Parental Co-Pay? Yes Yes Yes No
Private School
Admissions
Screening Permitted?
Yes Yes Yes No
Accountability Tests Any nationally-normed
test
Any nationally-
normed test
State Test State Test
EMBARGOED UNTIL 12:01 AM ON JUNE 4, 2018
35
Participants
(2016-17)
5,624 98,936 34,299 6,995
Sources: Florida program info: http://www.fldoe.org/schools/school-choice/k-12-scholarship-programs/ftc/ftc-faqs.stml; Indiana
program info: https://www.doe.in.gov/sites/default/files/choice/1-choice-parent-faq-february-2018.pdf ; Louisiana program Info:
https://www.louisianabelieves.com/schools/louisiana-scholarship-program. North Carolina program info: Statute 115C-562. Number
of participating students across all four programs comes from www.edchoice.org.
Note: Parental co-pay is when parents are responsible for the cost of tuition and fees that exceed the maximum voucher value. This is
sometimes referred to as tuition “top-up.” All programs generally specify that students must be of school-going age (i.e., high school
graduates would be ineligible) and residents of the state in which the program is administered.
EMBARGOED UNTIL 12:01 AM ON JUNE 4, 2018
36
Table 2.
Standardized Assessments Taken by Opportunity Scholarship Students, 2014-15
Test Name Publisher Number of
Students
Basic Achievement Skills Inventory (BASI) Brewer Testing Services 3
BJU Press Assessments BJU Press 2
California Achievement Test (CAT) Seton Testing Services 33
Comprehensive Testing Program (CTP) Educational Records Bureau 19
Iowa Assessments Houghton Mifflin Harcourt 204
Otis-Lennon School Ability Test (OLSAT) Pearson 3
Stanford Achievement Test Pearson 272
TerraNova Data Recognition Corporation 303
Woodcock Johnson Houghton Mifflin Harcourt 9
TOTAL 848
Source: The North Carolina State Education Assistance Authority
EMBARGOED UNTIL 12:01 AM ON JUNE 4, 2018
37
Table 3.
Lottery-Based Studies of the Achievement Impacts of School Vouchers
Citation Program Name Program
Funding
Program
Scope
Impact
Cowen (2008) Charlotte Scholarship Fund Private Citywide Positive Overall
Greene (2001) Charlotte Scholarship Fund Private Citywide Positive Overall
Howell, Wolf, Campbell, &
Peterson (2002)
The D.C. Opportunity Scholarship
Program.
Public Citywide Positive Overall
Wolf, Kisida, Gutmann, Puma,
Eissa, & Rizzo (2013)
The D.C. Opportunity Scholarship
Program
Public Citywide Null
Dynarksi, Rui, Webber
Gutmann & Bachman (2017)
The D.C. Opportunity Scholarship
Program
Public Citywide Negative Overall
Howell, Wolf, Campbell, &
Peterson (2002)
The Dayton, Ohio Parents Advancing
Choice in Education Program
Private Citywide Positive for Subgroups
Bettinger & Slonim (2006) The Children’s Scholarship Fund of
Toledo, Ohio
Private Citywide Null
Howell, Wolf, Campbell, &
Peterson (2002)
New York City School Choice
Scholarships Foundation Program
Private Citywide Positive for Subgroups
Barnard, Frangakis, Jin, &
Rubin (2003)
New York City School Choice
Scholarships Foundation Program
Private Citywide Positive for Subgroups
Krueger & Zhu (2004) New York City School Choice
Scholarships Foundation Program
Private Citywide Null
Jin, Barnard, & Rubin (2010) New York City School Choice
Scholarships Foundation Program
Private Citywide Positive for Subgroups
Bitler, Domina, Penner, &
Hoynes (2014)
New York City School Choice
Scholarships Foundation Program
Private Citywide Null
Rouse (1998) Milwaukee Parental Choice Program Public Citywide Positive Overall
Greene, Peterson, & Du (1999) Milwaukee Parental Choice Program Public Citywide Positive Overall
Mills & Wolf (2017) Louisiana Scholarship Program Public Statewide Negative Overall and for Subgroups
Abdulkadiroglu, Pathak, &
Walters (2018)
Louisiana Scholarship Program Public Statewide Negative Overall and for Subgroups
Note: The designations “Positive Overall” and “Negative Overall” indicate that a statistically significant positive or negative
EMBARGOED UNTIL 12:01 AM ON JUNE 4, 2018
38
achievement impact were observed for the overall sample in at least one subject
EMBARGOED UNTIL 12:01 AM ON JUNE 4, 2018
39
Table 4.
Description of Public and Private Schools in Sample
Private Public
Tested Students Per School
Median 7 23
Mean 12 35
Min 1 4
Max 43 166
School Has a Library or Media Center 0.95 n/a
Religious Affiliation
Catholic 0.53 n/a
Baptist 0.16 n/a
Christian (no specific denomination) 0.26 n/a
Other Religion (e.g., Methodist, Episcopal) 0.05 n/a
School Type
Private 1.00 0.00
Traditional Public School 0.00 0.93
Charter 0.00 0.00
Magnet 0.00 0.07
School Wide Title 1 n/a 1.00
Enrollment
Median 225 649
Mean 399 640
Min 107 342
Max 1402 933
School Community Type
City 0.74 0.36
Suburb or Town 0.16 0.14
Rural 0.11 0.50
Racial Composition
Average of School Percent White 0.64 0.14
Average of School Percent Black 0.15 0.49
Average of School Percent Hispanic 0.13 0.31
Pupil Teacher Ratio
Median 12 14
Mean 12 14
Min 8 12
Max 19 17
Full Time Equivalent Teachers
Median 28 45
EMBARGOED UNTIL 12:01 AM ON JUNE 4, 2018
40
Mean 35 45
Min 11 26
Max 94 73
Standardized Tests Used
Iowa Test of Basic Skills 0.44 n/a
Terra Nova 0.31 n/a
Stanford Achievement Test 0.25 n/a
California Achievement Test 0.06 n/a
Preliminary Scholastic Assessment Test (PSAT) 0.06 n/a
North Carolina End of Grade Tests n/a 1.00
Notes: n/a implies this data point was not available for schools in this sector; n = 14 public
schools and 24 private schools in the testing sample. All testing was conducted in spring 2017.
Tested students per school refers to the number of students tested by the NC State research team
for this project. An elementary school configuration is defined as a school that has one or more
of grades K-6 and does not have any grade higher than the 8th grade. A secondary school
configuration is defined as a school that has one or more of grades 7-12 and does not have any
grade lower than 7th grade. A combined school configuration is defined as a school that has one
or more of grades K-6 and one or more of grades 9-12. Some schools use more than one
standardized test so these individual percentages are not expected to sum to 100 percent.
"Standardized Tests Used" refers to the accountability tests used to assess all students in a
school, not just Opportunity Scholarship students.
Sources: Private school data are from the 2015-16 Private School Universe Survey and the North
Carolina Division of Non Public Education records. Public school data are from the 2015-16
U.S. Department of Education Public Elementary/Secondary School Universe Survey.
EMBARGOED UNTIL 12:01 AM ON JUNE 4, 2018
41
Table 5.
Constructing the Analysis Sample
Private Public Total
Took ITBS in 2017 297 401 698
Not included in analysis because:
No unique match with DPI data 48 76 124
Took wrong version of ITBS in 2017 0 8 8
Did not take/finish ITBS in 2017 0 7 7
Missing 2016 EOG 1 0 1
Not free/reduced lunch in 2016 - 58 58
Could not verify OS receipt 3 - 3
Final student count 245 252 497
Status of OS recipients
New 90 - -
Renewal 155 - -
Analytic dataset n 245 252 497
Note: ITBS stands for Iowa Test of Basic Skills; DPI stands for Department of Public Instruction; EOG stands for
the North Carolina End of Grade assessments, our measure of baseline achievement.
EMBARGOED UNTIL 12:01 AM ON JUNE 4, 2018
42
Table 6.
Covariate Means Before and After Inverse Propensity Weighting
Analyis /covariates Private Public Raw Std. Private Public Raw Std.
New OS recipients
Female 0.56 0.64 -0.08 -0.16 0.56 0.58 -0.02 -0.03
Black 0.48 0.51 -0.03 -0.06 0.48 0.52 -0.03 -0.07
Latino 0.06 0.15 -0.09 -0.30 0.06 0.04 0.02 0.05
Other race/ethnicity 0.24 0.19 0.04 0.11 0.24 0.21 0.03 0.06
Grade 5 0.25 0.20 0.05 0.12 0.25 0.27 -0.02 -0.05
Grade 6 0.30 0.11 0.19 0.49 0.30 0.29 0.01 0.03
Grade 7 0.15 0.15 0.00 0.00 0.15 0.14 0.00 0.01
Grade 8 0.15 0.27 -0.12 -0.31 0.15 0.16 -0.01 -0.03
Disciplinary incident 0.12 0.16 -0.04 -0.10 0.12 0.13 -0.01 -0.02
Math state EOG score 449.47 449.54 -0.07 -0.01 449.47 449.64 -0.17 -0.02
Reading state EOG score 449.75 448.15 1.60 0.16 449.75 450.14 -0.38 -0.04
Mean |difference| 0.17 0.04
Change in EOG
Female 0.56 0.63 -0.08 -0.16 0.56 0.55 0.01 0.01
Black 0.49 0.54 -0.05 -0.11 0.49 0.54 -0.05 -0.10
Latino 0.07 0.12 -0.05 -0.18 0.07 0.04 0.03 0.11
Other race/ethnicity 0.26 0.19 0.07 0.17 0.26 0.25 0.01 0.03
Grade 5 0.31 0.23 0.07 0.16 0.31 0.31 -0.01 -0.01
Grade 6 0.36 0.18 0.18 0.40 0.36 0.38 -0.01 -0.03
Grade 7 0.15 0.19 -0.04 -0.11 0.15 0.15 0.00 0.00
Grade 8 0.18 0.39 -0.21 -0.47 0.18 0.16 0.02 0.04
Disciplinary incident 0.14 0.19 -0.05 -0.15 0.14 0.13 0.01 0.03
Math state EOG score 448.75 448.67 0.08 0.01 448.75 448.95 -0.20 -0.02
Reading state EOG score 450.85 450.59 0.26 0.03 450.85 451.05 -0.21 -0.02
Math EOG change 0.15 0.22 -0.07 -0.01 0.15 0.50 -0.35 -0.06
Reading EOG change 5.82 4.46 1.36 0.22 5.82 6.03 -0.21 -0.03
Mean |difference| 0.17 0.04
Renewal OS recipients
Female 0.43 0.62 -0.19 -0.40 0.43 0.38 0.05 0.10
Black 0.43 0.36 0.06 0.13 0.43 0.38 0.04 0.09
Latino 0.18 0.36 -0.19 -0.43 0.18 0.16 0.02 0.05
Other race/ethnicity 0.16 0.14 0.02 0.05 0.16 0.23 -0.07 -0.20
Grade 5 0.03 0.11 -0.08 -0.33 0.03 0.04 -0.01 -0.03
Grade 6 0.29 0.33 -0.03 -0.07 0.29 0.26 0.04 0.08
Grade 7 0.24 0.13 0.11 0.28 0.24 0.29 -0.06 -0.15
Grade 8 0.29 0.21 0.08 0.18 0.29 0.25 0.04 0.09
Disciplinary incident 0.18 0.31 -0.13 -0.31 0.18 0.18 -0.01 -0.02
Math state EOG score 450.03 448.79 1.24 0.15 450.03 450.18 -0.16 -0.02
Reading state EOG score 445.57 444.80 0.77 0.07 445.57 445.88 -0.31 -0.03
Mean |difference| 0.22 0.08
Unweighted Weighted
Difference Difference
EMBARGOED UNTIL 12:01 AM ON JUNE 4, 2018
43
Table 6 continued
Analyis /covariates Private Public Raw Std. Private Public Raw Std.
No privates using ITBS
Female 0.59 0.64 -0.05 -0.10 0.59 0.58 0.01 0.03
Black 0.47 0.58 -0.11 -0.21 0.47 0.55 -0.07 -0.15
Latino 0.05 0.08 -0.03 -0.13 0.05 0.03 0.02 0.09
Other race/ethnicity 0.24 0.20 0.03 0.08 0.24 0.25 -0.01 -0.04
Grade 5 0.22 0.17 0.05 0.14 0.22 0.23 -0.01 -0.01
Grade 6 0.34 0.10 0.24 0.59 0.34 0.33 0.01 0.02
Grade 7 0.14 0.12 0.01 0.04 0.14 0.15 -0.02 -0.05
Grade 8 0.12 0.26 -0.14 -0.37 0.12 0.12 0.00 -0.01
Disciplinary incident 0.08 0.15 -0.07 -0.21 0.08 0.09 0.00 -0.01
Math state EOG score 450.76 449.17 1.59 0.18 450.76 451.04 -0.28 -0.03
Reading state EOG score 450.08 446.77 3.31 0.33 450.08 450.49 -0.40 -0.04
Mean |difference| 0.22 0.04
Only privates using ITBS
Female 0.55 0.65 -0.10 -0.21 0.55 0.56 -0.01 -0.02
Black 0.48 0.46 0.02 0.04 0.48 0.50 -0.02 -0.04
Latino 0.10 0.26 -0.15 -0.40 0.10 0.08 0.02 0.05
Other race/ethnicity 0.24 0.16 0.08 0.20 0.24 0.22 0.02 0.04
Grade 5 0.34 0.24 0.11 0.24 0.34 0.33 0.01 0.02
Grade 6 0.17 0.09 0.08 0.23 0.17 0.23 -0.06 -0.16
Grade 7 0.17 0.16 0.01 0.03 0.17 0.15 0.02 0.05
Grade 8 0.21 0.25 -0.04 -0.10 0.21 0.20 0.00 0.01
Disciplinary incident 0.21 0.15 0.06 0.16 0.21 0.21 -0.01 -0.02
Math state EOG score 447.34 448.87 -1.53 -0.16 447.34 445.96 1.38 0.15
Reading state EOG score 448.69 446.97 1.72 0.16 448.69 448.22 0.47 0.05
Mean |difference| 0.18 0.06
Difference Difference
Unweighted Weighted
EMBARGOED UNTIL 12:01 AM ON JUNE 4, 2018
44
Table 7.
Achievement Impact Associated with Participation in the North Carolina Opportunity Scholarship Program
Notes: Coefficients are for private school status from regressions with ITBS composite scores in math, reading, and language as the dependent variable, using
inverse propensity weighting. Standard errors in parentheses; clustered at the 2017 school level. + p<.10, * p<.05, ** p<.01.
Treatment group Covariates Math Reading Language Math Reading Language T C Total
New OS recipients No 6.890* 3.863 7.852* 0.38 0.21 0.44 89 156 245
(2.789) (3.041) (2.914)
Yes 6.487** 3.902+ 7.891** 0.36 0.22 0.44 89 156 245
(2.221) (2.136) (2.483)
Yes & change in EOG 6.709* 4.482 8.807 0.37 0.25 0.49 72 98 170
(2.553) (2.403) (2.498)
Renewal OS recipients No 5.987 7.497* 9.733* 0.33 0.42 0.54 68 140 208
(4.012) (3.560) (4.050)
Yes 6.012+ 7.644+ 9.412** 0.33 0.42 0.52 68 140 208
(3.235) (3.848) (3.347)
New OS recipients; No 0.114 1.690 0.842 0.01 0.09 0.05 59 157 216
school does not use ITBS (2.812) (3.263) (3.020)
Yes 0.744 1.835 1.347 0.04 0.10 0.07 59 157 216
(1.983) (2.151) (1.874)
New OS recipients; No 13.122** 8.586 17.144** 0.73 0.48 0.95 29 191 220
school uses ITBS (2.944) (5.441) (3.452)
Yes 11.291** 7.105* 15.495** 0.63 0.39 0.86 29 191 220
(2.875) (2.982) (3.204)
Effect sizesOLS results n

Contenu connexe

Tendances

Measurement Memo Re: Measuring the Impact of Student Diversity Program
Measurement Memo Re: Measuring the Impact of Student Diversity ProgramMeasurement Memo Re: Measuring the Impact of Student Diversity Program
Measurement Memo Re: Measuring the Impact of Student Diversity Programandrejohnson034
 
Patterns and Trends in Educational Opportunity for Students in Juvenile Justi...
Patterns and Trends in Educational Opportunity for Students in Juvenile Justi...Patterns and Trends in Educational Opportunity for Students in Juvenile Justi...
Patterns and Trends in Educational Opportunity for Students in Juvenile Justi...Jeremy Knight
 
Explore Plan
Explore PlanExplore Plan
Explore Planmngander
 
Pre k budgetand-planning
Pre k budgetand-planningPre k budgetand-planning
Pre k budgetand-planningStraughn Rainey
 
Pre k budgetand-planning
Pre k budgetand-planningPre k budgetand-planning
Pre k budgetand-planningStraughn Rainey
 
School Enrollment Brief: EPIC
School Enrollment Brief: EPICSchool Enrollment Brief: EPIC
School Enrollment Brief: EPICEducationNC
 
WA Special Ed. Comparisons. Dammeier Data Request.03.27.15
WA Special Ed. Comparisons. Dammeier Data Request.03.27.15WA Special Ed. Comparisons. Dammeier Data Request.03.27.15
WA Special Ed. Comparisons. Dammeier Data Request.03.27.15Lynne Tucker, MPA
 
The Role of Service Learning in the Retention of
The Role of Service Learning in the Retention ofThe Role of Service Learning in the Retention of
The Role of Service Learning in the Retention ofJoan Johns Maloney
 
Assessment on the allocation of Cash Grants of 4Ps beneficiaries to their dai...
Assessment on the allocation of Cash Grants of 4Ps beneficiaries to their dai...Assessment on the allocation of Cash Grants of 4Ps beneficiaries to their dai...
Assessment on the allocation of Cash Grants of 4Ps beneficiaries to their dai...IJAEMSJORNAL
 
Lipe, david the impact of a program specific orientation course focus v7 n1 2013
Lipe, david the impact of a program specific orientation course focus v7 n1 2013Lipe, david the impact of a program specific orientation course focus v7 n1 2013
Lipe, david the impact of a program specific orientation course focus v7 n1 2013William Kritsonis
 
Standards and Assessments: Benchmarking State Implementation of College- and ...
Standards and Assessments: Benchmarking State Implementation of College- and ...Standards and Assessments: Benchmarking State Implementation of College- and ...
Standards and Assessments: Benchmarking State Implementation of College- and ...SREB
 
Needs Assessment Memo for Modifying the Admissions Approach at NYC Specialize...
Needs Assessment Memo for Modifying the Admissions Approach at NYC Specialize...Needs Assessment Memo for Modifying the Admissions Approach at NYC Specialize...
Needs Assessment Memo for Modifying the Admissions Approach at NYC Specialize...andrejohnson034
 
Accountability: Benchmarking Implementation of College- and Career-Readiness ...
Accountability: Benchmarking Implementation of College- and Career-Readiness ...Accountability: Benchmarking Implementation of College- and Career-Readiness ...
Accountability: Benchmarking Implementation of College- and Career-Readiness ...SREB
 
Benchmarking perspectives recs
Benchmarking perspectives recsBenchmarking perspectives recs
Benchmarking perspectives recsSREB
 
North Carolina Should Focus on Early Childhood Learning in Order to Raise Ach...
North Carolina Should Focus on Early Childhood Learning in Order to Raise Ach...North Carolina Should Focus on Early Childhood Learning in Order to Raise Ach...
North Carolina Should Focus on Early Childhood Learning in Order to Raise Ach...EducationNC
 
Evaluation of Teachers and Leaders: Benchmarking State Implementation of Coll...
Evaluation of Teachers and Leaders: Benchmarking State Implementation of Coll...Evaluation of Teachers and Leaders: Benchmarking State Implementation of Coll...
Evaluation of Teachers and Leaders: Benchmarking State Implementation of Coll...SREB
 

Tendances (20)

Measurement Memo Re: Measuring the Impact of Student Diversity Program
Measurement Memo Re: Measuring the Impact of Student Diversity ProgramMeasurement Memo Re: Measuring the Impact of Student Diversity Program
Measurement Memo Re: Measuring the Impact of Student Diversity Program
 
AP_report
AP_reportAP_report
AP_report
 
Patterns and Trends in Educational Opportunity for Students in Juvenile Justi...
Patterns and Trends in Educational Opportunity for Students in Juvenile Justi...Patterns and Trends in Educational Opportunity for Students in Juvenile Justi...
Patterns and Trends in Educational Opportunity for Students in Juvenile Justi...
 
Explore Plan
Explore PlanExplore Plan
Explore Plan
 
Pre k budgetand-planning
Pre k budgetand-planningPre k budgetand-planning
Pre k budgetand-planning
 
Pre k budgetand-planning
Pre k budgetand-planningPre k budgetand-planning
Pre k budgetand-planning
 
School Enrollment Brief: EPIC
School Enrollment Brief: EPICSchool Enrollment Brief: EPIC
School Enrollment Brief: EPIC
 
WA Special Ed. Comparisons. Dammeier Data Request.03.27.15
WA Special Ed. Comparisons. Dammeier Data Request.03.27.15WA Special Ed. Comparisons. Dammeier Data Request.03.27.15
WA Special Ed. Comparisons. Dammeier Data Request.03.27.15
 
ED543109
ED543109ED543109
ED543109
 
The Role of Service Learning in the Retention of
The Role of Service Learning in the Retention ofThe Role of Service Learning in the Retention of
The Role of Service Learning in the Retention of
 
SES Report 07-08
SES Report 07-08SES Report 07-08
SES Report 07-08
 
Assessment on the allocation of Cash Grants of 4Ps beneficiaries to their dai...
Assessment on the allocation of Cash Grants of 4Ps beneficiaries to their dai...Assessment on the allocation of Cash Grants of 4Ps beneficiaries to their dai...
Assessment on the allocation of Cash Grants of 4Ps beneficiaries to their dai...
 
Lipe, david the impact of a program specific orientation course focus v7 n1 2013
Lipe, david the impact of a program specific orientation course focus v7 n1 2013Lipe, david the impact of a program specific orientation course focus v7 n1 2013
Lipe, david the impact of a program specific orientation course focus v7 n1 2013
 
Standards and Assessments: Benchmarking State Implementation of College- and ...
Standards and Assessments: Benchmarking State Implementation of College- and ...Standards and Assessments: Benchmarking State Implementation of College- and ...
Standards and Assessments: Benchmarking State Implementation of College- and ...
 
Needs Assessment Memo for Modifying the Admissions Approach at NYC Specialize...
Needs Assessment Memo for Modifying the Admissions Approach at NYC Specialize...Needs Assessment Memo for Modifying the Admissions Approach at NYC Specialize...
Needs Assessment Memo for Modifying the Admissions Approach at NYC Specialize...
 
Benchmarks square
Benchmarks squareBenchmarks square
Benchmarks square
 
Accountability: Benchmarking Implementation of College- and Career-Readiness ...
Accountability: Benchmarking Implementation of College- and Career-Readiness ...Accountability: Benchmarking Implementation of College- and Career-Readiness ...
Accountability: Benchmarking Implementation of College- and Career-Readiness ...
 
Benchmarking perspectives recs
Benchmarking perspectives recsBenchmarking perspectives recs
Benchmarking perspectives recs
 
North Carolina Should Focus on Early Childhood Learning in Order to Raise Ach...
North Carolina Should Focus on Early Childhood Learning in Order to Raise Ach...North Carolina Should Focus on Early Childhood Learning in Order to Raise Ach...
North Carolina Should Focus on Early Childhood Learning in Order to Raise Ach...
 
Evaluation of Teachers and Leaders: Benchmarking State Implementation of Coll...
Evaluation of Teachers and Leaders: Benchmarking State Implementation of Coll...Evaluation of Teachers and Leaders: Benchmarking State Implementation of Coll...
Evaluation of Teachers and Leaders: Benchmarking State Implementation of Coll...
 

Similaire à An Impact Analysis of North Carolina’s Opportunity Scholarship Program on Student Achievement

Research Report Flyer
Research Report FlyerResearch Report Flyer
Research Report FlyerSteve Junge
 
Career College Promise and CIHS
Career College Promise and CIHSCareer College Promise and CIHS
Career College Promise and CIHSEducationNC
 
Leanord foots, sherry dual-credit enrollment ije v2 n1 2014
Leanord foots, sherry dual-credit enrollment ije v2 n1 2014Leanord foots, sherry dual-credit enrollment ije v2 n1 2014
Leanord foots, sherry dual-credit enrollment ije v2 n1 2014William Kritsonis
 
UsingDualEnrollment_2015
UsingDualEnrollment_2015UsingDualEnrollment_2015
UsingDualEnrollment_2015Don Pitchford
 
Dual Enrollment: A Strategy for Career Readiness Webinar
Dual Enrollment: A Strategy for Career Readiness WebinarDual Enrollment: A Strategy for Career Readiness Webinar
Dual Enrollment: A Strategy for Career Readiness WebinarHobsons
 
Read to Achieve Report
Read to Achieve ReportRead to Achieve Report
Read to Achieve ReportEducationNC
 
Washington D.C. Schools
Washington D.C. SchoolsWashington D.C. Schools
Washington D.C. SchoolsSlacko23
 
4Discussion 6 Review of Four Indiana State Policies.docx
4Discussion 6 Review of Four Indiana State Policies.docx4Discussion 6 Review of Four Indiana State Policies.docx
4Discussion 6 Review of Four Indiana State Policies.docxtaishao1
 
4Discussion 6 Review of Four Indiana State Policies.docx
4Discussion 6 Review of Four Indiana State Policies.docx4Discussion 6 Review of Four Indiana State Policies.docx
4Discussion 6 Review of Four Indiana State Policies.docxdomenicacullison
 
An Analysis of North Carolina's Private School Landscape
An Analysis of North Carolina's Private School LandscapeAn Analysis of North Carolina's Private School Landscape
An Analysis of North Carolina's Private School LandscapeAnalisa Sorrells
 
No child left behind
No child left behindNo child left behind
No child left behindt5928
 
Competency report SBE
Competency report SBECompetency report SBE
Competency report SBEEducationNC
 
California State_Levinar
California State_LevinarCalifornia State_Levinar
California State_LevinarSharonne Navas
 
Report to the North Carolina General Assembly
Report to the North Carolina General AssemblyReport to the North Carolina General Assembly
Report to the North Carolina General AssemblyAlessandraQuattrocch
 
California College Readiness Block Grants
California College Readiness Block GrantsCalifornia College Readiness Block Grants
California College Readiness Block GrantsHobsons
 
We Must Have Even Higher Expectations For Teachers
We Must Have Even Higher Expectations For TeachersWe Must Have Even Higher Expectations For Teachers
We Must Have Even Higher Expectations For Teachersnoblex1
 
Achieve Closing the Expectations Gap 2014
Achieve Closing the Expectations Gap 2014Achieve Closing the Expectations Gap 2014
Achieve Closing the Expectations Gap 2014Achieve, Inc.
 
Attachment.aspx 3
Attachment.aspx 3Attachment.aspx 3
Attachment.aspx 3EducationNC
 
Early learning and LCFF
Early learning and LCFFEarly learning and LCFF
Early learning and LCFFCASupts
 

Similaire à An Impact Analysis of North Carolina’s Opportunity Scholarship Program on Student Achievement (20)

Research Report Flyer
Research Report FlyerResearch Report Flyer
Research Report Flyer
 
Career College Promise and CIHS
Career College Promise and CIHSCareer College Promise and CIHS
Career College Promise and CIHS
 
Leanord foots, sherry dual-credit enrollment ije v2 n1 2014
Leanord foots, sherry dual-credit enrollment ije v2 n1 2014Leanord foots, sherry dual-credit enrollment ije v2 n1 2014
Leanord foots, sherry dual-credit enrollment ije v2 n1 2014
 
UsingDualEnrollment_2015
UsingDualEnrollment_2015UsingDualEnrollment_2015
UsingDualEnrollment_2015
 
Dual Enrollment: A Strategy for Career Readiness Webinar
Dual Enrollment: A Strategy for Career Readiness WebinarDual Enrollment: A Strategy for Career Readiness Webinar
Dual Enrollment: A Strategy for Career Readiness Webinar
 
Read to Achieve Report
Read to Achieve ReportRead to Achieve Report
Read to Achieve Report
 
Washington D.C. Schools
Washington D.C. SchoolsWashington D.C. Schools
Washington D.C. Schools
 
4Discussion 6 Review of Four Indiana State Policies.docx
4Discussion 6 Review of Four Indiana State Policies.docx4Discussion 6 Review of Four Indiana State Policies.docx
4Discussion 6 Review of Four Indiana State Policies.docx
 
4Discussion 6 Review of Four Indiana State Policies.docx
4Discussion 6 Review of Four Indiana State Policies.docx4Discussion 6 Review of Four Indiana State Policies.docx
4Discussion 6 Review of Four Indiana State Policies.docx
 
An Analysis of North Carolina's Private School Landscape
An Analysis of North Carolina's Private School LandscapeAn Analysis of North Carolina's Private School Landscape
An Analysis of North Carolina's Private School Landscape
 
No child left behind
No child left behindNo child left behind
No child left behind
 
Competency report SBE
Competency report SBECompetency report SBE
Competency report SBE
 
California State_Levinar
California State_LevinarCalifornia State_Levinar
California State_Levinar
 
Report to the North Carolina General Assembly
Report to the North Carolina General AssemblyReport to the North Carolina General Assembly
Report to the North Carolina General Assembly
 
California College Readiness Block Grants
California College Readiness Block GrantsCalifornia College Readiness Block Grants
California College Readiness Block Grants
 
We Must Have Even Higher Expectations For Teachers
We Must Have Even Higher Expectations For TeachersWe Must Have Even Higher Expectations For Teachers
We Must Have Even Higher Expectations For Teachers
 
Achieve Closing the Expectations Gap 2014
Achieve Closing the Expectations Gap 2014Achieve Closing the Expectations Gap 2014
Achieve Closing the Expectations Gap 2014
 
Attachment.aspx 3
Attachment.aspx 3Attachment.aspx 3
Attachment.aspx 3
 
Essay On Higher Education
Essay On Higher EducationEssay On Higher Education
Essay On Higher Education
 
Early learning and LCFF
Early learning and LCFFEarly learning and LCFF
Early learning and LCFF
 

Plus de Mebane Rash

US Department of Education FAFSA Week of Action
US Department of Education FAFSA Week of ActionUS Department of Education FAFSA Week of Action
US Department of Education FAFSA Week of ActionMebane Rash
 
Propel NC: A New Community College Business Model for the New North Carolina ...
Propel NC: A New Community College Business Model for the New North Carolina ...Propel NC: A New Community College Business Model for the New North Carolina ...
Propel NC: A New Community College Business Model for the New North Carolina ...Mebane Rash
 
Preview of 2024 Teacher Working Conditions Survey
Preview of 2024 Teacher Working Conditions SurveyPreview of 2024 Teacher Working Conditions Survey
Preview of 2024 Teacher Working Conditions SurveyMebane Rash
 
Ecosystems-for-the-Future-of-Learning-FINAL-Report.pdf
Ecosystems-for-the-Future-of-Learning-FINAL-Report.pdfEcosystems-for-the-Future-of-Learning-FINAL-Report.pdf
Ecosystems-for-the-Future-of-Learning-FINAL-Report.pdfMebane Rash
 
summer_road_trip.pdf
summer_road_trip.pdfsummer_road_trip.pdf
summer_road_trip.pdfMebane Rash
 
slide_deck_the_forces_driving_change_in_wnc.pdf
slide_deck_the_forces_driving_change_in_wnc.pdfslide_deck_the_forces_driving_change_in_wnc.pdf
slide_deck_the_forces_driving_change_in_wnc.pdfMebane Rash
 
Haywood Community College_Immediate Student Support (1).pdf
Haywood Community College_Immediate Student Support (1).pdfHaywood Community College_Immediate Student Support (1).pdf
Haywood Community College_Immediate Student Support (1).pdfMebane Rash
 
BEST-NC-Teacher-Pay-Report.pdf
BEST-NC-Teacher-Pay-Report.pdfBEST-NC-Teacher-Pay-Report.pdf
BEST-NC-Teacher-Pay-Report.pdfMebane Rash
 
Executive Summary Convening 2023.pdf
Executive Summary Convening 2023.pdfExecutive Summary Convening 2023.pdf
Executive Summary Convening 2023.pdfMebane Rash
 
The Promise of CCP.pdf
The Promise of CCP.pdfThe Promise of CCP.pdf
The Promise of CCP.pdfMebane Rash
 
Education to Employment Ecosystem.pdf
Education to Employment Ecosystem.pdfEducation to Employment Ecosystem.pdf
Education to Employment Ecosystem.pdfMebane Rash
 
Career Pipelines.pdf
Career Pipelines.pdfCareer Pipelines.pdf
Career Pipelines.pdfMebane Rash
 
Wilkes Community College
Wilkes Community College Wilkes Community College
Wilkes Community College Mebane Rash
 
Making the Grade
Making the GradeMaking the Grade
Making the GradeMebane Rash
 
Redesigning School Performance Grades
Redesigning School Performance Grades Redesigning School Performance Grades
Redesigning School Performance Grades Mebane Rash
 
TeacherLicensure.pptx
TeacherLicensure.pptxTeacherLicensure.pptx
TeacherLicensure.pptxMebane Rash
 
The Gold(en) Blueprint
The Gold(en) BlueprintThe Gold(en) Blueprint
The Gold(en) BlueprintMebane Rash
 
Halifax-ITHelpdeskSolarApprent_JAN 2022.pdf
Halifax-ITHelpdeskSolarApprent_JAN 2022.pdfHalifax-ITHelpdeskSolarApprent_JAN 2022.pdf
Halifax-ITHelpdeskSolarApprent_JAN 2022.pdfMebane Rash
 
PSF Budget Analysis 2021-23
PSF Budget Analysis 2021-23 PSF Budget Analysis 2021-23
PSF Budget Analysis 2021-23 Mebane Rash
 

Plus de Mebane Rash (20)

US Department of Education FAFSA Week of Action
US Department of Education FAFSA Week of ActionUS Department of Education FAFSA Week of Action
US Department of Education FAFSA Week of Action
 
Propel NC: A New Community College Business Model for the New North Carolina ...
Propel NC: A New Community College Business Model for the New North Carolina ...Propel NC: A New Community College Business Model for the New North Carolina ...
Propel NC: A New Community College Business Model for the New North Carolina ...
 
Preview of 2024 Teacher Working Conditions Survey
Preview of 2024 Teacher Working Conditions SurveyPreview of 2024 Teacher Working Conditions Survey
Preview of 2024 Teacher Working Conditions Survey
 
Ecosystems-for-the-Future-of-Learning-FINAL-Report.pdf
Ecosystems-for-the-Future-of-Learning-FINAL-Report.pdfEcosystems-for-the-Future-of-Learning-FINAL-Report.pdf
Ecosystems-for-the-Future-of-Learning-FINAL-Report.pdf
 
summer_road_trip.pdf
summer_road_trip.pdfsummer_road_trip.pdf
summer_road_trip.pdf
 
slide_deck_the_forces_driving_change_in_wnc.pdf
slide_deck_the_forces_driving_change_in_wnc.pdfslide_deck_the_forces_driving_change_in_wnc.pdf
slide_deck_the_forces_driving_change_in_wnc.pdf
 
Haywood Community College_Immediate Student Support (1).pdf
Haywood Community College_Immediate Student Support (1).pdfHaywood Community College_Immediate Student Support (1).pdf
Haywood Community College_Immediate Student Support (1).pdf
 
BEST-NC-Teacher-Pay-Report.pdf
BEST-NC-Teacher-Pay-Report.pdfBEST-NC-Teacher-Pay-Report.pdf
BEST-NC-Teacher-Pay-Report.pdf
 
Executive Summary Convening 2023.pdf
Executive Summary Convening 2023.pdfExecutive Summary Convening 2023.pdf
Executive Summary Convening 2023.pdf
 
The Promise of CCP.pdf
The Promise of CCP.pdfThe Promise of CCP.pdf
The Promise of CCP.pdf
 
Education to Employment Ecosystem.pdf
Education to Employment Ecosystem.pdfEducation to Employment Ecosystem.pdf
Education to Employment Ecosystem.pdf
 
Career Pipelines.pdf
Career Pipelines.pdfCareer Pipelines.pdf
Career Pipelines.pdf
 
Wilkes Community College
Wilkes Community College Wilkes Community College
Wilkes Community College
 
Making the Grade
Making the GradeMaking the Grade
Making the Grade
 
Redesigning School Performance Grades
Redesigning School Performance Grades Redesigning School Performance Grades
Redesigning School Performance Grades
 
TeacherLicensure.pptx
TeacherLicensure.pptxTeacherLicensure.pptx
TeacherLicensure.pptx
 
The Gold(en) Blueprint
The Gold(en) BlueprintThe Gold(en) Blueprint
The Gold(en) Blueprint
 
Halifax-ITHelpdeskSolarApprent_JAN 2022.pdf
Halifax-ITHelpdeskSolarApprent_JAN 2022.pdfHalifax-ITHelpdeskSolarApprent_JAN 2022.pdf
Halifax-ITHelpdeskSolarApprent_JAN 2022.pdf
 
H324v4
H324v4H324v4
H324v4
 
PSF Budget Analysis 2021-23
PSF Budget Analysis 2021-23 PSF Budget Analysis 2021-23
PSF Budget Analysis 2021-23
 

Dernier

EMBODO Lesson Plan Grade 9 Law of Sines.docx
EMBODO Lesson Plan Grade 9 Law of Sines.docxEMBODO Lesson Plan Grade 9 Law of Sines.docx
EMBODO Lesson Plan Grade 9 Law of Sines.docxElton John Embodo
 
Incoming and Outgoing Shipments in 3 STEPS Using Odoo 17
Incoming and Outgoing Shipments in 3 STEPS Using Odoo 17Incoming and Outgoing Shipments in 3 STEPS Using Odoo 17
Incoming and Outgoing Shipments in 3 STEPS Using Odoo 17Celine George
 
Presentation Activity 2. Unit 3 transv.pptx
Presentation Activity 2. Unit 3 transv.pptxPresentation Activity 2. Unit 3 transv.pptx
Presentation Activity 2. Unit 3 transv.pptxRosabel UA
 
GRADE 4 - SUMMATIVE TEST QUARTER 4 ALL SUBJECTS
GRADE 4 - SUMMATIVE TEST QUARTER 4 ALL SUBJECTSGRADE 4 - SUMMATIVE TEST QUARTER 4 ALL SUBJECTS
GRADE 4 - SUMMATIVE TEST QUARTER 4 ALL SUBJECTSJoshuaGantuangco2
 
Oppenheimer Film Discussion for Philosophy and Film
Oppenheimer Film Discussion for Philosophy and FilmOppenheimer Film Discussion for Philosophy and Film
Oppenheimer Film Discussion for Philosophy and FilmStan Meyer
 
TEACHER REFLECTION FORM (NEW SET........).docx
TEACHER REFLECTION FORM (NEW SET........).docxTEACHER REFLECTION FORM (NEW SET........).docx
TEACHER REFLECTION FORM (NEW SET........).docxruthvilladarez
 
Activity 2-unit 2-update 2024. English translation
Activity 2-unit 2-update 2024. English translationActivity 2-unit 2-update 2024. English translation
Activity 2-unit 2-update 2024. English translationRosabel UA
 
How to Add Barcode on PDF Report in Odoo 17
How to Add Barcode on PDF Report in Odoo 17How to Add Barcode on PDF Report in Odoo 17
How to Add Barcode on PDF Report in Odoo 17Celine George
 
Expanded definition: technical and operational
Expanded definition: technical and operationalExpanded definition: technical and operational
Expanded definition: technical and operationalssuser3e220a
 
Concurrency Control in Database Management system
Concurrency Control in Database Management systemConcurrency Control in Database Management system
Concurrency Control in Database Management systemChristalin Nelson
 
Visit to a blind student's school🧑‍🦯🧑‍🦯(community medicine)
Visit to a blind student's school🧑‍🦯🧑‍🦯(community medicine)Visit to a blind student's school🧑‍🦯🧑‍🦯(community medicine)
Visit to a blind student's school🧑‍🦯🧑‍🦯(community medicine)lakshayb543
 
ClimART Action | eTwinning Project
ClimART Action    |    eTwinning ProjectClimART Action    |    eTwinning Project
ClimART Action | eTwinning Projectjordimapav
 
Transaction Management in Database Management System
Transaction Management in Database Management SystemTransaction Management in Database Management System
Transaction Management in Database Management SystemChristalin Nelson
 
Influencing policy (training slides from Fast Track Impact)
Influencing policy (training slides from Fast Track Impact)Influencing policy (training slides from Fast Track Impact)
Influencing policy (training slides from Fast Track Impact)Mark Reed
 
4.18.24 Movement Legacies, Reflection, and Review.pptx
4.18.24 Movement Legacies, Reflection, and Review.pptx4.18.24 Movement Legacies, Reflection, and Review.pptx
4.18.24 Movement Legacies, Reflection, and Review.pptxmary850239
 
Daily Lesson Plan in Mathematics Quarter 4
Daily Lesson Plan in Mathematics Quarter 4Daily Lesson Plan in Mathematics Quarter 4
Daily Lesson Plan in Mathematics Quarter 4JOYLYNSAMANIEGO
 
HỌC TỐT TIẾNG ANH 11 THEO CHƯƠNG TRÌNH GLOBAL SUCCESS ĐÁP ÁN CHI TIẾT - CẢ NĂ...
HỌC TỐT TIẾNG ANH 11 THEO CHƯƠNG TRÌNH GLOBAL SUCCESS ĐÁP ÁN CHI TIẾT - CẢ NĂ...HỌC TỐT TIẾNG ANH 11 THEO CHƯƠNG TRÌNH GLOBAL SUCCESS ĐÁP ÁN CHI TIẾT - CẢ NĂ...
HỌC TỐT TIẾNG ANH 11 THEO CHƯƠNG TRÌNH GLOBAL SUCCESS ĐÁP ÁN CHI TIẾT - CẢ NĂ...Nguyen Thanh Tu Collection
 
Q4-PPT-Music9_Lesson-1-Romantic-Opera.pptx
Q4-PPT-Music9_Lesson-1-Romantic-Opera.pptxQ4-PPT-Music9_Lesson-1-Romantic-Opera.pptx
Q4-PPT-Music9_Lesson-1-Romantic-Opera.pptxlancelewisportillo
 
ROLES IN A STAGE PRODUCTION in arts.pptx
ROLES IN A STAGE PRODUCTION in arts.pptxROLES IN A STAGE PRODUCTION in arts.pptx
ROLES IN A STAGE PRODUCTION in arts.pptxVanesaIglesias10
 

Dernier (20)

EMBODO Lesson Plan Grade 9 Law of Sines.docx
EMBODO Lesson Plan Grade 9 Law of Sines.docxEMBODO Lesson Plan Grade 9 Law of Sines.docx
EMBODO Lesson Plan Grade 9 Law of Sines.docx
 
Incoming and Outgoing Shipments in 3 STEPS Using Odoo 17
Incoming and Outgoing Shipments in 3 STEPS Using Odoo 17Incoming and Outgoing Shipments in 3 STEPS Using Odoo 17
Incoming and Outgoing Shipments in 3 STEPS Using Odoo 17
 
Presentation Activity 2. Unit 3 transv.pptx
Presentation Activity 2. Unit 3 transv.pptxPresentation Activity 2. Unit 3 transv.pptx
Presentation Activity 2. Unit 3 transv.pptx
 
GRADE 4 - SUMMATIVE TEST QUARTER 4 ALL SUBJECTS
GRADE 4 - SUMMATIVE TEST QUARTER 4 ALL SUBJECTSGRADE 4 - SUMMATIVE TEST QUARTER 4 ALL SUBJECTS
GRADE 4 - SUMMATIVE TEST QUARTER 4 ALL SUBJECTS
 
Oppenheimer Film Discussion for Philosophy and Film
Oppenheimer Film Discussion for Philosophy and FilmOppenheimer Film Discussion for Philosophy and Film
Oppenheimer Film Discussion for Philosophy and Film
 
TEACHER REFLECTION FORM (NEW SET........).docx
TEACHER REFLECTION FORM (NEW SET........).docxTEACHER REFLECTION FORM (NEW SET........).docx
TEACHER REFLECTION FORM (NEW SET........).docx
 
Activity 2-unit 2-update 2024. English translation
Activity 2-unit 2-update 2024. English translationActivity 2-unit 2-update 2024. English translation
Activity 2-unit 2-update 2024. English translation
 
How to Add Barcode on PDF Report in Odoo 17
How to Add Barcode on PDF Report in Odoo 17How to Add Barcode on PDF Report in Odoo 17
How to Add Barcode on PDF Report in Odoo 17
 
Expanded definition: technical and operational
Expanded definition: technical and operationalExpanded definition: technical and operational
Expanded definition: technical and operational
 
Concurrency Control in Database Management system
Concurrency Control in Database Management systemConcurrency Control in Database Management system
Concurrency Control in Database Management system
 
Visit to a blind student's school🧑‍🦯🧑‍🦯(community medicine)
Visit to a blind student's school🧑‍🦯🧑‍🦯(community medicine)Visit to a blind student's school🧑‍🦯🧑‍🦯(community medicine)
Visit to a blind student's school🧑‍🦯🧑‍🦯(community medicine)
 
ClimART Action | eTwinning Project
ClimART Action    |    eTwinning ProjectClimART Action    |    eTwinning Project
ClimART Action | eTwinning Project
 
Transaction Management in Database Management System
Transaction Management in Database Management SystemTransaction Management in Database Management System
Transaction Management in Database Management System
 
FINALS_OF_LEFT_ON_C'N_EL_DORADO_2024.pptx
FINALS_OF_LEFT_ON_C'N_EL_DORADO_2024.pptxFINALS_OF_LEFT_ON_C'N_EL_DORADO_2024.pptx
FINALS_OF_LEFT_ON_C'N_EL_DORADO_2024.pptx
 
Influencing policy (training slides from Fast Track Impact)
Influencing policy (training slides from Fast Track Impact)Influencing policy (training slides from Fast Track Impact)
Influencing policy (training slides from Fast Track Impact)
 
4.18.24 Movement Legacies, Reflection, and Review.pptx
4.18.24 Movement Legacies, Reflection, and Review.pptx4.18.24 Movement Legacies, Reflection, and Review.pptx
4.18.24 Movement Legacies, Reflection, and Review.pptx
 
Daily Lesson Plan in Mathematics Quarter 4
Daily Lesson Plan in Mathematics Quarter 4Daily Lesson Plan in Mathematics Quarter 4
Daily Lesson Plan in Mathematics Quarter 4
 
HỌC TỐT TIẾNG ANH 11 THEO CHƯƠNG TRÌNH GLOBAL SUCCESS ĐÁP ÁN CHI TIẾT - CẢ NĂ...
HỌC TỐT TIẾNG ANH 11 THEO CHƯƠNG TRÌNH GLOBAL SUCCESS ĐÁP ÁN CHI TIẾT - CẢ NĂ...HỌC TỐT TIẾNG ANH 11 THEO CHƯƠNG TRÌNH GLOBAL SUCCESS ĐÁP ÁN CHI TIẾT - CẢ NĂ...
HỌC TỐT TIẾNG ANH 11 THEO CHƯƠNG TRÌNH GLOBAL SUCCESS ĐÁP ÁN CHI TIẾT - CẢ NĂ...
 
Q4-PPT-Music9_Lesson-1-Romantic-Opera.pptx
Q4-PPT-Music9_Lesson-1-Romantic-Opera.pptxQ4-PPT-Music9_Lesson-1-Romantic-Opera.pptx
Q4-PPT-Music9_Lesson-1-Romantic-Opera.pptx
 
ROLES IN A STAGE PRODUCTION in arts.pptx
ROLES IN A STAGE PRODUCTION in arts.pptxROLES IN A STAGE PRODUCTION in arts.pptx
ROLES IN A STAGE PRODUCTION in arts.pptx
 

An Impact Analysis of North Carolina’s Opportunity Scholarship Program on Student Achievement

  • 1. EMBARGOED UNTIL 12:01 AM ON JUNE 4, 2018 1 An Impact Analysis of North Carolina’s Opportunity Scholarship Program on Student Achievement Anna J. Egalite D.T. Stallings Stephen R. Porter North Carolina State University Working Paper Abstract The North Carolina Opportunity Scholarship Program is a statewide private school voucher program, enacted in 2013 and launched in 2014 to provide state-funded vouchers worth up to $4,200 to eligible students entering Kindergarten through twelfth grade. Because public schools administer the criterion-referenced state test, whereas private schools administer any nationally normed test of their choosing, the research team recruited 698 students from the public and private school sectors to take a common third-party nationally-normed standardized test in spring 2017. Relying on baseline achievement and demographic data from the North Carolina Department of Public Instruction, a matching approach is utilized to maximize comparability between the public and private school student samples. Our preferred specification utilizes observations from 245 public and private students, controlling for a host of covariates, revealing first year impact estimates of .36 SD in math and .44 SD in language. Policy implications are discussed. Keywords: school choice; education policy; vouchers; academic achievement; private schooling
  • 2. EMBARGOED UNTIL 12:01 AM ON JUNE 4, 2018 2 An Impact Analysis of North Carolina’s Opportunity Scholarship Program on Student Achievement Established by North Carolina General Statute 115C-562 in 2013 and launched in the 2014-15 school year, the North Carolina Opportunity Scholarship Program provides state-funded vouchers of up to $4,200 per year for eligible students in kindergarten through twelfth grade to attend participating private schools. The program is funded by an annual appropriation established during the biennial state budget process and administered by the North Carolina State Education Assistance Authority (SEAA). Since the inception of the program in 2014-15, nearly $53 million dollars have been disbursed in scholarship funds. This analysis focuses on identifying the impact of the North Carolina Opportunity Scholarship Program on participating students’ academic achievement in math and reading. Although the legislation that established the program calls for an evaluation of the “learning gains or losses of students receiving scholarship grants,” as compared to similar students in public schools, no such evaluation has been conducted until now. Two primary challenges have inhibited an evaluation to date. First, the accountability requirements associated with the program require participating non-public schools to administer and submit scores from any nationally-normed standardized test of their choosing, whereas comparable public school students take the criterion-referenced state test, the North Carolina End of Grade exam. Thus, participating students do not have scores on a common metric that could be pooled for comparison to students in the public school sector. Second, although the establishing legislation calls for an evaluation of the program, it doesn’t incentivize applicants to participate in one, for example as a condition for applying to the program. This introduces recruitment challenges with regard to the collection of original test score data.
  • 3. EMBARGOED UNTIL 12:01 AM ON JUNE 4, 2018 3 In the spring of 2017, this research team traveled to the four regions of North Carolina with the highest number of Opportunity Scholarship users. Relying on a volunteer sample of students in the public and private school sectors in those regions, we administered Form E of the Iowa Test of Basic Skills—a nationally-normed standardized assessment of math and reading achievement. Using inverse propensity weights in a regression model to compare similar public school students to those students attending private schools with an Opportunity Scholarship, we generate impact estimates in mathematics, reading, and language. Although we do not claim to present causal estimates of the program impact, we can account for observed differences between the two groups in terms of demographic characteristics, disciplinary records, and prior test scores. The effect sizes observed are positive, large, and statistically significant, ranging from .25 to .49 standard deviations (henceforth SD). Background Program description. North Carolina’s Opportunity Scholarship Program joins a wave of recently-enacted private school choice programs that feature relatively broad eligibility criteria, expanding access to an entire state instead of a single city such as earlier programs established in Cleveland, OH; Milwaukee, WI; or Washington D.C. Compared to similar programs in other states, students participating in North Carolina’s voucher program are eligible to receive a relatively modest scholarship of up to $4,200 per year for tuition and fees for books, transportation, or school equipment (Table 1). Eligibility is determined by a two-part test. First, the student must meet at least one of the following initial criteria: students must have been enrolled in a North Carolina public school during the previous semester; students must be entering kindergarten or first grade; students must have received a scholarship for the previous semester; students must be in foster care or recently adopted; or students must have a parent or
  • 4. EMBARGOED UNTIL 12:01 AM ON JUNE 4, 2018 4 legal guardian who is on full-time active duty in the military. Second, students must reside in a household with an income level that doesn’t exceed 133 percent of the amount required for the federal free or reduced-price lunch program. Table One About Here The youngest of the four programs highlighted here, North Carolina’s Opportunity Scholarship program is relatively small. In 2016-17, 5,624 students used a state-funded voucher to attend a private school but changes to the statute in April 2016 added eligibility pathways for children in military families and the 2016 Appropriations Act called for increasing funds by at least ten million dollars every year for ten years, which will likely drive up enrollment numbers in future years. Of the four statewide programs highlighted in Table 1, Florida’s program is the largest with 98,936 participants in 2016-17, followed by Indiana’s program with 34,299 participants. A notable feature of Florida’s program that has likely contributed to recent enrollment growth in the program is that students are no longer required to have been enrolled in a public school before applying for a scholarship. Eligibility is determined solely by household income or a child’s foster care status. The second-largest program, Indiana’s Choice Scholarship Program stands out for having the highest number of eligibility pathways by which students can qualify for the program. With eight pathways in total, Hoosier students can qualify through a sibling, by applying from a failing public school, or numerous other routes. None of these pathways allow a student’s household income to exceed 200% of federal free/ reduced price lunch program limit, however, which ensures the program retains its means-tested focus. Although currently in third place in terms of student participants (6,995 in 2016-17), Louisiana’s program has the strictest eligibility criteria. Students older than kindergarten age must meet the income requirement and be currently attending an underperforming public school.
  • 5. EMBARGOED UNTIL 12:01 AM ON JUNE 4, 2018 5 Thus, it is reasonable to expect enrollment in North Carolina’s program to overtake Louisiana’s program in the coming years based on eligibility criteria alone. Evaluation mandate. The legislation that created the Opportunity Scholarship Program calls for an evaluation that compares the learning gains or losses of participating students on a statewide basis (North Carolina General Statute 115C- 562, 2013). One way to accomplish this task would be to rely on annual test results that are submitted annually to the SEAA and corresponding records of comparable public school students who took the same assessment. This is how researchers have evaluated Indiana’s Choice Scholarship Program (Waddington & Berends, 2017), Ohio’s EdChoice Program (Figlio & Karbownik, 2016), and Louisiana’s Opportunity Scholarship Program (Abdulkadiroglu, Pathak, & Walters, 2018: Mills & Wolf, 2017), where students in both the public and private school sector took the state assessment. However, participating schools in North Carolina’s Opportunity Scholarship program are not required to administer the state test or any other common assessment; rather, they are free to administer any nationally-normed standardized test of their choosing. This has resulted in schools’ use of a diverse set of tests from different publishers, which means student performance cannot be easily compared within the non-public school sector or between the public and non- public school sectors (Table 2). << Table Two About Here >> Because there is no common metric on which to judge student performance, a second way to accomplish the task set forth by the legislation would be to invite students to participate in new data collection efforts, for example by incentivizing or requiring their participation in an evaluation at the time of application to the program or by reaching out to scholarship recipients and inviting them to attend an optional test administration session. In such a scenario, researchers
  • 6. EMBARGOED UNTIL 12:01 AM ON JUNE 4, 2018 6 could administer a common standardized test to a sample of OS students and comparable public school students with similar socioeconomic backgrounds. This approach has been used to evaluate the Milwaukee Parental Choice Program (Witte, Carlson, Cowen, Fleming, & Wolf, 2012), the Charlotte Scholarship Fund (Greene, 2001), the Indianapolis Voucher Program (Weinschrott & Kilgore, 1998) and the Washington D.C. Opportunity Scholarship Program (Wolf et al., 2013) and it is the approach adopted here to evaluate the academic impact of North Carolina’s Opportunity Scholarship Program. Literature Review Since the establishment of the nation’s first private school choice program in Milwaukee in 1990, researchers have conducted numerous lottery-based studies to quantify the achievement impact of these programs, which have been both publicly-funded (such as the voucher programs in Milwaukee, WI; Cleveland, OH; and Washington D.C.) and privately-funded (such as the New York City School Choice Scholarships Foundation Program and the Charlotte Scholarship Fund). In general, these lottery-based studies have revealed small positive impacts overall, with larger positive impacts observed for subgroups of interest, such as African American students, students of low socioeconomic status, or students who were initially low-achieving (Table 3). Table Three About Here Among the 15 random-assignment studies detailed in Table 1, eight have revealed positive impacts in math or reading overall or for at least one subgroup of interest (Barnard, Frangakis, Jin, & Rubin, 2003; Cowen, 2008; Greene, 2001; Greene, Peterson & Du, 1999; Howell, Wolf, Campbell, & Peterson, 2002; Jin, Barnard, & Rubin, 2010; Rouse, 1998), two studies revealed null impacts (Bitler, Domina, Penner, & Hoynes, 2014; Krueger & Zhu, 2004), and three studies revealed negative impacts for the overall sample or for at least one subgroup
  • 7. EMBARGOED UNTIL 12:01 AM ON JUNE 4, 2018 7 (Abdulkadiroglu, Pathak, and Walters, 2018; Dynarksi, Rui, Webber Gutmann & Bachman, 2017; Mills & Wolf, 2017). Although the weight of the evidence, therefore, points towards a positive impact associated with voucher usage, the three most recent studies all reveal negative impacts. This raises interesting questions about the characteristics of contemporary programs and the contexts in which they’ve been studied. In Washington D.C., for example, a 2017 lottery analysis of the D.C. Opportunity Scholarship Program reveals null impacts on reading scores and a statistically significant negative impact of 7.3 percentile points on the math achievement of students who used a voucher (Dynarksi, Rui, Webber Gutmann & Bachman, 2017). Given the dramatic spread of charter schooling in the nation’s capital, it is important to acknowledge that 42 percent of students in the control group were attending a charter school. Thus, the negative impact of private school voucher usage in this study should be interpreted as being relative to the impact of attending a traditional public or a charter school whereas in earlier studies detailed in Table 2, the counterfactual was almost always a traditional public school. The other two negative studies in Table 2 are evaluations of the Louisiana Scholarship Program. Given that statewide private school choice programs are a newer policy development than the highly targeted citywide programs that predominated the private school choice landscape throughout the 1990s and early 2000s, it is not surprising that there have been fewer lottery-based studies of such programs. Nonetheless, the evidence marshalled to date has raised concerns among many in the school choice community because of the unprecedented and large negative impacts associated with voucher usage in the Pelican State. Abdulkadiroglu, Pathak, and Walters (2018) leverage Louisiana’s oversubscribed application lottery to experimentally examine the impact of the Louisiana Scholarship Program
  • 8. EMBARGOED UNTIL 12:01 AM ON JUNE 4, 2018 8 in the first year after its statewide expansion in 2012, finding large and statistically significant negative impacts across all subjects examined. Attending a private school with a voucher reduced student achievement in math by 41 percent of a SD, with reductions of 8, 26, and 33 percent in reading, science, and social studies achievement, respectively. Second year impact estimates by Mills and Wolf (2017) reveal similarly large and statistically significant negative impacts in both English Language Arts and mathematics for students who enrolled in their first- choice private school through the program. Specifically, voucher users score 18 percent of a SD lower in English Language Arts and 34 percent of a SD lower in math after two years in the program. Given these large negative effects, many have questioned what differs about the Louisiana context that might explain the negative impacts. An ancillary analysis by Abdulkadiroglu and colleagues raises questions about the quality of private schools accepting voucher students in Louisiana, as participating schools appear to have been experiencing declining enrollment prior to the passage of the voucher law. Further evaluation work will be necessary to determine how the quality of participating private schools is evolving as the program ages and regulations to address private school quality are implemented (White, 2016). Two other evaluations of statewide voucher programs have been conducted in recent years that do not rely on a lottery-based design but employ alternative approaches to causal inference that attempt to approximate a gold-standard design. First, Figlio and Karbownik (2016) employ a propensity score matching approach to evaluate Ohio’s EdChoice program. Utilizing student records from 2003-04 to 2012-13, Figlio and Karbownik report substantial negative program impacts in both math and English Language Arts, with the largest negative effects observed in math. The authors note that these negative effects cannot be explained by the transition effects of switching to a new private school because they persist over time.
  • 9. EMBARGOED UNTIL 12:01 AM ON JUNE 4, 2018 9 Second, Waddington and Berends (2017) employ a difference-in-differences model with propensity score matched students to evaluate achievement changes for students in grades three through eight in the first four years of the Indiana Choice Scholarship Program. After one year in program, there are no differences in ELA outcomes but math scores decline by 10 percent of a SD, on average, for students who participate in the voucher program. After four years, however, there are no longer any statistically significant differences in either math or ELA outcomes, leading the authors to conclude that the program had a null average impact. In summary, recent evaluations of the relatively young, statewide voucher programs in Louisiana, Ohio, and Indiana point to potentially substantial negative impacts associated with initial voucher use, contrary to a consistent body of evidence prior to 2017 that showed null to positive impacts associated with voucher usage in the United States. A high-quality analysis of North Carolina’s Opportunity Scholarship Program, a close cousin of these three programs, would provide a valuable data point on the impact of contemporary private school choice programs. Literature on the OS Program. Enacted in 2013 and first implemented in the 2014-15 school year, the North Carolina Opportunity Scholarship program is currently serving its fourth cohort of voucher students. To date, the only evaluation of the program’s impact on student achievement is a report by the Children’s Law Clinic at Duke Law School (Wettach, 2017). No statistical tests are employed to compare student performance in this report, nor are students assessed using a common test. Instead, the author presents the percentage of voucher students scoring above average on any of the standardized tests given in a subset of private schools (i.e., those schools with greater than 25 voucher enrollees) and compares this percentage to the average National Assessment of Educational Progress (NAEP) performance by all low-income
  • 10. EMBARGOED UNTIL 12:01 AM ON JUNE 4, 2018 10 students in the public schools. Vastly different sample sizes in the two groups under comparison raise questions about uneven measurement error in the two sectors being compared. Further, students in these two groups differ in terms of gender, race, age, family background, prior academic achievement, and numerous other background characteristics that are not accounted for with a statistical model of any kind. This is an important omission because descriptive data on program participants demonstrates that voucher students represent a distinct subgroup of students in the state (Egalite, Porter, & Stallings, 2017). For example, voucher students reside in some of the lowest-income households in North Carolina, with an adjusted median household income in 2016-17 of $16,213 for new voucher recipients and $15,000 for renewal voucher recipients.1 Methodology Recruitment. In Spring 2017, the research team collaborated with the leadership of public schools, non-public schools, and partner organizations in four geographic regions of North Carolina to recruit a volunteer sample of low-income students in grades 4 through 8 who likely qualified for the Opportunity Scholarship Program, which has an eligibility threshold of 133% of the federal free and reduced lunch guideline. Student eligibility for the free and reduced-price lunch program was later confirmed by accessing public school student records made available by the Department of Public Instruction and those students who did not meet the income criteria were excluded from our analyses. Recruitment on the public school side adhered to the following protocol: We first applied for separate IRB approval in each participating school district, as well as at the university level, then commenced a four-stage approach to recruiting unpaid student volunteers to participate in 1 Adjusted per-household income is calculated as household income / square root of household size, a commonly used approach to account for household savings resulting from economies of scale and resource-sharing.
  • 11. EMBARGOED UNTIL 12:01 AM ON JUNE 4, 2018 11 data collection. Starting at the district level, we approached the public school superintendents of those geographic regions that featured high numbers of OS students to request permission to recruit volunteers in their schools to serve as our comparison group. Once a cooperation agreement was established with four public school superintendents, we coordinated with the head of testing in each district to identify the highest-poverty public schools in those districts. We next reached out to individual school principals to request their cooperation with the study. Once principals consented, school personnel distributed explanatory letters to families on our behalf, describing the goals of the research project and requesting parental consent for student participation in the research project. Finally, we requested student assent to participate in data collection. Specifically, on the day of testing, students were given a children’s version of the parental information letter, written in simple language that explained the purpose of the research, any expected risks or benefits, and notifying them that their participation was voluntary and they were free to opt out at any time. Recruitment procedures on the private school side adhered to the following protocol: We started by making courtesy calls to the private school associations in the state, notifying them about the project so they would have information at their fingertips to answer questions from private school leaders in their network. We then commenced one-on-one recruitment phone calls with individual school principals and meetings with advocacy groups and legislators on both sides of the issue. The bulk of recruitment support was ultimately provided by the organization, Parents for Educational Freedom in North Carolina, which encouraged private schools to respond to our request to participate in the study and helped schools schedule data collection sessions with us. Parent and student consent procedures followed the protocols already described and were identical for private and public school students.
  • 12. EMBARGOED UNTIL 12:01 AM ON JUNE 4, 2018 12 All test administration was conducted by our research team and by third-party research contractors on school grounds during the school day. The test administrators were all trained in common protocols and ethical considerations to ensure that the testing conditions were consistent across sites. The team arrived at each school site at the start of the school day and coordinated with school personnel to set up the room with testing booklets, scratch paper, and pencils. Parental consent letters were collected prior to our arrival by school personnel. In addition, students were provided with an assent form on the day that further allowed them to opt out of testing, if necessary. Testing sessions took approximately two hours in total. Unfortunately, students with special educational needs were excluded from all data collection efforts as the researchers did not have the manpower to provide special testing accommodations as needed. School description. In total, we collected test scores from volunteer students in 24 private schools and 14 public schools (Table 4). Sample sizes were larger in the public schools, with a mean of 35 tested students per site and a median of 23 students. On the private school side, there was a mean of 12 tested students per site and a median of seven students. We visited every private school that agreed to be in the study, including a school with just one student volunteer and another with 43 students. Data for 19 private schools were located in federal data files and data for 16 schools were located in state records from the Division of Non Public Education. The reader should note that no descriptive data was located for three private schools in the testing sample so those schools are excluded from the descriptive data presented in Table 4 and the discussion presented in the next section. << Table Four About Here >> Almost all (95 percent) of the private schools in our sample had a library or media center, one indicator of how well resourced a given school is. Approximately half (53 percent) of the
  • 13. EMBARGOED UNTIL 12:01 AM ON JUNE 4, 2018 13 private schools visited were Catholic schools, 26 percent were Christian (no specific denomination), 16 percent were Baptist, and 5 percent were some other religion such as Methodist or Episcopal. The private schools visited had a median enrollment of 225, with a minimum enrollment of 107 and a maximum of 1,402. The majority of the private schools (74 percent) were located in a city or suburb (16 percent), the median pupil teacher ratio was 12, and the median number of full time equivalent teachers was 28. All private schools in the state are required to report which standardized tests they use for accountability purposes to the North Carolina Division of Non Public Education so we also report this information for the schools in our sample. The most commonly used test was the Iowa Test of Basic Skills (used by 44 percent of the schools), followed by the Terra Nova (31 percent) and the Stanford Achievement Test (25 percent). Data for all 14 of the public schools in our sample were located in federal files. All of the public schools visited were traditional public (93 percent) or magnet schools (7 percent) and all qualified for school wide Title 1, a common proxy for high-poverty schools. This latter selection criteria was by design, to maximize the chance of recruiting comparable low-income matches for the OS students in the treatment condition. The public schools were slightly larger than the private schools visited, with a median enrollment of 650, a minimum of 340 and a maximum of 930. Although half of the public schools in our sample are coded as being located in a rural area, they were all located in the same geographic regions of the state as the private schools visited. This difference in urban locale may also reflect differences in how the Private School Universe Survey and the Public Elementary/Secondary School Universe Survey code urbanity (i.e., the private school survey uses the categories city, suburb, town, rural; whereas the public school survey uses the categories city, large; city, mid-size; city, small; suburb, large; suburb, midsize;
  • 14. EMBARGOED UNTIL 12:01 AM ON JUNE 4, 2018 14 suburb, small; town, fringe; town, distant; town, remote; rural, fringe; rural, distant; rural, remote). Finally, the median public school pupil teacher ratio was 14, and the median number of full time equivalent teachers was 45. All of the public schools administer the North Carolina End of Grade tests. Estimation strategy. We conduct a propensity score analysis to estimate the impact of the program, a commonly used approach to causal inference in the voucher literature when a lottery study is not possible. Students’ observable characteristics are used to predict their likelihood of using a voucher and these propensities are then used to construct estimation weights that result in comparable treatment and control groups. Within-study comparisons are one approach researchers have employed to assess the validity of matching approaches such as the one employed here, with generally encouraging results. Ackerman and Egalite (2017) leverage data on Florida charter schools between 2001 and 2009 to assess the validity and sensitivity of a commonly-used matching approach in the school choice literature, popularized by the Stanford Center for Research on Education Outcomes (CREDO). One of the primary contributions of the Ackerman and Egalite paper is its test of the sensitivity of results that rely on “virtual control records” that are generated from the records of up to seven comparison group students for every one student in the treatment group. They find no differences in estimates produced by models that feature up to seven-to-one versus one-to-one matching. Second, this analysis assesses the internal validity of the matching approach generally, by comparing the point estimates produced by a matching approach to those produced by an instrumental variables analysis. The authors note that the two sets of results are comparable in both magnitude and direction.
  • 15. EMBARGOED UNTIL 12:01 AM ON JUNE 4, 2018 15 Bifulco (2012) employs an even more rigorous test of the validity of nonexperimental estimators by judging their performance against experimental data from two interdistrict magnet schools. He concludes that the use of pretreatment measures of academic performance is critical, reducing the bias in a nonexperimental approach by 64 to 96 percent. Similarly, within-study comparisons of non-experimental methodological approaches by Angrist, Cohodes, Dynarksi, Fullerton, Kane, Pathak, & Walters (2011), Abdulkadiroğlu, Angrist, Cohodes, Dynarksi, Fullerton, Kane, & Pathak (2009) and Fortson, Verbitsky-Savitz, Kopa, & Gleason (2012) report promising replication results when the non-experimental method accounts for prior test scores and draws the comparison group from the same traditional public schools previously attended by the students in the treatment group. Data and Methodology Sample. In total, there were 698 low-income students tested in spring 2017: 297 in private schools and 401 in public schools (Table 5). Student answer sheets were machine-scored by Houghton Mifflin Harcourt and the scores were returned to us in a digital format. To construct the final analysis sample, we merge these records with student data from the North Carolina Department of Public Instruction (DPI). This allows us to add rich demographic data and prior test scores to each student record. Because we have to merge by student name, 124 observations are dropped at this stage, either because a reliable match could not be made with DPI data (e.g., the student reported a nickname instead of their legal name on the ITBS answer sheet), or because a name matched with multiple records for that grade level in the DPI data (e.g., in the case of students with very common first and last names), creating uncertainty as to the true match. In both of these scenarios, we opt for the conservative approach of dropping records when we cannot be sure of an exact match. A further eight students are dropped because
  • 16. EMBARGOED UNTIL 12:01 AM ON JUNE 4, 2018 16 they were mistakenly given the wrong test for their grade level in 2017 (i.e., some 4th graders took the 5th grade test and vice versa). An additional seven students opted not to complete the tests on testing day and are dropped from the sample as a result. To ensure comparability between OS students and students in public schools, 58 public school students who were not listed as free and reduced lunch eligible in the 2016 DPI data are removed from the analysis, along with three students who could not be verified in the OS records. These final two screens ensure that every student in both public and private schools in our sample has been identified as low-income. The final student count in the analytic dataset is 497 students, with 245 in private schools and 252 in public schools. << Table Five About Here >> Once the analytic dataset has been established, we next define the matching algorithm. Every public and private school student in our sample has already been verified as being low- income so our primary matching covariates are End of Grade (EOG) standardized test scores from 2016. As detailed in the description of the analytic approach below, we also account for demographic differences between the two groups. EOG scores. All public school students have EOG records from 2016, but only 89 out of 245 private school students have EOG records from 2016. Of these, 29 (i.e., 12%) attended a public school in 2016 but the number of membership days suggest they did not attend for the entire school year, which may explain why they are missing EOG exam scores from spring 2016. Another 31 (i.e., 13%) have EOG records from 2015, suggesting that their missing 2016 EOG records are due to participation in the OS program for two years rather than just one. In the latter scenario, we run the analyses both with and without these students in order to cleanly estimate
  • 17. EMBARGOED UNTIL 12:01 AM ON JUNE 4, 2018 17 one-year impacts, as compared to running models that would estimate a mixture of one and two- year impacts. Outcome measures. The Iowa Test of Basic Skills (ITBS) is a standardized, nationally norm-referenced test. This evaluation relies upon Form E, which is the ITBS Survey Battery, a shorter version of the ITBS Complete Battery, which would take several days to administer. The survey battery consists of three 30-minute tests in the areas of reading, language, and math, which we administered in a single testing session. We relied upon the tests at Levels 10 through 14, which correspond to grade levels four through eight. Students were administered the test that matched their current grade level. Students’ answer booklets were machine-scored by the test publishers and the results were made available to the research team for analysis.2 Analytical approach. We use inverse propensity weights (IPW) in a regression model to estimate the effect of private school attendance through the Opportunity Scholarship Program on students’ academic performance. IPW adjusts for differences between the treatment and control groups by using some form of the inverse of the predicted probability of treatment as a weight in a statistical model. IPW is one of a general class of techniques commonly referred to as matching or propensity score analysis. Propensity score analysis relies on two assumptions (Rosenbaum & Rubin, 1983): 1. The covariates used to generate the propensities are such that the potential outcomes under treatment and control are independent of treatment status, conditional on the covariates. 2 Specific information on the validity and reliability of the Iowa tests is available here: https://itp.education.uiowa.edu/ia/documents/ITBS-Research-Guide.pdf
  • 18. EMBARGOED UNTIL 12:01 AM ON JUNE 4, 2018 18 2. There are a sufficient number of observations with similar propensities for both treatment and control. The first assumption cannot be tested empirically and is instead a matter of argument. In other words, reasonable people can disagree as to whether a particular propensity score analysis has used the relevant set of covariates in the propensity model. In the next section, therefore, we present an argument in favor of the covariates selected in this analysis. We rely upon those variables that are expected to differ between voucher and non- voucher students and that are expected to influence student outcomes on a standardized assessment. These include gender, race/ethnicity, school grade level in 2017, and whether the student had any disciplinary incidents in public school in 2016. In addition, we match on state EOG math and reading scores from 2016, which are vertically scaled and thus appropriate for matching in this manner. The charter school literature shows that matching on gender, race, cohort, and pretreatment test scores typically yields treatment effect estimates similar to analyses using lotteries (Dobbie & Fryer, 2017). Of these variables, pretreatment test scores are the most important (Bifulco, 2012). We note that by limiting the public school sample to students who qualify for free or reduced lunch, we have exact matched both groups by low income status. We tested three versions of the logistic regression model predicting voucher receipt. The base model included the covariates listed above and squared terms for math and reading EOG scores. The second model added interactions between the grade indicators and EOG scores, and the third included interactions between the grade indicators and the squared EOG terns. For each analysis we chose the model specification that yielded the lowest average standardized bias across the covariates. Given our small sample sizes after establishing common support, we reset individual student’s propensity weights to 4 if they were greater than 4, to prevent undue
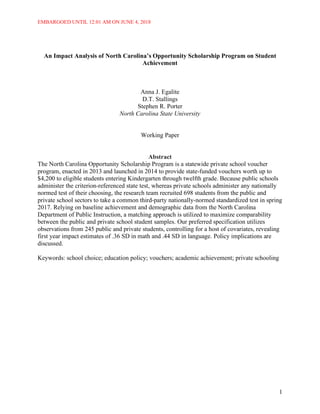
  • 19. EMBARGOED UNTIL 12:01 AM ON JUNE 4, 2018 19 influence over our results (Cole and Hernan, 2008; Lee et al., 2011). The second assumption can be verified visually by inspecting the distribution of propensities for treated and control students. Figure 2 shows the distribution of the propensities for private and public school attendees in our five sets of analyses, and indicates sufficient overlap for analysis. We established common support by removing from the analysis students whose propensities were less than the maximum of the minimum propensities for the two groups, or greater than the minimum of the maximum propensities of the two groups. The majority of students removed due to lack of overlap were public school students with very low propensities of treatment. <<Figure Two About Here >> Because families who choose to use a voucher are typically unrepresentative of the general population (Egalite, Porter, & Stallings, 2017), we use inverse propensity weights to estimate the average treatment effect of the treated (ATT), rather than the average treatment effect. Table 6 shows the raw and weighted covariate means for the public and private school students in the five analytic samples. The weighted means use the ATT weights as survey weights, adjusting for the propensity of being a voucher participant. << Table Six About Here >> Table 6 reveals any differences between the two groups before the matching process occurs. Focusing on the sample of new OS recipients (top panel), students attending private schools are less likely to be female (-8 percentage points), less likely to be Black (-3 percentage points), and less likely to be Latino/a (-9 percentage points). They are also more likely to be in lower grades and less likely to be in higher grades in the 2017 school year. Private school students were less likely to have experienced a disciplinary incident during the 2016 school year
  • 20. EMBARGOED UNTIL 12:01 AM ON JUNE 4, 2018 20 (-.10 percentage points) and scored higher on the previous year reading EOG exam (.16 SD). The average covariate bias before weighting is .17 SD. After weighting, these differences largely disappear. All of the bias measures for the covariates are less than .10, with over half less than .05. The average covariate bias after weighting drops to .04 SD. Results are similar for the other analytics samples. Results We estimate the effect of the Opportunity Scholarship Program in two ways (Table 7). First, we use a bivariate regression model with a dummy variable indicating treatment; this is equivalent to a simple t-test between the two groups. Second, we use a multiple regression model with the matching covariates included as control variables. The second approach controls for remaining differences between the two groups after weighting and increases our statistical power; this is our preferred specification. For each analysis, the ATT inverse propensity weights are used to ensure comparability between the two groups. << Table Seven About Here >> We first estimate the effect of voucher receipt on the sample of new voucher recipients. These are students in their first year of private school using the voucher during the 2016-2017 school year. The top panel of Table 7 shows the differences in performance on the ITBS for this treatment group compared to the public school sample. In general, the results show that in our testing sample, voucher recipients scored higher than their public school counterparts in all three subject areas examined—mathematics, reading, and language. The standard deviation in our sample for the three tests is around 18 points, so the effect sizes for voucher recipients range from .22 to .44 SD).
  • 21. EMBARGOED UNTIL 12:01 AM ON JUNE 4, 2018 21 This analysis accounts for static differences between OS students and public school students, but not dynamic changes. For example, both sets of students may appear similar in terms of previous year EOG test scores, but parents may pull students from public schools based on dynamic changes in their EOG test performance over time. As a robustness check, therefore, we repeat our analyses, but include as well the change in math and reading EOG test scores from 2015 to 2016. Results are generally still positive, but only the math effect is statistically significant now, which may be related to the reduction in statistical power associated with going from 245 observations to 170, a 31 percent drop in sample size. One downside associated with focusing on new OS students is that the estimated impact of the voucher cannot be separated from the impact of switching schools. If the treatment group students are slow to adjust to the standards, expectations, and culture of their new schooling environment, this may attenuate the estimated impact of the voucher. The bias could work in the opposite direction too, if the initial excitement of having “won” a voucher seat motivates students to put forth greater effort in the short run, temporarily boosting achievement but not resulting in sustained gains into the second year of voucher use. To generate estimates that are clean of these potential biases therefore, we next estimate the impact of voucher use on renewal students instead. Here, the treatment group consists of voucher students in their second year of voucher use, and the propensity weights for both the public and private school matched groups are constructed using the 2015 EOG instead of the 2016 EOG. In these models, impacts in all three subjects—math, reading, and language—remain positive, although only the language impacts are statistically significant at p < .05, which may be related to the drop in sample size required to run these models. Of note, the estimated impacts on reading and language scores actually increase by 3.742 points (i.e., 7.644 – 3.902) and 1.521
  • 22. EMBARGOED UNTIL 12:01 AM ON JUNE 4, 2018 22 (i.e., 9.412- 7.891), respectively, whereas math scores decrease slightly, by approximately one- half of one point (i.e., 6.487-6.012). Thus, we conclude that students in our sample who are still participating in the OS program after two years perform nine points higher on the language assessment than comparable students who remain in public schools. This is equivalent to .52 SD. A central issue in the evaluation of voucher programs is the assessment used to compare private and public school students. If private schools are required to administer the state assessment to voucher recipients, they may find themselves at a disadvantage if their curriculum is not aligned with the test in the same way as the public school curriculum is aligned. Although we do not rely on the criterion-referenced North Carolina state test for this evaluation, which would potentially advantage the public school students, a similar issue could be at play here if some of the private schools have aligned their curriculum to the assessment we use. While it is important to note that none of the schools in our sample actually use the assessment administered for this evaluation—the short battery (Form E) of the ITBS—some of the private schools in our sample do administer the complete battery of the ITBS to students in 3rd , 6th , and 12th grade for internal assessment purposes. While they may not explicitly focus their instruction to ensure their students perform well on the ITBS, they may have selected the ITBS because the scope and sequence of tested content most closely aligns to their curriculum. Thus, our positive results could be explained, in part, by an alignment with the assessment used to measure student achievement. One way to test this theory is to repeat our analysis of new OS recipients and split the treatment group into two, depending on whether or not the private school attended by a student administers the ITBS. The bottom panel of Table 7 shows the results of these analyses. The large positive effects from our previous analyses largely disappear when analyzing students from
  • 23. EMBARGOED UNTIL 12:01 AM ON JUNE 4, 2018 23 private schools that do not use ITBS, implying that OS students attending these schools perform about the same as their public school counterparts on this assessment. The treatment variable is no longer statistically significant, and the effect sizes range from .04 to .10. The results for the ITBS sample, meanwhile, remain statistically significant, with implausibly large effect sizes that range from .39 to .86. These large, positive effect sizes may, in part, reflect curricular alignment with the ITBS, but we also cannot rule out other explanations. For instance, it could be the case that use of the ITBS is correlated with other influential school characteristics, such as school age, school size, teacher quality, school leader quality, peer group quality, etc. It could also be driven by student selection into certain types of schools. It is also worth noting that all of the Catholic schools in our sample use the ITBS, such that half of the students in the ITBS-only private school group attend Catholic schools, versus none in the non-ITBS sample, making it challenging to tease apart the impact of attending a Catholic school from the impact of attending an ITBS-using school. In conclusion, we cannot rule out the possibility that the large effect sizes for this analysis may reflect factors other than curricular alignment with the assessment. Discussion The results presented here reveal large positive impacts associated with voucher usage in North Carolina. Our preferred specification utilizes observations from 245 students, controlling for a host of covariates, revealing first year impact estimates of .36 SD in math and .44 SD in language. Two-year impact estimates suggest that student achievement in language improved by .52 SD. These findings are surprising in that they run contrary to recent evidence from Louisiana (Abdulkadiroglu, Pathak, & Walters, 2018; Mills & Wolf, 2017), Ohio (Figlio & Karbownik, 2016), and Indiana (Waddington & Berends, 2017), but the positive impacts observed here are in
  • 24. EMBARGOED UNTIL 12:01 AM ON JUNE 4, 2018 24 line with the bulk of the literature on voucher usage in the United States since the 1990s (Table 2). It may be the case that the North Carolina Opportunity Scholarship Program truly has a positive impact on student achievement, perhaps because it reaches highly economically- disadvantaged students (Egalite, Stallings, & Porter, 2017) who have few school choice options in the absence of the program and perhaps the highest potential for academic growth, as a result. Two other potential explanations also merit consideration. The first alternative explanation for the positive impacts reported here relates to the research design. As with any quasi-experimental design, it is possible that unobserved characteristics of students not captured in the statistical model explain the variation in test scores that is currently attributed to the voucher indicator. For instance, even though all students in the analysis sample are low-income by sample construction criteria, voucher students may still be relatively advantaged compared to their public school matched peers and these unobserved characteristics may lead to higher test scores after the student switches into private school. OS parents have to provide school transportation and pay for breakfast and lunches now that the child is in a private school (Egalite, Gray, and Stallings, 2017), which suggests they might have more disposable income to draw upon but a descriptive analysis of household income suggests that voucher-receiving families are actually among the poorest households in the state (Egalite, Stallings, & Porter, 2017). It may still be the case that parents of voucher-receiving students are more motivated, but this would have to be a dynamic characteristic or it would already be accounted for by the variables documenting students’ prior test scores and disciplinary records. Second, it is possible that the choice of test unfairly advantaged the private school students. This would be a serious concern if the test chosen for this analysis was a criterion- referenced test, aligned to a specific set of standards and content sequence, such as the North
  • 25. EMBARGOED UNTIL 12:01 AM ON JUNE 4, 2018 25 Carolina End-of-Grade tests, but the Iowa Test of Basic Skills is a norm-referenced test that is not aligned with any one curriculum. A related concern is if the private schools in our sample use the Iowa Test of Basic Skills for their annual assessment and students in the study sample were seeing the same set of questions for the second time. We tried to avoid this scenario in two ways—by testing early enough in the spring so that the students took the test for our study before taking the test for their own school’s accountability protocol. A complementary benefit of this timing decision was that we avoided unfair test fatigue among public and private school students, because neither side had started their own spring testing yet. We also avoided this potential pitfall by selecting a short battery test that had not previously been reported to the SEAA as being used among private schools for accountability purposes (recall, Table 2). Although not a threat to internal validity, it is also important to consider sample construction when interpreting these results. Because our sample is not comprehensive and students were not randomly selected to be in the study, our sample is not representative of all voucher users in 2016-17. On both the public and private school sides, we were forced to rely on volunteer samples, which may have resulted in unusually high performers in our sample. Recruitment efforts were supported by public and private school partners including individual school leaders, school district central office staff, and a school choice interest group. Thus, the results reported here are not reflective of the average test score impact on a typical voucher student attending a North Carolina private school by way of the Opportunity Scholarship program. The sample construction protocol also raises interesting questions about how we should conceptualize the “treatment.” Students in the comparison group attend large, high-poverty public schools, whereas students in the treatment group attend smaller, less racially diverse private schools (Table 4). As with any private school voucher study, the treatment impact may
  • 26. EMBARGOED UNTIL 12:01 AM ON JUNE 4, 2018 26 reflect differences in peer effects, school size, and resources as much as it reflects a simple switch from the public to private sector. Limitations. There are three important limitations to this analysis that merit further discussion. The first limitation relates to our research design. Propensity score matching allows us to mitigate potential selection bias by accounting for observable differences between students in the treatment and comparison groups. This is greatly strengthened by our inclusion of pretreatment measures of students’ academic performance (Bifulco, 2012). Nonetheless, it is possible that the matched students are not perfectly aligned along unobservable dimensions, which could introduce potential selection bias. This is always a possibility in research designs that cannot leverage a lottery for causal inference. Second, the outcome examined, student performance on a nationally-normed standardized test, captures just one dimension of student learning. Many in the private school community would likely wish to see more diverse outcomes examined, such as less tangible but equally important character skills, such as perseverance, grit, and persistence in the face of failure. Nonetheless, there is a strong argument to be made for a close examination of student test scores as they are strongly related to high school completion and college attendance (Rivkin, 1995), college quality (Behrman, Kletzer, McPherson, & Schapiro, 1998), college completion (Hanushek & Pace, 1995), and individual incomes (Neal & Johnson, 1996). The third limitation is one of external validity. The students in this sample were not randomly selected among all Opportunity Scholarship users in the state so they may not be representative of the average Scholarship user. Furthermore, the private schools that participated in our data collection efforts were also not randomly selected among all participating private schools so they too may not be representative of the average private school attended by a student
  • 27. EMBARGOED UNTIL 12:01 AM ON JUNE 4, 2018 27 utilizing an Opportunity Scholarship. We are not concerned that either of these limitations introduces bias by compromising internal validity; they just limit the generalizability of the results. Conclusion We use inverse propensity weights in a regression model to estimate the impact of North Carolina’s Opportunity Scholarship Program on student performance in mathematics, reading, and language. The effect sizes observed are positive, large, and statistically significant, ranging from .25 to .49 SD. As a robustness check, we also run models that account for pre-existing trends in student achievement by controlling for both 2015 and 2016 test scores. Impacts remain positive and statistically significant, but shrink slightly to .21 to .39 SD. Although not a comprehensive analysis of all 5,624 voucher recipients in the 2016-17 school year, this analysis presents the first estimate of the achievement impacts associated with the use of a means-tested voucher in the Tar Heel state.
  • 28. EMBARGOED UNTIL 12:01 AM ON JUNE 4, 2018 28 References Abdulkadiroglu, A., Pathak, P. A., & Walters, C. R. (2018). Free to choose: Can school choice reduce student achievement? American Economic Journal: Applied Economics, 10(1), 175–206. Abdulkadiroglu, A., Angrist, J. D., Cohodes, S., Dynarski, S. M., Fullerton, J., Kane, T. J., & Pathak, P. A. (2009). Informing the debate: comparing Boston’s charter, pilot and traditional schools. Boston, MA: Boston Foundation Report. Ackerman, M., & Egalite, A. J. (2017). A critical look at methodologies used to evaluate charter school effectiveness. Educational Assessment, Evaluation and Accountability, 29(4), 363–396. Angrist, J. D., Cohodes, S. R., Dynarski, S. M., Fullerton, J. B., Kane, T. J., Pathak, P. A., & Walters, C. R. (2011). Student achievement in Massachusetts’ charter schools. Cambridge, MA: Center for Education Policy Research, Harvard University. Barnard J., Frangakis C. E., Hill J. L., Rubin D. B. (2003). Principal stratification approach to broken randomized experiments: A case study of School Choice vouchers in New York City. Journal of the American Statistical Association, 98, 288–311. Behrman, J.R., Kletzer, L.G., McPherson, & M.S., Schapiro, M.O. (1998). The microeconomics of college choice, careers, and wages: Measuring the impact of higher education. Annals of the American Academy of Political and Social Science, 559: 12–23. Bettinger, E. & Slonim, R. (2006). The effect of educational vouchers on academic and non- academic outcomes: Using experimental economic methods to study a randomized natural experiment. Journal of Public Economics, 90: 1625-48.
  • 29. EMBARGOED UNTIL 12:01 AM ON JUNE 4, 2018 29 Bifulco, R. (2012). Can nonexperimental estimates replicate estimates based on random assignment in evaluations of school choice? A within-study comparison. Journal of Policy Analysis and Management, 31(3), 729–751. Cole, S.R. & Hernan, M.A. (2008). Constructing inverse probability weights for marginal structural models. American Journal of Epidemiology, 168(6), 656-664. Cowen, J., M. (2008). School Choice as a Latent Variable: Estimating the “Complier Average Causal Effect” of Vouchers in Charlotte. Policy Studies Journal, 36(2), 301–315 Dobbie, W.S. & Fryer, R.G. (2017). Charter schools and labor market outcomes. NBER Working Paper no. 22502. Retrieved from http://www.nber.org/papers/w22502. Egalite, A.J., Gray, A.M., & Stallings, D.T. (2017). Parent perspectives: Applicants to North Carolina’s Opportunity Scholarship Program share their experiences. OS Evaluation Report #2. Raleigh, N.C.: North Carolina State University. Retrieved from https://ced.ncsu.edu/elphd/wp-content/uploads/sites/2/2017/07/Parent-Perspectives.pdf. Egalite, A.J., Porter, S. R., & Stallings, T. (2017). A profile of applicants to North Carolina’s Opportunity Scholarship Program: Descriptive data on 2016-17 applicants. OS Evaluation Report #3, Raleigh, N.C.: North Carolina State University. Retrieved from https://ced.ncsu.edu/elphd/research/the-impact-of-the-north-carolina-opportunity- scholarship-program/ Figlio, D. N., & Karbownik, K. (2016). Evaluation of Ohio’s EdChoice Scholarship Program: Selection, Competition, and Performance Effects. Washington, D.C.: Thomas B. Fordham Institute. Retrieved from https://edex.s3-us-west- 2.amazonaws.com/publication/pdfs/FORDHAM%20Ed%20Choice%20Evaluation%20R eport_online%20edition.pdf.
  • 30. EMBARGOED UNTIL 12:01 AM ON JUNE 4, 2018 30 Fortson, K., Verbitsky-Savitz, N., Kopa, E., & Gleason, P. (2012). Using an experimental evaluation of charter schools to test whether nonexperimental comparison group methods can replicate experimental impact estimates. NCEE Technical Methods Report No. 2012–4019. Washington, D.C.: National Center for Education Evaluation and Regional Assistance, Institute of Education Sciences, U.S. Department of Education. Hanushek, E.A., & Pace, R.R. (1995). Who chooses to teach (and why)? Economics of Education Review, 14 (2): 101–117. Howell, W., Wolf, P., J., Campbell, D., & Peterson, P. E. (2002). School vouchers and academic performance: Results from three randomized field trials. Journal of Policy Analysis and Management, 21(2), 191–217. Jin, H., Barnard, J., & Rubin, D., B. (2010). A Modified General Location Model for Noncompliance With Missing Data: Revisiting the New York City School Choice Scholarship Program Using Principal Stratification. Journal of Educational and Behavioral Statistics, 35(2), 154–173. Krueger, A., & Zhu, P. (2004). Another look at the New York City voucher experiment. American Behavioral Scientist, 47(5), 658–698. Lee, B.K., Lessler, J. & Stuart, E.A. (2011). Weight trimming and propensity score weighting. PLoS ONE, 6(3), 1-6. Mills, J. N., & Wolf, P. J. (2017). Vouchers in the Bayou: The effects of the Louisiana Scholarship Program on student achievement after two years. Forthcoming in Educational Evaluation and Policy Analysis. Neal, D.A., & Johnson, W.R. (1996). The role of pre-market factors in black–white differences. Journal of Political Economy, 104 (5): 869–895.
  • 31. EMBARGOED UNTIL 12:01 AM ON JUNE 4, 2018 31 Rivkin, S.G. (1995). Black/white differences in schooling and employment. Journal of Human Resources, 30 (4): 826–852. Rosenbaum, P. R., & Rubin, D. B. (1983b). The central role of the propensity score in observational studies for causal effects. Biometrika, 70(1), 41–55. Waddington, R. J., & Berends, M. (2017). Early Impacts of Indiana Choice Scholarship Program: Achievement Effects for Students in Upper Elementary and Middle School. Paper presented at the annual meeting of the Society for Research on Educational Effectiveness, Washington, DC. Wettach, J.R. (2017). School vouchers in North Carolina: The first three years. Durham, NC: The Children’s Law Clinic at Duke Law School. Retrieved from https://law.duke.edu/childedlaw/docs/School_Vouchers_NC.pdf. White, J. (2016). Give vouchers time: Low-income families need as many quality school options as possible. Washington D.C.: Brookings Institution. Retrieved from https://www.brookings.edu/research/give-vouchers-time-low-income-families-need-as- many-quality-school-options-as-possible/. Weinschrott, D.J., & Kilgore, S. B. (1998). Evidence from the Indianapolis Voucher Program. In P. E. Peterson & B. C. Hassel (Eds.), Learning from school choice (pp. 307-333). Washington D.C.: Brookings Institution. Witte, J., Carlson, D., Cowen, J.M., Fleming, D.J., & Wolf, P.J. (2012). MPCP longitudinal educational growth study: Fifth year report. SCDP Milwaukee Evaluation Report #29. Fayetteville, AR: The School Choice. Demonstration Project. Retrieved from http://www.uaedreform.org/category/department-of-education-reform/scdp/milwaukee- evaluation/mpcp-final-reports/.
  • 32. EMBARGOED UNTIL 12:01 AM ON JUNE 4, 2018 32 Wolf, P. J., Kisida, B., Gutmann, B., Puma, M., Eissa, N., & Rizzo, L. (2013). School vouchers and student outcomes: Experimental evidence from Washington, DC. Journal of Policy Analysis and Management, 32(2), 246–270.
  • 33. EMBARGOED UNTIL 12:01 AM ON JUNE 4, 2018 33 Figure 1. Distribution of Student Propensity Scores by 2017 School Type 01234 0 .2 .4 .6 .8 1 Predicted probability of treatment Public Private New OS recipients 0123 0 .2 .4 .6 .8 1 Predicted probability of treatment Public Private Change in EOG 0123 0 .2 .4 .6 .8 Predicted probability of treatment Public Private Renewal OS Recipients01234 0 .2 .4 .6 .8 Predicted probability of treatment Public Private Privates: No ITBS 02468 0 .2 .4 .6 .8 Predicted probability of treatment Public Private Privates: ITBS only
  • 34. EMBARGOED UNTIL 12:01 AM ON JUNE 4, 2018 34 Table 1. North Carolina’s Opportunity Scholarship Program, Compared to Selected Programs in Other States State North Carolina Florida Indiana Louisiana Program Name NC Opportunity Scholarship Program FL Tax Credit Scholarship Program IN Choice Scholarship Program LA Scholarship Program Program Type Voucher Tax Credit Voucher Voucher Year Enacted 2013 2001 2011 2008 Eligibility Pathways a. Household income doesn’t exceed 133% of the federal free/ reduced- price lunch program limit, and b. Student either has prior public school attendance, is entering K or G1, parent/guardian is active- duty military, or child is in foster care/ recently adopted Either the student is in foster care or meets the household income requirement (260% of federal poverty line). Note: prior year enrollment in a public school no longer required Eight potential pathways, none of which allow household income to exceed 200% of federal free/ reduced price lunch program limit: Continuing Choice Scholarship Student, Previous Choice Scholarship Student, Previous Scholarship Granting Organization (SGO) Award, Special Education, "F" Public School, Two Semesters in a Public School, Sibling, and Pre- K. Student must be a Louisiana resident; Household income does not exceed 250% of the federal poverty guidelines; Either entering kindergarten or enrolled in a public school with a C, D, F, or T grade; OR a continuing Scholarship student Max Value of Voucher Award $4,200 $5,886 The lesser of private school tuition and fees OR the 50% or 90% award amounts based on the funding formula for the student’s public school corporation of residence The lesser of private school tuition and fees OR the maximum state allocation per student Parental Co-Pay? Yes Yes Yes No Private School Admissions Screening Permitted? Yes Yes Yes No Accountability Tests Any nationally-normed test Any nationally- normed test State Test State Test
  • 35. EMBARGOED UNTIL 12:01 AM ON JUNE 4, 2018 35 Participants (2016-17) 5,624 98,936 34,299 6,995 Sources: Florida program info: http://www.fldoe.org/schools/school-choice/k-12-scholarship-programs/ftc/ftc-faqs.stml; Indiana program info: https://www.doe.in.gov/sites/default/files/choice/1-choice-parent-faq-february-2018.pdf ; Louisiana program Info: https://www.louisianabelieves.com/schools/louisiana-scholarship-program. North Carolina program info: Statute 115C-562. Number of participating students across all four programs comes from www.edchoice.org. Note: Parental co-pay is when parents are responsible for the cost of tuition and fees that exceed the maximum voucher value. This is sometimes referred to as tuition “top-up.” All programs generally specify that students must be of school-going age (i.e., high school graduates would be ineligible) and residents of the state in which the program is administered.
  • 36. EMBARGOED UNTIL 12:01 AM ON JUNE 4, 2018 36 Table 2. Standardized Assessments Taken by Opportunity Scholarship Students, 2014-15 Test Name Publisher Number of Students Basic Achievement Skills Inventory (BASI) Brewer Testing Services 3 BJU Press Assessments BJU Press 2 California Achievement Test (CAT) Seton Testing Services 33 Comprehensive Testing Program (CTP) Educational Records Bureau 19 Iowa Assessments Houghton Mifflin Harcourt 204 Otis-Lennon School Ability Test (OLSAT) Pearson 3 Stanford Achievement Test Pearson 272 TerraNova Data Recognition Corporation 303 Woodcock Johnson Houghton Mifflin Harcourt 9 TOTAL 848 Source: The North Carolina State Education Assistance Authority
  • 37. EMBARGOED UNTIL 12:01 AM ON JUNE 4, 2018 37 Table 3. Lottery-Based Studies of the Achievement Impacts of School Vouchers Citation Program Name Program Funding Program Scope Impact Cowen (2008) Charlotte Scholarship Fund Private Citywide Positive Overall Greene (2001) Charlotte Scholarship Fund Private Citywide Positive Overall Howell, Wolf, Campbell, & Peterson (2002) The D.C. Opportunity Scholarship Program. Public Citywide Positive Overall Wolf, Kisida, Gutmann, Puma, Eissa, & Rizzo (2013) The D.C. Opportunity Scholarship Program Public Citywide Null Dynarksi, Rui, Webber Gutmann & Bachman (2017) The D.C. Opportunity Scholarship Program Public Citywide Negative Overall Howell, Wolf, Campbell, & Peterson (2002) The Dayton, Ohio Parents Advancing Choice in Education Program Private Citywide Positive for Subgroups Bettinger & Slonim (2006) The Children’s Scholarship Fund of Toledo, Ohio Private Citywide Null Howell, Wolf, Campbell, & Peterson (2002) New York City School Choice Scholarships Foundation Program Private Citywide Positive for Subgroups Barnard, Frangakis, Jin, & Rubin (2003) New York City School Choice Scholarships Foundation Program Private Citywide Positive for Subgroups Krueger & Zhu (2004) New York City School Choice Scholarships Foundation Program Private Citywide Null Jin, Barnard, & Rubin (2010) New York City School Choice Scholarships Foundation Program Private Citywide Positive for Subgroups Bitler, Domina, Penner, & Hoynes (2014) New York City School Choice Scholarships Foundation Program Private Citywide Null Rouse (1998) Milwaukee Parental Choice Program Public Citywide Positive Overall Greene, Peterson, & Du (1999) Milwaukee Parental Choice Program Public Citywide Positive Overall Mills & Wolf (2017) Louisiana Scholarship Program Public Statewide Negative Overall and for Subgroups Abdulkadiroglu, Pathak, & Walters (2018) Louisiana Scholarship Program Public Statewide Negative Overall and for Subgroups Note: The designations “Positive Overall” and “Negative Overall” indicate that a statistically significant positive or negative
  • 38. EMBARGOED UNTIL 12:01 AM ON JUNE 4, 2018 38 achievement impact were observed for the overall sample in at least one subject
  • 39. EMBARGOED UNTIL 12:01 AM ON JUNE 4, 2018 39 Table 4. Description of Public and Private Schools in Sample Private Public Tested Students Per School Median 7 23 Mean 12 35 Min 1 4 Max 43 166 School Has a Library or Media Center 0.95 n/a Religious Affiliation Catholic 0.53 n/a Baptist 0.16 n/a Christian (no specific denomination) 0.26 n/a Other Religion (e.g., Methodist, Episcopal) 0.05 n/a School Type Private 1.00 0.00 Traditional Public School 0.00 0.93 Charter 0.00 0.00 Magnet 0.00 0.07 School Wide Title 1 n/a 1.00 Enrollment Median 225 649 Mean 399 640 Min 107 342 Max 1402 933 School Community Type City 0.74 0.36 Suburb or Town 0.16 0.14 Rural 0.11 0.50 Racial Composition Average of School Percent White 0.64 0.14 Average of School Percent Black 0.15 0.49 Average of School Percent Hispanic 0.13 0.31 Pupil Teacher Ratio Median 12 14 Mean 12 14 Min 8 12 Max 19 17 Full Time Equivalent Teachers Median 28 45
  • 40. EMBARGOED UNTIL 12:01 AM ON JUNE 4, 2018 40 Mean 35 45 Min 11 26 Max 94 73 Standardized Tests Used Iowa Test of Basic Skills 0.44 n/a Terra Nova 0.31 n/a Stanford Achievement Test 0.25 n/a California Achievement Test 0.06 n/a Preliminary Scholastic Assessment Test (PSAT) 0.06 n/a North Carolina End of Grade Tests n/a 1.00 Notes: n/a implies this data point was not available for schools in this sector; n = 14 public schools and 24 private schools in the testing sample. All testing was conducted in spring 2017. Tested students per school refers to the number of students tested by the NC State research team for this project. An elementary school configuration is defined as a school that has one or more of grades K-6 and does not have any grade higher than the 8th grade. A secondary school configuration is defined as a school that has one or more of grades 7-12 and does not have any grade lower than 7th grade. A combined school configuration is defined as a school that has one or more of grades K-6 and one or more of grades 9-12. Some schools use more than one standardized test so these individual percentages are not expected to sum to 100 percent. "Standardized Tests Used" refers to the accountability tests used to assess all students in a school, not just Opportunity Scholarship students. Sources: Private school data are from the 2015-16 Private School Universe Survey and the North Carolina Division of Non Public Education records. Public school data are from the 2015-16 U.S. Department of Education Public Elementary/Secondary School Universe Survey.
  • 41. EMBARGOED UNTIL 12:01 AM ON JUNE 4, 2018 41 Table 5. Constructing the Analysis Sample Private Public Total Took ITBS in 2017 297 401 698 Not included in analysis because: No unique match with DPI data 48 76 124 Took wrong version of ITBS in 2017 0 8 8 Did not take/finish ITBS in 2017 0 7 7 Missing 2016 EOG 1 0 1 Not free/reduced lunch in 2016 - 58 58 Could not verify OS receipt 3 - 3 Final student count 245 252 497 Status of OS recipients New 90 - - Renewal 155 - - Analytic dataset n 245 252 497 Note: ITBS stands for Iowa Test of Basic Skills; DPI stands for Department of Public Instruction; EOG stands for the North Carolina End of Grade assessments, our measure of baseline achievement.
  • 42. EMBARGOED UNTIL 12:01 AM ON JUNE 4, 2018 42 Table 6. Covariate Means Before and After Inverse Propensity Weighting Analyis /covariates Private Public Raw Std. Private Public Raw Std. New OS recipients Female 0.56 0.64 -0.08 -0.16 0.56 0.58 -0.02 -0.03 Black 0.48 0.51 -0.03 -0.06 0.48 0.52 -0.03 -0.07 Latino 0.06 0.15 -0.09 -0.30 0.06 0.04 0.02 0.05 Other race/ethnicity 0.24 0.19 0.04 0.11 0.24 0.21 0.03 0.06 Grade 5 0.25 0.20 0.05 0.12 0.25 0.27 -0.02 -0.05 Grade 6 0.30 0.11 0.19 0.49 0.30 0.29 0.01 0.03 Grade 7 0.15 0.15 0.00 0.00 0.15 0.14 0.00 0.01 Grade 8 0.15 0.27 -0.12 -0.31 0.15 0.16 -0.01 -0.03 Disciplinary incident 0.12 0.16 -0.04 -0.10 0.12 0.13 -0.01 -0.02 Math state EOG score 449.47 449.54 -0.07 -0.01 449.47 449.64 -0.17 -0.02 Reading state EOG score 449.75 448.15 1.60 0.16 449.75 450.14 -0.38 -0.04 Mean |difference| 0.17 0.04 Change in EOG Female 0.56 0.63 -0.08 -0.16 0.56 0.55 0.01 0.01 Black 0.49 0.54 -0.05 -0.11 0.49 0.54 -0.05 -0.10 Latino 0.07 0.12 -0.05 -0.18 0.07 0.04 0.03 0.11 Other race/ethnicity 0.26 0.19 0.07 0.17 0.26 0.25 0.01 0.03 Grade 5 0.31 0.23 0.07 0.16 0.31 0.31 -0.01 -0.01 Grade 6 0.36 0.18 0.18 0.40 0.36 0.38 -0.01 -0.03 Grade 7 0.15 0.19 -0.04 -0.11 0.15 0.15 0.00 0.00 Grade 8 0.18 0.39 -0.21 -0.47 0.18 0.16 0.02 0.04 Disciplinary incident 0.14 0.19 -0.05 -0.15 0.14 0.13 0.01 0.03 Math state EOG score 448.75 448.67 0.08 0.01 448.75 448.95 -0.20 -0.02 Reading state EOG score 450.85 450.59 0.26 0.03 450.85 451.05 -0.21 -0.02 Math EOG change 0.15 0.22 -0.07 -0.01 0.15 0.50 -0.35 -0.06 Reading EOG change 5.82 4.46 1.36 0.22 5.82 6.03 -0.21 -0.03 Mean |difference| 0.17 0.04 Renewal OS recipients Female 0.43 0.62 -0.19 -0.40 0.43 0.38 0.05 0.10 Black 0.43 0.36 0.06 0.13 0.43 0.38 0.04 0.09 Latino 0.18 0.36 -0.19 -0.43 0.18 0.16 0.02 0.05 Other race/ethnicity 0.16 0.14 0.02 0.05 0.16 0.23 -0.07 -0.20 Grade 5 0.03 0.11 -0.08 -0.33 0.03 0.04 -0.01 -0.03 Grade 6 0.29 0.33 -0.03 -0.07 0.29 0.26 0.04 0.08 Grade 7 0.24 0.13 0.11 0.28 0.24 0.29 -0.06 -0.15 Grade 8 0.29 0.21 0.08 0.18 0.29 0.25 0.04 0.09 Disciplinary incident 0.18 0.31 -0.13 -0.31 0.18 0.18 -0.01 -0.02 Math state EOG score 450.03 448.79 1.24 0.15 450.03 450.18 -0.16 -0.02 Reading state EOG score 445.57 444.80 0.77 0.07 445.57 445.88 -0.31 -0.03 Mean |difference| 0.22 0.08 Unweighted Weighted Difference Difference
  • 43. EMBARGOED UNTIL 12:01 AM ON JUNE 4, 2018 43 Table 6 continued Analyis /covariates Private Public Raw Std. Private Public Raw Std. No privates using ITBS Female 0.59 0.64 -0.05 -0.10 0.59 0.58 0.01 0.03 Black 0.47 0.58 -0.11 -0.21 0.47 0.55 -0.07 -0.15 Latino 0.05 0.08 -0.03 -0.13 0.05 0.03 0.02 0.09 Other race/ethnicity 0.24 0.20 0.03 0.08 0.24 0.25 -0.01 -0.04 Grade 5 0.22 0.17 0.05 0.14 0.22 0.23 -0.01 -0.01 Grade 6 0.34 0.10 0.24 0.59 0.34 0.33 0.01 0.02 Grade 7 0.14 0.12 0.01 0.04 0.14 0.15 -0.02 -0.05 Grade 8 0.12 0.26 -0.14 -0.37 0.12 0.12 0.00 -0.01 Disciplinary incident 0.08 0.15 -0.07 -0.21 0.08 0.09 0.00 -0.01 Math state EOG score 450.76 449.17 1.59 0.18 450.76 451.04 -0.28 -0.03 Reading state EOG score 450.08 446.77 3.31 0.33 450.08 450.49 -0.40 -0.04 Mean |difference| 0.22 0.04 Only privates using ITBS Female 0.55 0.65 -0.10 -0.21 0.55 0.56 -0.01 -0.02 Black 0.48 0.46 0.02 0.04 0.48 0.50 -0.02 -0.04 Latino 0.10 0.26 -0.15 -0.40 0.10 0.08 0.02 0.05 Other race/ethnicity 0.24 0.16 0.08 0.20 0.24 0.22 0.02 0.04 Grade 5 0.34 0.24 0.11 0.24 0.34 0.33 0.01 0.02 Grade 6 0.17 0.09 0.08 0.23 0.17 0.23 -0.06 -0.16 Grade 7 0.17 0.16 0.01 0.03 0.17 0.15 0.02 0.05 Grade 8 0.21 0.25 -0.04 -0.10 0.21 0.20 0.00 0.01 Disciplinary incident 0.21 0.15 0.06 0.16 0.21 0.21 -0.01 -0.02 Math state EOG score 447.34 448.87 -1.53 -0.16 447.34 445.96 1.38 0.15 Reading state EOG score 448.69 446.97 1.72 0.16 448.69 448.22 0.47 0.05 Mean |difference| 0.18 0.06 Difference Difference Unweighted Weighted
  • 44. EMBARGOED UNTIL 12:01 AM ON JUNE 4, 2018 44 Table 7. Achievement Impact Associated with Participation in the North Carolina Opportunity Scholarship Program Notes: Coefficients are for private school status from regressions with ITBS composite scores in math, reading, and language as the dependent variable, using inverse propensity weighting. Standard errors in parentheses; clustered at the 2017 school level. + p<.10, * p<.05, ** p<.01. Treatment group Covariates Math Reading Language Math Reading Language T C Total New OS recipients No 6.890* 3.863 7.852* 0.38 0.21 0.44 89 156 245 (2.789) (3.041) (2.914) Yes 6.487** 3.902+ 7.891** 0.36 0.22 0.44 89 156 245 (2.221) (2.136) (2.483) Yes & change in EOG 6.709* 4.482 8.807 0.37 0.25 0.49 72 98 170 (2.553) (2.403) (2.498) Renewal OS recipients No 5.987 7.497* 9.733* 0.33 0.42 0.54 68 140 208 (4.012) (3.560) (4.050) Yes 6.012+ 7.644+ 9.412** 0.33 0.42 0.52 68 140 208 (3.235) (3.848) (3.347) New OS recipients; No 0.114 1.690 0.842 0.01 0.09 0.05 59 157 216 school does not use ITBS (2.812) (3.263) (3.020) Yes 0.744 1.835 1.347 0.04 0.10 0.07 59 157 216 (1.983) (2.151) (1.874) New OS recipients; No 13.122** 8.586 17.144** 0.73 0.48 0.95 29 191 220 school uses ITBS (2.944) (5.441) (3.452) Yes 11.291** 7.105* 15.495** 0.63 0.39 0.86 29 191 220 (2.875) (2.982) (3.204) Effect sizesOLS results n