VIP Call Girl in Thane 💧 9920725232 ( Call Me ) Get A New Crush Everyday With...
ASG Sector Snapshots
1. 1
May 23, 2016
WFII
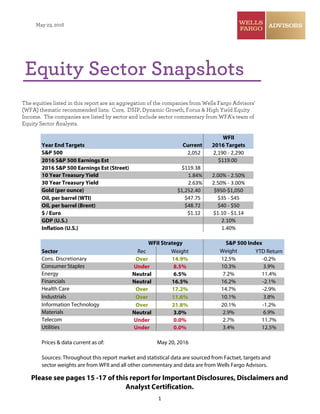
Year End Targets Current 2016 Targets
2,052 2,190 - 2,290
2016 S&P 500 Earnings Est $119.00
2016 S&P 500 Earnings Est (Street) $119.38
1.84% 2.00% - 2.50%
2.63% 2.50% - 3.00%
$1,252.40 $950-$1,050
Oil, per barrel (WTI) $47.75 $35 - $45
Oil, per barrel (Brent) $48.72 $40 - $50
$ / Euro $1.12 $1.10 - $1.14
GDP (U.S.) 2.10%
Inflation (U.S.) 1.40%
Sector Rec Weight Weight YTD Return
Over 14.9% 12.5% -0.2%
Under 8.5% 10.3% 3.9%
Neutral 6.5% 7.2% 11.4%
Neutral 16.5% 16.2% -2.1%
Over 17.2% 14.7% -2.9%
Over 11.6% 10.1% 3.8%
Over 21.8% 20.1% -1.2%
Neutral 3.0% 2.9% 6.9%
Under 0.0% 2.7% 11.7%
Under 0.0% 3.4% 12.5%
Prices & data current as of:
S&P 500
10 Year Treasury Yield
Gold (per ounce)
Financials
30 Year Treasury Yield
Sources: Throughout this report market and statistical data are sourced from Factset, targets and
sector weights are from WFII and all other commentary and data are from Wells Fargo Advisors.
WFII Strategy S&P 500 Index
Cons. Discretionary
Consumer Staples
Energy
Health Care
Telecom
Utilities
May 20, 2016
Industrials
Information Technology
Materials
The equities listed in this report are an aggregation of the companies from Wells Fargo Advisors'
(WFA) thematic recommended lists: Core, DSIP, Dynamic Growth, Focus & High Yield Equity
Income. The companies are listed by sector and include sector commentary from WFA's team of
Equity Sector Analysts.
Please see pages 15 -17 of this report for Important Disclosures, Disclaimers and
Analyst Certification.
Equity Sector Snapshots
2. 2
S&P 500 Quarterly Sector Performance*
2Q-2012 3Q-2012 4Q-2012 1Q-2013 2Q-2013 3Q-2013 4Q-2013 1Q-2014 2Q-2014 3Q-2014 4Q-2014 1Q-2015 2Q-2015 3Q-2015 4Q-2015 1Q-2016 YTD-2016
Telecom Energy Financials Health Care Financials Materials Industrials Utilities Energy Health Care Utilities Health Care Health Care Utilities Materials Telecom Utilities
14.1% 10.1% 5.9% 15.8% 7.3% 10.3% 13.5% 10.1% 12.1% 5.5% 13.2% 6.5% 2.8% 5.4% 9.7% 16.6% 12.5%
Utilities Telecom Industrials C. Staples Cons. Disc. Industrials Info Tech Health Care Utilities Info Tech Cons. Disc. Cons. Disc. Cons. Disc. C. Staples Health Care Utilities Telecom
6.5% 8.1% 3.70% 14.6% 6.8% 8.9% 13.3% 5.8% 7.8% 4.8% 8.7% 4.8% 1.9% -0.2% 9.2% 15.6% 11.7%
C. Staples Cons. Disc. Materials Utilities Health Care Cons. Disc. Cons. Disc. Materials Info Tech Telecom C. Staples Telecom Financials Cons. Disc. Info Tech C. Staples Energy
2.9% 7.5% 2.7% 13.0% 3.8% 7.8% 10.8% 2.9% 6.5% 3.1% 8.2% 1.5% 1.7% -2.6% 9.2% 5.6% 11.4%
Health Care Info Tech Cons. Disc. Cons. Disc. S&P 500 Health Care Materials Financials Materials Financials Health Care Materials Telecom Info Tech Industrials Industrials Materials
1.7% 7.4% 2.1% 12.2% 2.9% 6.8% 10.7% 2.6% 5.6% 2.3% 7.5% 1.0% 1.6% -3.7% 8.0% 5.0% 6.9%
Cons. Disc. Financials Health Care Financials Industrials Info Tech S&P 500 Info Tech S&P 500 C. Staples Financials C. Staples S&P 500 S&P 500 Telecom Energy C. Staples
-2.6% 6.9% 0.1% 11.4% 2.8% 6.6% 10.5% 2.3% 5.2% 2.0% 7.2% 1.0% 0.3% -6.4% 7.6% 4.0% 3.9%
S&P 500 S&P 500 S&P 500 Industrials Info Tech S&P 500 Financials S&P 500 C. Staples S&P 500 Industrials S&P 500 Info Tech Financials C. Staples Materials Industrials
-2.8% 6.4% -0.4% 10.7% 1.7% 5.2% 10.5% 1.8% 4.7% 1.1% 6.8% 1.0% 0.2% -6.7% 7.6% 3.6% 3.8%
Industrials Health Care C. Staples S&P 500 Telecom Energy Health Care Energy Health Care Cons. Disc. Info Tech Info Tech Materials Telecom S&P 500 Info Tech S&P 500
-3.6% 6.2% -1.8% 10.6% 1.0% 5.2% 10.1% 0.8% 4.5% 0.3% 5.2% 0.6% -0.5% -6.8% 7.0% 2.6% 1.3%
Materials Materials Energy Energy C. Staples Financials C. Staples C. Staples Industrials Materials S&P 500 Industrials C. Staples Industrials Financials Cons. Disc. Cons. Disc.
-4.2% 5.1% -2.7% 10.2% 0.5% 2.9% 8.7% 0.5% 3.9% 0.2% 4.9% -0.9% -1.7% -6.9% 6.0% 1.6% -0.2%
Energy C. Staples Utilities Telecom Energy C. Staples Energy Telecom Telecom Industrials Materials Financials Energy Health Care Cons. Disc. S&P 500 Info Tech
-6.0% 3.8% -2.90% 9.5% -0.4% 0.8% 8.4% 0.5% 3.8% -1.1% -1.8% -2.1% -1.9% -10.7% 5.8% 1.3% -1.2%
Info Tech Industrials Info Tech Materials Materials Utilities Telecom Industrials Cons. Disc. Utilities Telecom Energy Industrials Materials Utilities Financials Financials
-6.7% 3.6% -5.7% 4.8% -1.8% 0.2% 5.5% 0.1% 3.5% -4.0% -4.2% -2.9% -2.2% -16.9% 1.1% -5.1% -2.1%
Financials Utilities Telecom Info Tech Utilities Telecom Utilities Cons. Disc. Financials Energy Energy Utilities Utilities Energy Energy Health Care Health Care
-6.8% -0.5% -6.0% 4.6% -2.7% -4.4% 2.8% -2.8% 2.3% -8.6% -10.7% -5.2% -5.8% -17.4% 0.2% -5.5% -2.9%
*Total return includes cash dividends. Past performance is no guarantee offuture results. You can not invest directly in an indexorindustry.
Sectorperformance is based on the Global Industry Classification Standards (GICS)in which each company in the S&P500is assigned to one of10sectors according to
the definition ofits principal activity.
Source: FactSet, Wells Fargo Advisors.
3. S&P 500 Annual Sector Performance*
2006 2007 2008 2009 2010 2011 2012 2013 2014 2015 10Y: '06-'15
Telecom Energy C.Staples InfoTech Cons.Disc. Utilities Financials Cons.Disc. Utilities Cons.Disc. C.Staples
36.8% 34.4% -15.4% 61.7% 27.7% 20.0% 28.8% 43.1% 29.0% 10.1% 185.0%
Energy Materials Health Care Materials Industrials C.Staples Cons.Disc. Health Care Health Care Health Care Cons.Disc.
24.2% 22.5% -22.8% 48.6% 26.7% 14.0% 23.9% 41.5% 25.3% 6.9% 180.7%
Utilities Utilities Utilities Cons.Disc. Materials Health Care Telecom Industrials InfoTech C.Staples Health Care
21.0% 19.4% -29.00% 41.3% 22.2% 12.7% 18.3% 40.7% 20.1% 6.6% 175.9%
Financials InfoTech Telecom S&P 500 Energy Telecom Health Care Financials C.Staples InfoTech InfoTech
19.2% 16.3% -30.5% 26.5% 20.5% 6.3% 17.9% 35.6% 16.0% 5.9% 145.5%
Cons.Disc. C.Staples Cons.Disc. Industrials Telecom Cons.Disc. S&P 500 S&P 500 Financials Telecom Telecom
18.6% 14.2% -33.5% 20.9% 19.0% 6.1% 16.0% 32.4% 15.2% 3.4% 105.9%
Materials Industrials Energy Health Care S&P 500 Energy Industrials InfoTech S&P 500 S&P 500 Utilities
18.6% 12.0% -34.9% 19.7% 15.1% 4.7% 15.3% 28.4% 13.7% 1.4% 104.4%
S&P 500 Telecom S&P 500 Financials C.Staples InfoTech Materials C.Staples Industrials Financials S&P 500
15.8% 11.9% -37.0% 17.2% 14.1% 2.4% 15.0% 26.1% 9.8% -1.5% 102.4%
C.Staples Health Care Industrials C.Staples Financials S&P 500 InfoTech Materials Cons.Disc. Industrials Industrials
14.4% 7.1% -39.9% 14.9% 12.1% 2.1% 14.8% 25.6% 9.7% -2.5% 101.7%
Industrials S&P 500 InfoTech Energy InfoTech Industrials C.Staples Energy Materials Utilities Materials
13.3% 5.5% -43.1% 13.8% 10.2% -0.6% 10.8% 25.1% 6.9% -4.8% 83.1%
InfoTech Cons.Disc. Materials Utilities Utilities Materials Energy Utilities Telecom Materials Energy
8.4% -13.2% -45.7% 11.9% 5.5% -9.8% 4.6% 13.2% 3.0% -8.4% 48.6%
Health Care Financials Financials Telecom Health Care Financials Utilities Telecom Energy Energy Financials
7.5% -18.6% -55.3% 8.9% 2.9% -17.1% 1.3% 11.5% -7.8% -21.1% -6.4%
Sources: FactSet, Wells Fargo Advisors. *Total return includes dividends reinvested on ex-date. Past performance is not an indication of future results.
3
Sector performance is based on the Global Industry Classifications Standard (GICS) in which each company within the S&P 500 is assigned to one of 10
Sectors according to the definition of its principal activity.
4. 4
Consumer Discretionary
Ticker Company Name
Price
Dividend
DividendYield
Est.NTMmonthsEPS
/AFFO
NTMP/E
Core
DSIP
DynamicGrowth
Focus
HighYieldEquity
MarketCap(mil)
AMZN Amazon.com, Inc. 702.80$ -$ 0.0% 7.14$ 98.5 331,601$
KMX CarMax, Inc. 52.73$ -$ 0.0% 3.39$ 15.6 10,221$
CMCSA Comcast Corporation Class A 61.76$ 1.10$ 1.8% 3.69$ 16.7 149,904$
F Ford Motor Company 13.19$ 0.60$ 4.5% 2.12$ 6.2 52,402$
HOG Harley-Davidson, Inc. 43.91$ 1.40$ 3.2% 4.11$ 10.7 7,952$
HD Home Depot, Inc. 131.85$ 2.76$ 2.1% 6.55$ 20.1 165,009$
LAMR Lamar Advertising Company Class A 63.28$ 3.00$ 4.7% 3.16$ 20.0 6,141$
LVS Las Vegas Sands Corp. 44.99$ 2.88$ 6.4% 2.44$ 18.5 35,754$
LOW Lowe's Companies, Inc. 79.82$ 1.12$ 1.4% 4.22$ 18.9 71,634$
MAT Mattel, Inc. 30.55$ 1.52$ 5.0% 1.54$ 19.9 10,401$
MCD McDonald's Corporation 122.56$ 3.56$ 2.9% 5.80$ 21.1 107,590$
NKE NIKE, Inc. Class B 56.48$ 0.64$ 1.1% 2.45$ 23.1 95,139$
JWN Nordstrom, Inc. 38.12$ 1.48$ 3.9% 2.69$ 14.1 6,610$
OMC Omnicom Group Inc 82.79$ 2.00$ 2.4% 4.92$ 16.8 19,683$
ORLY O'Reilly Automotive, Inc. 256.79$ -$ 0.0% 11.31$ 22.7 24,769$
PNRA Panera Bread Company Class A 211.13$ -$ 0.0% 7.13$ 29.6 5,044$
PII Polaris Industries Inc. 83.88$ 2.20$ 2.6% 6.74$ 12.4 5,421$
SBUX Starbucks Corporation 54.62$ 0.80$ 1.5% 2.08$ 26.2 80,013$
TGT Target Corporation 68.66$ 2.24$ 3.3% 5.30$ 12.9 40,755$
TRI Thomson Reuters Corporation 41.26$ 1.36$ 3.3% 2.16$ 19.1 31,045$
TJX TJX Companies, Inc. 75.44$ 1.04$ 1.4% 3.60$ 20.9 49,967$
TSCO Tractor Supply Company 93.90$ 0.96$ 1.0% 3.68$ 25.5 12,529$
ULTA Ulta Salon, Cosmetics & Fragrance, Inc. 208.47$ -$ 0.0% 6.36$ 32.8 13,057$
VFC V.F. Corporation 61.44$ 1.48$ 2.4% 3.40$ 18.1 25,622$
DIS Walt Disney Company 99.78$ 1.42$ 1.4% 6.06$ 16.5 162,798$
Back to first page
We see three disruptive changes gaining traction within the consumer discretionary sector: (1) e-commerce
growth impact on traditional brick-and-mortar businesses; (2) use of technology services within the restaurant
sector; and (3) acceleration of cord-cutting and the impact on traditional television bundling. The driver of these
changes rests solely on the millennial generation, the largest in U.S. history, with 91 million births between 1980
and 2000 and the first generation to have grown up connected to the internet via tablets and smartphones – so
they are more adept and comfortable at using technology as their sole driver of all commerce (purchasing,
banking, etc.). Falling gas prices and improving job market should provide consumers with increased disposable
income. On the flip side, higher wages are a catch-22 for the Consumer Discretionary sector. On the one hand,
higher wages are positive overall for the U.S. economy and for consumer spending. However, sectors and
industries with a high labor component (ie: Restaurants, Hotels/Resorts/Cruises, Retail, and Advertising) are
likely to have less incremental benefit given the operating expense impact on profits.
– Brian Postol, Equity Sector Analyst
5. 5
Consumer Staples
Ticker Company Name
Price
Dividend
DividendYield
Est.NTMmonths
EPS/AFFO
NTMP/E
Core
DSIP
DynamicGrowth
Focus
HighYieldEquity
MarketCap(mil)
MO Altria Group, Inc. 62.96$ 2.26$ 3.6% 3.16$ 19.9 123,176$
BUD Anheuser-Busch InBev SA Sponsored ADR 121.99$ 3.22$ 2.6% 4.51$ 27.1 195,092$
BF.B Brown-Forman Corporation Class B 95.51$ 1.36$ 1.4% 3.56$ 26.8 19,107$
CLX Clorox Company 128.83$ 3.20$ 2.5% 5.19$ 24.8 16,663$
KO Coca-Cola Company 43.95$ 1.40$ 3.2% 1.99$ 22.1 190,137$
CL Colgate-Palmolive Company 70.02$ 1.56$ 2.2% 2.91$ 24.1 62,529$
COST Costco Wholesale Corporation 142.69$ 1.80$ 1.3% 5.84$ 24.4 62,646$
CVS CVS Health Corporation 99.46$ 1.70$ 1.7% 6.11$ 16.3 106,822$
EL Estee Lauder Companies Inc. Class A 90.48$ 1.20$ 1.3% 3.52$ 25.7 33,409$
GIS General Mills, Inc. 62.45$ 1.84$ 2.9% 3.03$ 20.6 37,120$
SJM J. M. Smucker Company 126.60$ 2.68$ 2.1% 6.40$ 19.8 15,152$
K Kellogg Company 74.30$ 2.00$ 2.7% 3.81$ 19.5 26,009$
KMB Kimberly-Clark Corporation 126.06$ 3.68$ 2.9% 6.29$ 20.1 45,398$
MKC McCormick & Company, Incorporated 95.56$ 1.72$ 1.8% 3.91$ 24.4 12,129$
MJN Mead Johnson Nutrition Company 82.20$ 1.65$ 2.0% 3.62$ 22.7 15,344$
PEP PepsiCo, Inc. 100.10$ 3.01$ 3.0% 4.88$ 20.5 144,586$
PM Philip Morris International Inc. 98.04$ 4.08$ 4.2% 4.63$ 21.2 152,086$
PG Procter & Gamble Company 80.02$ 2.68$ 3.3% 3.93$ 20.4 213,001$
SYY Sysco Corporation 48.55$ 1.24$ 2.6% 2.23$ 21.7 27,359$
THS TreeHouse Foods, Inc. 90.67$ -$ 0.0% 3.50$ 25.9 5,117$
WBA Walgreens Boots Alliance Inc 77.22$ 1.44$ 1.9% 4.94$ 15.6 84,575$
WMT Wal-Mart Stores, Inc. 69.86$ 2.00$ 2.9% 4.29$ 16.3 219,274$
WWAV WhiteWave Foods Company 44.69$ -$ 0.0% 1.48$ 30.1 7,904$
Back to first page
There are at least three important reasons to invest in the consumer staples sector: historically stable growth;
attractive returns; and solid and countercyclical relative share-price performance. Consumer staples are
minimally cyclical, as everyone is a staples consumer regardless of the state of the economy. The sector offers
solid earnings growth opportunities across economic cycles; the high-return nature of these businesses delivers
excess free cash flow after funding operations; and the stocks afford countercyclical relative price performance,
providing rationale to own the sector for both absolute return and diversification. A continued moderate
domestic economic recovery, rising wages, further stabilization of commodity costs and improving employment
scenario would all be helpful contributors towards future consumer spending patterns and profitability
algorithms for the majority of the Consumer Staples companies. The largest headwinds facing the Consumer
Staples sector in 2016 would include further weakening in emerging market economies, sustained appreciation
of the U.S. dollar and rising interest rate expectations.
– Brian Postol, Equity Sector Analyst
6. 6
Energy
Ticker Company Name
Price
Dividend
DividendYield
Est.NTMmonthsEPS/
AFFO
NTMP/E
Core
DSIP
DynamicGrowth
Focus
HighYieldEquity
MarketCap(mil)
APA Apache Corporation 57.11$ 1.00$ 1.8% (0.38)$ n/m 21,618$
CVX Chevron Corporation 99.79$ 4.28$ 4.3% 2.60$ 38.4 188,074$
XEC Cimarex Energy Co. 117.34$ 0.32$ 0.3% 0.70$ n/m 11,126$
CXO Concho Resources Inc. 117.77$ -$ 0.0% (0.74)$ n/m 15,493$
EGN Energen Corporation 43.68$ 0.04$ 0.1% (1.27)$ n/m 4,240$
EPD Enterprise Products Partners L.P. 27.37$ 1.58$ 5.8% 1.38$ 19.8 56,971$
EOG EOG Resources, Inc. 80.92$ 0.67$ 0.8% (1.40)$ n/m 44,528$
XOM Exxon Mobil Corporation 89.74$ 3.00$ 3.3% 3.30$ 27.2 372,117$
KMI Kinder Morgan Inc Class P 17.75$ 0.50$ 2.8% 0.72$ 24.7 39,610$
PSX Phillips 66 77.90$ 2.52$ 3.2% 6.03$ 12.9 40,943$
SLB Schlumberger NV 74.96$ 2.00$ 2.7% 1.54$ 48.6 104,225$
Back to first page
The Energy sector was the worst performing sector relative to that of the S&P 500 in 2015. The global energy markets
are flooded with oil and natural gas creating an oversupplied environment that has weakened these energy
commodities. OPEC’s (Organization of the Petroleum Exporting Countries) push to maintain production and market
share world-wide has shifted the swing-state paradigm to the U.S. shale plays, which are being forced to lower
production. We anticipate 2016 will be another tough year in a “lower-for-longer” oil price environment and expect
additional volatility in the sector throughout the year—especially if additional supply continues to flood the markets.
Even though we do not expect the sector will see much relief in 2016 due to a “still-low” commodity price environment,
we expect the integrated companies to hold their own as they benefit from low oil prices on the refining side. In
addition, we expect the more volatile refining & marketing sub-industry to continue to outperform the sector as it also
benefits from lower oil prices. We anticipate that equities within the exploration & production (E&P) and drillers
industries to exhibit the most volatility, moving in line with changes in the underlying commodities; only
outperforming the integrated names in a stronger commodity environment scenario.
– Michael Colón, Equity Sector Analyst
7. 7
Financials
Ticker Company Name
Price
Dividend
DividendYield
Est.NTMmonths
EPS/AFFO
NTMP/E
Core
DSIP
DynamicGrowth
Focus
HighYieldEquity
MarketCap(mil)
AMG Affiliated Managers Group, Inc. 165.35$ -$ 0.0% 14.22$ 11.6 8,898$
AFL Aflac Incorporated 68.73$ 1.64$ 2.4% 6.76$ 10.2 28,453$
ALL Allstate Corporation 67.15$ 1.32$ 2.0% 5.20$ 12.9 25,139$
AMT American Tower Corporation 104.01$ 2.04$ 2.0% 5.98$ 17.4 44,165$
APAM Artisan Partners Asset Management, Inc. Class A 31.37$ 2.40$ 7.7% 2.36$ 13.3 1,294$
BBT BB&T Corporation 35.08$ 1.12$ 3.2% 2.94$ 11.9 28,487$
BLK BlackRock, Inc. 354.01$ 9.16$ 2.6% 20.77$ 17.0 57,834$
BRO Brown & Brown, Inc. 35.20$ 0.49$ 1.4% 1.83$ 19.3 4,929$
SCHW Charles Schwab Corporation 29.44$ 0.28$ 1.0% 1.37$ 21.5 38,911$
CHSP Chesapeake Lodging Trust 22.72$ 1.60$ 7.0% 1.30$ 17.5 1,365$
CBSH Commerce Bancshares, Inc. 48.07$ 0.90$ 1.9% 2.82$ 17.0 4,641$
EV Eaton Vance Corp. 35.25$ 1.06$ 3.0% 2.24$ 15.8 4,060$
FDS FactSet Research Systems Inc. 155.38$ 2.00$ 1.3% 6.91$ 22.5 6,352$
FRC First Republic Bank 70.51$ 0.64$ 0.9% 3.96$ 17.8 10,267$
BEN Franklin Resources, Inc. 35.56$ 0.72$ 2.0% 2.78$ 12.8 20,800$
GBDC Golub Capital BDC, Inc. 16.84$ 1.28$ 7.6% 1.27$ 13.2 867$
ICE Intercontinental Exchange, Inc. 262.99$ 3.40$ 1.3% 14.57$ 18.0 31,308$
JPM JPMorgan Chase & Co. 63.51$ 1.92$ 3.0% 5.95$ 10.7 232,234$
MTB M&T Bank Corporation 116.39$ 2.80$ 2.4% 8.50$ 13.7 18,506$
MMC Marsh & McLennan Companies, Inc. 64.20$ 1.36$ 2.1% 3.54$ 18.1 33,463$
NTRS Northern Trust Corporation 71.88$ 1.44$ 2.0% 4.40$ 16.3 16,400$
O Realty Income Corporation 59.19$ 2.39$ 4.0% 2.94$ 20.2 14,862$
STAG STAG Industrial, Inc. 20.56$ 1.39$ 6.8% 1.57$ 13.1 1,402$
TSLX TPG Specialty Lending, Inc. 16.29$ 1.56$ 9.6% 1.68$ 9.7 968$
USB U.S. Bancorp 41.74$ 1.02$ 2.4% 3.37$ 12.4 72,060$
Back to first page
Financials typically outperform in early-cycle recoveries and underperform later in the cycle. Despite being more than five
years into the recovery, economic indicators suggest we might be in the middle innings of the current business cycle. The key
themes related to financial sector performance are interest rates and economic growth expectations (GDP). Unless interest
rates and the economy breakout to the upside or downside we believe the sector will largely perform in line with the overall
market. Under current expectations for the economy and interest rates, we believe that increasing credit costs could more
than offset any potential benefit from modestly higher interest rates. The consensus expectation is for earnings to grow mid-
single digits on the back of low single-digit revenue growth this year. Recent earnings revisions have had a downward bias.
We prefer to see higher revenue growth driving profitability as opposed to expense controls. The Federal Reserve (Fed) is
expected to tighten only one or two more times this year, based on this projection we recommend investors overweight stocks
with less interest rate sensitivity. We prefer allocating to the non-life insurance segment including the brokers and property
and casualty names with diversified customer types. Select asset managers and exchange stocks also have less interest rate
exposure. We believe that Regional banks are most exposed to the potentially negative occurrence associated with
increasing credit costs combined with stubbornly low rates. Capital markets activity has been anemic as trading and
investment banking businesses have significantly underperformed expectations year-to-date.
-- Michael Behan, CFA, Equity Sector Analyst
8. 8
Health Care
-- Michael Colón, Equity Sector Analyst
Ticker Company Name
Price
Dividend
DividendYield
Est.NTMmonthsEPS
/AFFO
NTMP/E
Core
DSIP
DynamicGrowth
Focus
HighYieldEquity
MarketCap(mil)
ABT Abbott Laboratories 37.60$ 1.04$ 2.8% 2.31$ 16.3 55,240$
ABBV AbbVie, Inc. 59.69$ 2.28$ 3.8% 5.09$ 11.7 96,540$
AET Aetna Inc. 110.64$ 1.00$ 0.9% 8.36$ 13.2 38,790$
AGN Allergan plc 229.49$ -$ 0.0% 15.38$ 14.9 90,677$
ABC AmerisourceBergen Corporation 74.82$ 1.36$ 1.8% 5.74$ 13.0 16,150$
AMGN Amgen Inc. 150.18$ 4.00$ 2.7% 11.53$ 13.0 112,818$
BDX Becton, Dickinson and Company 165.00$ 2.64$ 1.6% 9.14$ 18.0 35,013$
CELG Celgene Corporation 101.46$ -$ 0.0% 6.19$ 16.4 78,591$
GILD Gilead Sciences, Inc. 82.64$ 1.88$ 2.3% 12.19$ 6.8 110,062$
GSK GlaxoSmithKline plc Sponsored ADR 42.01$ 2.32$ 5.5% 2.58$ 16.3 102,326$
JNJ Johnson & Johnson 112.64$ 3.20$ 2.8% 6.75$ 16.7 309,832$
MCK McKesson Corporation 182.29$ 1.12$ 0.6% 13.66$ 13.3 41,019$
MDT Medtronic Plc 80.52$ 1.52$ 1.9% 4.73$ 17.0 112,812$
MRK Merck & Co., Inc. 55.11$ 1.84$ 3.3% 3.73$ 14.8 152,546$
NVS Novartis AG Sponsored ADR 75.79$ 2.30$ 3.0% 4.85$ 15.6 176,137$
OMI Owens & Minor, Inc. 36.86$ 1.02$ 2.8% 2.03$ 18.2 2,315$
PFE Pfizer Inc. 33.74$ 1.20$ 3.6% 2.49$ 13.6 204,628$
SYK Stryker Corporation 110.25$ 1.52$ 1.4% 5.98$ 18.4 41,231$
UNH UnitedHealth Group Incorporated 130.94$ 2.00$ 1.5% 8.28$ 15.8 124,498$
Back to first page
The health care sector was one of the few sectors that outperformed the S&P 500 in 2015. Valuations have been
enhanced by the high number of merger and acquisitions (M&A) across many of the industries in the sector,
coupled with some high profile product successes in the biotech and pharmaceutical industries. We anticipate
that collaborations across companies will continue into 2016 as well as full-fledged M&As. More importantly, we
expect that product pricing and M&A in the form of inversions will spark discussion among political candidates as
the election hype gains steam in 2016—potentially creating additional volatility in the sector. We anticipate that
the continued interest in expanding businesses through M&A will help continue to buoy valuations within the
sector. We expect the contribution from The Affordable Care Act (ACA) to these industries will begin to level off
after this year and be less meaningful. A low unemployment level is positive for the medical device names, given
their historical negative correlation to employment data; and product data in 2016 should be positive for this
industry. Pharmaceutical pipelines are strengthening and we expect renewed interest in the subindustry to
continue. Additionally, we expect the strengthening of research & development (R&D) efforts to further drive M&A
activity within the sector, involving anything from strategic collaborations of all sizes to full-blown mergers and
acquisitions. We continue to be selective within the biotechnology sector and prefer higher quality names within
this sub-industry. The strength of the dollar will also continue to be a headwind to international companies, as the
resulting foreign exchange effect will lower the impact of organic growth on company bottom lines.
Health Care Reform
ACA began the process of implementation immediately after the bill was signed into law in March of 2010. The
ruling in favor of the ACA in the summer of 2015 spurred M&A action within the managed care sub-industry. We
anticipate that the Affordable Care Act will be brought up on and off during the presidential elections as part of
platforms for the elections. The ACA is viewed as benefiting those companies and sub-industries that are more
heavily weighted on the anticipated increase in volumes that the additionally covered lives provide, such as for
laboratories, facilities, Pharmacy Benefit Managers, and managed care; yet, we anticipate the benefit is starting to
be a less meaningful contributor to growth for these companies going forward.
– Michael Colón, Equity Sector Analyst
9. 9
Industrials
Ticker Company Name
Price
Dividend
DividendYield
Est.NTMmonths
EPS/AFFO
NTMP/E
Core
DSIP
DynamicGrowth
Focus
HighYieldEquity
MarketCap(mil)
MMM 3M Company 165.01$ 4.44$ 2.7% 8.51$ 19.4 100,081$
CAT Caterpillar Inc. 69.87$ 3.08$ 4.4% 3.55$ 19.7 40,797$
DHR Danaher Corporation 98.75$ 0.64$ 0.6% 5.09$ 19.4 68,009$
DY Dycom Industries, Inc. 71.97$ -$ 0.0% 4.41$ 16.3 2,256$
EMR Emerson Electric Co. 50.65$ 1.90$ 3.8% 3.21$ 15.8 32,586$
EXPD Expeditors International of Washington, Inc. 48.43$ 0.80$ 1.7% 2.44$ 19.8 8,817$
GD General Dynamics Corporation 144.62$ 3.04$ 2.1% 9.75$ 14.8 44,203$
GE General Electric Company 29.56$ 0.92$ 3.1% 1.60$ 18.5 271,824$
ITW Illinois Tool Works Inc. 103.14$ 2.20$ 2.1% 5.72$ 18.0 37,065$
LSTR Landstar System, Inc. 66.24$ 0.32$ 0.5% 3.34$ 19.8 2,804$
LMT Lockheed Martin Corporation 240.07$ 6.60$ 2.7% 12.59$ 19.1 73,090$
NSC Norfolk Southern Corporation 85.44$ 2.36$ 2.8% 5.88$ 14.5 25,268$
UPS United Parcel Service, Inc. Class B 101.51$ 3.12$ 3.1% 5.97$ 17.0 89,781$
UTX United Technologies Corporation 99.10$ 2.64$ 2.7% 6.71$ 14.8 82,933$
GWW W.W. Grainger, Inc. 222.59$ 4.88$ 2.2% 12.41$ 17.9 13,650$
WBC WABCO Holdings Inc. 101.10$ -$ 0.0% 5.92$ 17.1 5,687$
Back to first page
Geographically, U.S. growth is likely to lead in 2016 amongst all developed markets. China growth is expected to be
healthy, but at a decelerating rate. Emerging markets (India, Mexico, South Africa and Indonesia) are expected to post
solid GDP growth, while Russia is likely to decelerate. In the U.S., we expect continued improvement in construction
spending, as financing rates remain attractive. Demand for heavy-duty trucks should remain strong driven by new fuel
efficiency standards and capacity constraints due to an improving U.S. economy and ongoing driver shortage. Farm
equipment demand should lag due to declining farm incomes and land values. Healthy consumer spending, improving
government outlays and solid residential investment (63% of demand for Industrial Production) should provide support
for the sector. In addition, lower fuel costs should benefit most Industrial names, particularly transportation-related. On
the other hand, tepid growth in equipment investment and exports are likely to remain a persistent headwind.
Additionally, Industrial names are dependent on growing global demand. If demand remains tepid, or decelerate, a more
sanguine outlook for the sector could develop.
-- Brian Postol, Equity Sector Analyst
10. 10
Information Technology
Ticker Company Name
Price
Dividend
DividendYield
Est.NTMmonthsEPS
/AFFO
NTMP/E
Core
DSIP
DynamicGrowth
Focus
HighYieldEquity
MarketCap(mil)
ACN Accenture Plc 116.47$ 2.20$ 1.9% 5.67$ 20.5 73,133$
GOOGL Alphabet Inc. Class A 721.71$ -$ 0.0% 35.91$ 20.1 495,494$
ADI Analog Devices, Inc. 56.54$ 1.68$ 3.0% 3.01$ 18.8 17,378$
AAPL Apple Inc. 95.22$ 2.28$ 2.4% 8.79$ 10.8 521,561$
ADP Automatic Data Processing, Inc. 85.47$ 2.12$ 2.5% 3.64$ 23.5 38,935$
BR Broadridge Financial Solutions, Inc. 63.79$ 1.20$ 1.9% 3.03$ 21.1 7,541$
CSCO Cisco Systems, Inc. 27.97$ 1.04$ 3.7% 2.41$ 11.6 140,748$
CSOD Cornerstone Ondemand, Inc. 37.11$ -$ 0.0% 0.15$ n/a 2,044$
EA Electronic Arts Inc. 73.11$ -$ 0.0% 3.65$ 20.1 22,614$
FFIV F5 Networks, Inc. 106.64$ -$ 0.0% 7.60$ 14.0 7,143$
FB Facebook, Inc. Class A 117.35$ -$ 0.0% 3.97$ 29.6 335,656$
FTNT Fortinet, Inc. 33.71$ -$ 0.0% 0.77$ 43.8 5,787$
HRS Harris Corporation 78.74$ 2.00$ 2.5% 5.89$ 13.4 9,821$
INTC Intel Corporation 30.15$ 1.04$ 3.4% 2.47$ 12.2 142,368$
IBM International Business Machines Corporation 147.25$ 5.60$ 3.8% 13.74$ 10.7 141,354$
JKHY Jack Henry & Associates, Inc. 83.06$ 1.12$ 1.3% 3.06$ 27.1 6,552$
MCHP Microchip Technology Incorporated 48.82$ 1.44$ 2.9% 3.20$ 15.2 10,436$
MSFT Microsoft Corporation 50.62$ 1.44$ 2.8% 2.87$ 17.7 397,897$
ORCL Oracle Corporation 39.41$ 0.60$ 1.5% 2.79$ 14.1 163,546$
PAYX Paychex, Inc. 52.03$ 1.68$ 3.2% 2.21$ 23.5 18,737$
Overall demand for technology remains fairly sound, but growth within some industries appears to be
slowing. Global PC shipments declined at a faster pace than initially anticipated during the first quarter of 2016,
and near-term risks remain. However, we continue to see strength in the enterprise and data center segments. In our
opinion, some of the best opportunities remain within semiconductor markets that have exposure to industrial and
automotive applications.
Much of the 2015 performance was driven by mega-cap stocks, notably companies related to the cloud, search &
advertising, and streaming media. The shift to mobile should continue and the social media user base should
continue to expand. The semiconductor industry has worked through recent channel inventory issues, and shipments
should be nearing normal consumption trends. It appears we are closer to the tail-end of the correction cycle.
Automotive should be a bright spot for the semiconductor industry. Digital content inside the automobile is rapidly
increasing, including features such as advanced driver assist systems (ADAS), in-vehicle connectivity, and
infotainment. Long-term, we believe that semiconductor demand should be supported by growth in the number of
connected devices, including wearables, which should result in a rapid increase in the number of chips used in
everyday items.
The heightened level of M&A activity within technology (especially within semiconductors) should continue, as large
semiconductor companies look to get bigger. Companies may be looking to gain scale, and consolidation is often
viewed as a way to save on the ever increasing cost of design and manufacturing of new chips.
– Tom Christopher, Equity Sector Analyst
* Technology and Internet-related stocks, especially of smaller, less-seasoned companies, tend to be more volatile than the
overall market.
11. 11
PYPL PayPal Holdings Inc 37.53$ -$ 0.0% 1.60$ 23.5 45,487$
QCOM QUALCOMM Incorporated 54.52$ 2.12$ 3.9% 4.46$ 12.2 80,086$
RHT Red Hat, Inc. 73.17$ -$ 0.0% 2.32$ 31.5 13,276$
CRM salesforce.com, inc. 81.02$ -$ 0.0% 1.11$ 72.8 54,967$
TXN Texas Instruments Incorporated 58.53$ 1.52$ 2.6% 3.07$ 19.1 58,778$
V Visa Inc. Class A 77.67$ 0.56$ 0.7% 3.07$ 25.3 185,214$
WEX WEX Inc. 88.67$ -$ 0.0% 4.53$ 19.6 3,431$
Back to first page
12. 12
Materials
Ticker Company Name
Price
Dividend
DividendYield
Est.NTMmonthsEPS/
AFFO
NTMP/E
Core
DSIP
DynamicGrowth
Focus
HighYieldEquity
MarketCap(mil)
APD Air Products and Chemicals, Inc. 141.44$ 3.44$ 2.4% 7.84$ 18.1 30,562$
ATR Aptargroup, Inc. 75.33$ 1.20$ 1.6% 3.37$ 22.4 4,758$
DOW Dow Chemical Company 51.36$ 1.84$ 3.6% 3.69$ 13.9 57,669$
ECL Ecolab Inc. 116.72$ 1.40$ 1.2% 4.67$ 25.0 34,235$
PKG Packaging Corporation of America 65.13$ 2.20$ 3.4% 4.64$ 14.0 6,129$
PX Praxair, Inc. 110.08$ 3.00$ 2.7% 5.75$ 19.2 31,402$
SHW Sherwin-Williams Company 289.61$ 3.36$ 1.2% 13.28$ 21.8 26,787$
Back to first page
The Materials sector started 2016 with a steep drop through January as the market overall declined on
fears of slowing growth. After that very weak start, however, the sector bounced significantly through
February and March, outpacing the overall market and showing the sector’s beta. Not surprisingly, the
sector’s performance chart looks a lot like that of the S&P GSCI, a broad-based commodities index. As
price-takers with relatively fixed cost structures, most materials companies will fluctuate with the prices of
their products and/or input costs.
Recent drivers of the Materials sector have been global commodity prices and merger and acquisition
(M&A) activity. Commodity prices are driven by supply and demand. Basically, supply has outpaced
demand across several products, leading to price weakness. Some of the causes of the weakness can be
traced to China (slowing growth and demand) and some to the Middle East and U.S. (still pumping oil
and gas). M&A has picked up in the sector as have divestitures/spinoffs.We expect M&A will stay at the
forefront during 2016, particularly in agriculture companies, as firms bulk up to keep pace with growing
competitors.
We recommend investors focus the bulk of their Materials sector exposure on non-commodity chemicals
manufacturers. This broad group includes diversified, agricultural, and specialty chemicals, and
industrial gases. We recommend avoiding industries with more direct exposure to commodity prices,
namely metals and mining firms.
– Joe Buffa, Equity Sector Analyst
13. 13
Telecommunications Services
Ticker Company Name
Price
Dividend
DividendYield
Est.NTMmonthsEPS
/AFFO
NTMP/E
Core
DSIP
DynamicGrowth
Focus
HighYieldEquity
MarketCap(mil)
T AT&T Inc. 38.45$ 1.92$ 5.0% 2.92$ 13.2 236,716$
SBAC SBA Communications Corporation 97.30$ -$ 0.0% 0.86$ 113.6 12,213$
VZ Verizon Communications Inc. 49.66$ 2.26$ 4.6% 3.99$ 12.5 202,429$
Back to first page
Telecom has been one of the standout sectors so far in 2016 as the defensive sectors have far outperformed
the market overall (utilites are the other significant outperformer). In periods of market volatility like we saw
through the early part of 2016, many investors look to low beta, low volatility stocks. Telecom, with its current
4.5% dividend yield and 0.7 beta, fits this characterization. On a relative basis, we would expect the sector to
underperform if and when the market settles into an uptrend (generally like we’ve witnessed since mid-
February).
The top drivers within the Telecom sector recently have been competition in wireless, regulation, and
dividend yields. In wireless, AT&T and Verizon have been feeling pressure in the segment as competitor
marketing efforts have resonated with consumers. The regulatory picture has gotten fuzzier over the past 12
months with the passage of expanded net neutrality rules governing the internet. This situation is currently
working its way through the legal system and will likely still be outstanding at year-end 2016 but news flow
could affect stocks in the sector. Finally, as the highest yielding sector in the S&P 500, Telecom is sensitive to
interest rate hikes.
We believe the large, diverse carriers are appropriate as the cornerstone of an investor’s Telecom exposure
and view the tower companies as attractive alternatives for higher-growth accounts.
– Joe Buffa, Equity Sector Analyst
14. 14
Utilities
Ticker Company Name
Price
Dividend
DividendYield
Est.NTMmonthsEPS/
AFFO
NTMP/E
Core
DSIP
DynamicGrowth
Focus
HighYieldEquity
MarketCap(mil)
DUK Duke Energy Corporation 77.00$ 3.30$ 4.3% 4.65$ 16.6 53,046$
EIX Edison International 70.05$ 1.92$ 2.7% 3.98$ 17.6 22,823$
ES Eversource Energy 54.91$ 1.78$ 3.2% 3.06$ 18.0 17,418$
NFG National Fuel Gas Company 53.96$ 1.58$ 2.9% 2.95$ 18.3 4,583$
NJR New Jersey Resources Corporation 34.75$ 0.96$ 2.8% 1.71$ 20.4 2,990$
NEE NextEra Energy, Inc. 119.33$ 3.48$ 2.9% 6.33$ 18.9 55,064$
SCG SCANA Corporation 68.41$ 2.30$ 3.4% 4.04$ 16.9 9,777$
SJI South Jersey Industries, Inc. 28.19$ 1.06$ 3.7% 1.34$ 21.0 2,240$
SO Southern Company 48.65$ 2.24$ 4.6% 2.90$ 16.8 45,661$
WEC WEC Energy Group Inc 58.51$ 1.68$ 2.9% 2.99$ 19.5 18,469$
WR Westar Energy, Inc. 52.39$ 1.52$ 2.9% 2.47$ 21.2 7,423$
XEL Xcel Energy Inc. 40.47$ 1.36$ 3.4% 2.25$ 18.0 20,557$
Back to first page
Despite the current low interest rate environment, uncertainties surround the strength of the global macro-
economy. Yet, Utilities exhibit more investor-friendly rate mechanisms within the industry, with minimal
exposure to economic weakness outside the US. Also, attractive dividend yields can be considered
justification for above-average valuation levels. The Wells Fargo Investment Institute Global Investment
Strategy Team currently ranks the sector as Underweight.
The typically stable earnings and dividend potential of higher quality utilities can potentially provide
ballast to a portfolio in a volatile market. Many utilities are well-managed, and often provide investors with
attractive dividends; but we also recognize that valuations within the sector are currently above-average.
Regulatory programs and the existing safety-related pipeline replacement strategies may also lead to
increased merger and acquisition (M&A) activity. Larger electric utilities may look to acquire assets to
diversify their product portfolio while filling any distribution gaps that may exist - but, current valuations
are not cheap.
On the operational front, the industry continues to face challenges, including downward pressure on
allowed return on equities (ROEs) due to low interest rates, threats from renewable and distributed
generation, minimal demand growth, and uncertainty regarding environmental regulations. We are
cautious on utilities with significant positions in unregulated power markets. Conversely, we would favor
largely regulated utilities, expecting them to grow earnings and dividends in a reasonably consistent and
stable fashion.
-- Tom Christopher, Equity Sector Analyst
15. 15
Definitions
ASG List Descriptions:
IMPORTANT DISCLOSURES
For important disclosure information, please contact:
Estimated NTM EPS: Street consensus earnings per share estimate for the next 12 months. For REITs we use adjusted
funds from operations (AFFO).
NTM P/E: Price to earnings ratio based on the next 12 months EPS.
Market Cap: The company's market capitaliation.
The Core List is comprised of blue chip, industry-leading companies that we believe can withstand the test of time. The
objective is to provide a list of high-quality stocks that can be used to build a well-diversified portfolio or can be used to
supplement an existing portfolio.
The DSIP List (Diversified Stock Income Plan List) focuses on companies that we believe will provide consistent annual
dividend growth over a long-term investment horizon. Our objective is to provide a broad list of high quality, industry
leading companies from which an investor can assemble a well-diversified portfolio. Through consistent dividend
growth, our goal is to help investors stay ahead of the wealth eroding effects of inflation.
The Dynamic Growth Equity List focuses on companies that we believe offer above average growth potential and may be
on track to become leaders in the markets they serve. Our objective is to offer investors a list of stocks that they can use
to help build a well-diversified portfolio or to fill holes in an existing portfolio.
The Focus List includes 25 stocks and represents a combination of the equity sector guidance from Wells Fargo
Investment Institute and security selection from our Wells Fargo Advisors Equity Analysts. The objective is to exceed
the total return of the S&P 500 over an approximate one-year timeframe.
The High Yield Equity Income List seeks to emphasize companies with notably higher dividend yields than the broader
market (as measured by the S&P 500). Our objective is to offer a list of stocks for investors seeking a higher level of
income and willing to accept a higher level of risk.
Disclosure Information
Beta is a quantitative measure of the volatility of a given stock, mutual fund, or portfolio, relative to the overall market,
usually the S&P 500. Specifically, the performance the stock, fund or portfolio has experienced in the last 5 years as the
S&P 500 moved 1% up or down. A beta above 1 is more volatile than the overall market, while a beta below 1 is less
volatile.
Wells Fargo Advisors, Attn: Advisory Services (Disclosure Information)
St. Louis, MO 63103
Or call by phone: (888)-410-9203
Please remember to specify the issuer(s) with respect to which you would like to receive disclosure information.
Analyst or household member owns a long common equity position in General Electric Co. (GE) & Treehouse Foods Inc.
(THS)
ANALYST CERTIFICATION: The Analyst who prepared this report hereby certifies that the views expressed in this
report accurately reflect his/her personal views about the subject companies and their securities. The Analyst also certifies
that he/she has not been, is not, and will not be receiving direct or indirect compensation for expressing the specific
recommendation(s) or view(s) in this report.
16. 16
Exposure to the commodities markets subject an investment to greater share price volatility than an investment in
traditional equity or debt securities. Products that invest in commodities may employ more complex strategies which
may expose investors to additional risks.
Disclaimers
You should be aware that investments can fluctuate in price, value and/or income, and you may get back less than you
invested. We recommend that existing shareholders consider their objectives, their risk tolerance, and the size of their
positions relative to their portfolios when evaluating their holdings.
There is no assurance that any of the target prices mentioned will be attained. Any market prices are only indications of
market values and are subject to change.
Dividends are not guaranteed and are subject to change or elimination.
Investments that are concentrated in a specific sector, industry, country or commodity increases its vulnerability to any
economic, political, currency or regulatory development, which may result in greater price volatility.
There are special risks associated with an investment in real estate, including credit risk, interest rate fluctuations and
the impact of varied economic conditions.
Investing in foreign securities presents certain risks not associated with domestic investments, such as currency
fluctuation, political and economic instability, and different accounting standards. This may result in greater share price
volatility. These risks are heightened in emerging markets.
Technology and internet-related stocks, especially of smaller, less-seasoned companies, tend to be more volatile than the
overall market.
The prices of small and mid-cap company stocks are generally more volatile than large company stocks. They often
involve higher risks because smaller companies may lack the management expertise, financial resources, product
Investments in currencies involve certain risks, including credit risk, interest rate fluctuations, fluctuations in currency
exchange rates, derivative investment risk and the effect of political and economic conditions.
Investments in the energy sector are subject to the adverse economic events within that industry. A downturn in the
energy sector of the economy, adverse political, legislative or regulatory developments or other events could have a large
impact on a portfolio’s investments in this sector.
American depositary receipt (ADR) is a stock that trades in the United States but represents a specified number of shares
in a foreign corporation. ADRs are bought and sold on American markets just like regular stocks, and are
issued/sponsored in the U.S. by a bank or brokerage. If the home currency is devalued, this can result in a loss to the
ADR holder, even if the company had been performing well. Due to currency exchange rate fluctuations, dividends can
also vary significantly period to period. For example, a company may increase its dividend on a euro basis, but U.S. ADR
holders may see their dividend decrease. Bear in mind that outside the U.S., the attitude toward dividends is different.
Business Development Company or Registered Investment Company (BDC/RIC) is a type of closed-end mutual fund
designed to lend to private middle-market businesses. The BDC/RIC model was created in 1980, when Congress
modified the 1940 Investment Company Act to facilitate private finance investment.
An index is not managed and is unavailable for direct investment.
S&P GSCI Index (formerly the Goldman Sachs Commodity Index) serves as a benchmark for investment in the
commodity markets and as a measure of commodity performance over time. The S&P GSCI contains as many
commodities as possible, with rules excluding certain commodities to maintain liquidity and investability in the
underlying futures markets. The index currently comprises 24 commodities from all commodity sectors - energy
products, industrial metals, agricultural products, livestock products and precious metals.