December 2015 TREB Market Watch
•
1 j'aime•2,189 vues

The real estate market closed the year on a high note ! Looking for a home evaluation, feel free to contact me.

Recommandé
Contenu connexe
Plus de Michelle Makos
Plus de Michelle Makos (20)
Dernier
Dernier (20)
December 2015 TREB Market Watch
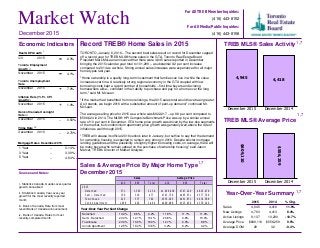
- 1. Toronto Employment Growth November 2015 4.1% Month December 2015 1 Year 3 Year 5 Year 3.14% 3.39% 4.64% December 2015 1 Year 3 Year 5 Year -- -- -- Market Watch For All TREB Member Inquiries: (416) 443-8158 For All Media/Public Inquiries: (416) 443-8152 Record TREB® Home Sales in 2015 TORONTO, January 6, 2016 – The second best sales result on record for December capped off a record year for TREB MLS® home sales in the GTA. Toronto Real Estate Board President Mark McLean announced that there were 4,945 sales reported in December bringing the 2015 calendar year total to 101,299 – a substantial 9.2 per cent increase compared to 2014 as a whole. Strong annual sales increases were experienced for all major home types last year. "Home ownership is a quality long-term investment that families can live in while the value increases over time. A relatively strong regional economy in the GTA coupled with low borrowing costs kept a record number of households – first-time buyers and existing homeowners alike – confident in their ability to purchase and pay for a home over the long term," said Mr. McLean. "If the market had benefitted from more listings, the 2015 sales total would have been greater. As it stands, we begin 2016 with a substantial amount of pent-up demand," continued Mr. McLean. The average selling price for 2015 as a whole was $622,217 – up 9.8 per cent compared to $566,624 in 2014. The MLS® HPI Composite Benchmark Price was up by a similar annual rate of 10 per cent in December. GTA home price growth was driven by the low-rise segments of the market, but condominium apartment price growth was generally well-above the rate of inflation as well through 2015. "TREB will release its official 2016 outlook later in January, but suffice to say that the demand for ownership housing is expected to remain very strong in 2016. Despite stricter mortgage lending guidelines and the possibility of slightly higher borrowing costs, on average, there will be many buyers who remain upbeat on the purchase of ownership housing," said Jason Mercer, TREB's Director of Market Analysis. TREB MLS® Sales Activity 4,945 4,418 December 2015 December 2014 TREB MLS® Average Price $609,110 $556,259 December 2015 December 2014 Year-Over-Year Summary 2015 2014 % Chg. Sales New Listings Active Listings Average Price Average DOM 4,945 4,418 11.9% 4,783 4,413 8.4% 9,137 10,230 -10.7% $609,110 $556,259 9.5% 29 32 -9.4% Sources and Notes: i - Statistics Canada, Quarter-over-quarter growth, annualized ii - Statistics Canada, Year-over-year growth for the most recently reported month iii - Bank of Canada, Rate from most recent Bank of Canada announcement iv - Bank of Canada, Rates for most recently completed month Real GDP Growth Q3 2015 2.3% Toronto Unemployment Rate November 2015 7.0% Inflation Rate (Yr./Yr. CPI Growth) November 2015 1.4% Bank of Canada Overnight Rate December 2015 -- 0.50% Prime Rate December 2015 -- 2.70% Economic Indicators Metrics Sales Average Price 416 905 Total 416 905 Total 2015 Detached Semi - Detached Townhouse Condo Apartment 571 1,563 2,134 $1,039,638 $747,229 $825,470 158 319 477 $743,738 $495,551 $577,760 215 577 792 $535,283 $451,971 $474,588 1,038 426 1,464 $400,088 $325,036 $378,249 Sales & Average Price By Major Home Type December 2015 December 2015 i ii ii iii iv Detached Semi - Detached Townhouse Condo Apartment 11.8% 11.7% 11.9% 20.8% 9.8% 15.0% 12.7% 6.9% 8.8% 3.2% 8.2% 4.2% Detached Semi - Detached Townhouse Condo Apartment 10.9% 8.5% 9.2% 23.4% 12.7% 16.1% 23.6% 16.6% 18.4% 12.5% 16.4% 13.6% 1,7 1,7 1,7 1,7 Year-Over-Year Per Cent Change Mortgage Rates
- 2. Toronto Real Estate Board Market Watch, December 2015 SALES BY PRICE RANGE AND HOUSE TYPE DECEMBER 2015 2 Price Range Detached Semi-Detached Att/Row/Twnhouse Condo Townhouse Condo Apt Link Co-op Apt Det Condo Co-ownership Apt Total $0 to $99,999 $100,000 to $199,999 $200,000 to $299,999 $300,000 to $399,999 $400,000 to $499,999 $500,000 to $599,999 $600,000 to $699,999 $700,000 to $799,999 $800,000 to $899,999 $900,000 to $999,999 $1,000,000 to $1,249,999 $1,250,000 to $1,499,999 $1,500,000 to $1,749,999 $1,750,000 to $1,999,999 $2,000,000+ 1 0 0 0 6 0 0 0 0 7 9 0 0 15 89 0 0 0 0 113 53 19 10 71 457 0 0 0 1 611 115 38 59 148 472 16 1 1 0 850 254 133 120 105 231 8 0 1 0 852 383 122 86 32 92 10 1 0 0 726 346 73 53 13 44 20 0 0 0 549 248 43 26 13 26 11 0 0 0 367 180 22 12 2 8 5 0 0 0 229 117 14 6 4 11 0 1 0 0 153 168 4 2 6 16 0 2 0 0 198 98 4 1 3 3 0 0 0 0 109 47 3 3 2 4 0 0 0 0 59 30 0 0 0 2 0 0 0 0 32 85 2 0 0 3 0 0 0 0 90 Price Range Detached Semi-Detached Att/Row/Twnhouse Condo Townhouse Condo Apt Link Co-op Apt Det Condo Co-ownership Apt Total $0 to $99,999 $100,000 to $199,999 $200,000 to $299,999 $300,000 to $399,999 $400,000 to $499,999 $500,000 to $599,999 $600,000 to $699,999 $700,000 to $799,999 $800,000 to $899,999 $900,000 to $999,999 $1,000,000 to $1,249,999 $1,250,000 to $1,499,999 $1,500,000 to $1,749,999 $1,750,000 to $1,999,999 $2,000,000+ 16 0 1 12 96 0 2 0 2 129 213 11 9 334 1,491 0 31 0 13 2,102 1,058 402 274 1,383 7,780 52 19 1 27 10,996 3,512 949 1,475 2,439 7,871 387 16 24 18 16,691 6,015 2,780 2,460 2,057 3,830 241 13 27 3 17,426 7,611 2,590 1,612 779 1,698 232 11 23 6 14,562 7,470 1,562 1,152 306 794 297 6 10 0 11,597 5,676 809 626 192 429 241 1 6 0 7,980 4,409 462 224 74 207 110 2 2 0 5,490 2,929 226 117 51 110 20 3 1 0 3,457 3,930 204 101 59 172 6 3 1 0 4,476 2,345 116 39 17 91 0 0 1 0 2,609 1,168 49 12 12 52 0 0 0 0 1,293 763 25 3 2 29 0 2 0 0 824 1,542 32 7 5 81 0 0 0 0 1,667 SALES BY PRICE RANGE AND HOUSE TYPE YEAR-TO-DATE, 2015 Total Sales Share of Total Sales Average Price 2,134 477 378 414 1,464 70 5 2 1 4,945 43.2% 9.6% 7.6% 8.4% 29.6% 1.4% 0.1% 0.0% 0.0% 100.0% $825,470 $577,760 $535,960 $418,552 $378,249 $573,728 $816,800 $387,500 $253,000 $609,110 Total Sales Share of Total Sales Average Price 48,657 10,217 8,112 7,722 24,731 1,586 109 96 69 101,299 48.0% 10.1% 8.0% 7.6% 24.4% 1.6% 0.1% 0.1% 0.1% 100.0% $806,744 $579,516 $530,412 $411,917 $379,512 $551,367 $396,345 $511,279 $280,042 $622,217 1,7 1,7
- 3. Toronto Real Estate Board Market Watch, December 2015 Number of Sales Dollar Volume Average Price Median Price New Listings SNLR (Trend) Active Listings Mos. Inv. (Trend) Avg. SP / LP Avg. DOM TREB Total Halton Region Burlington Halton Hills Milton Oakville Peel Region Brampton Caledon Mississauga City of Toronto Toronto West Toronto Central Toronto East York Region Aurora E. Gwillimbury Georgina King Markham Newmarket Richmond Hill Vaughan Whitchurch-Stouffville Durham Region Ajax Brock Clarington Oshawa Pickering Scugog Uxbridge Whitby Dufferin County Orangeville Simcoe County Adjala-Tosorontio Bradford West GwillimburyEssa Innisfil New Tecumseth 4,945 $3,012,046,480 609,110 $505,000 4,783 63.1% 9,137 1.8 99% 29 375 $245,697,318 655,193 $565,000 307 69.1% 719 1.8 98% 30 96 $53,319,500 555,411 $530,500 71 74.5% 159 1.7 98% 30 51 $28,297,300 554,849 $515,000 42 70.5% 85 1.9 98% 35 93 $50,116,500 538,887 $518,000 84 73.2% 131 1.3 99% 18 135 $113,964,018 844,178 $728,800 110 63.4% 344 2.1 97% 37 1,042 $543,932,247 522,008 $473,000 1,019 64.0% 1,647 1.6 98% 27 455 $217,940,049 478,989 $462,500 480 66.5% 562 1.3 99% 23 60 $45,050,400 750,840 $640,000 37 61.3% 117 2.7 96% 39 527 $280,941,798 533,096 $462,500 502 62.2% 968 1.9 98% 30 1,999 $1,253,258,040 626,942 $480,000 2,029 57.7% 4,325 2.2 99% 31 535 $292,649,058 547,008 $475,000 548 60.1% 1,066 2.1 99% 30 943 $685,942,882 727,405 $452,500 987 52.7% 2,497 2.7 98% 35 521 $274,666,100 527,190 $535,000 494 65.9% 762 1.3 101% 23 848 $660,347,405 778,712 $685,000 804 63.8% 1,572 1.7 99% 29 44 $35,295,626 802,173 $697,500 34 72.2% 68 1.4 98% 30 15 $11,104,299 740,287 $690,999 10 63.9% 44 2.4 96% 50 53 $21,743,000 410,245 $375,000 44 67.8% 104 1.9 98% 38 21 $19,334,990 920,714 $710,000 21 52.9% 81 4.3 95% 56 218 $175,653,573 805,750 $751,500 239 60.7% 427 1.6 99% 27 80 $51,932,591 649,157 $585,000 52 78.6% 49 0.9 99% 22 177 $158,573,146 895,893 $766,000 160 61.6% 308 1.7 100% 28 197 $152,850,580 775,891 $685,000 193 63.2% 380 1.7 98% 27 43 $33,859,600 787,433 $671,500 51 65.7% 111 2.0 96% 39 548 $247,515,563 451,671 $424,200 512 74.2% 610 1.1 99% 21 115 $58,309,062 507,035 $485,000 95 76.5% 73 0.8 100% 15 7 $2,771,400 395,914 $274,900 23 54.7% 59 4.6 95% 61 80 $34,713,880 433,924 $397,500 71 76.3% 89 1.1 100% 22 163 $58,216,209 357,155 $334,000 142 77.1% 131 0.9 100% 17 63 $32,384,474 514,039 $465,000 71 69.7% 101 1.2 100% 20 13 $5,684,800 437,292 $405,000 15 61.9% 41 2.8 97% 28 10 $8,759,672 875,967 $702,200 19 61.1% 52 3.0 92% 70 97 $46,676,066 481,197 $460,000 76 77.0% 64 0.9 99% 23 29 $12,366,200 426,421 $385,000 24 87.3% 25 1.2 98% 36 29 $12,366,200 426,421 $385,000 24 87.3% 25 1.2 98% 36 104 $48,929,707 470,478 $447,250 88 71.2% 239 2.2 98% 37 13 $7,065,707 543,516 $527,000 12 66.1% 40 3.5 99% 57 36 $19,255,700 534,881 $509,250 28 74.1% 40 1.5 98% 24 6 $2,159,500 359,917 $362,500 9 71.9% 33 2.2 98% 28 24 $9,604,100 400,171 $349,500 25 63.1% 84 2.8 97% 32 25 $10,844,700 433,788 $424,900 14 79.0% 42 1.9 97% 51 SUMMARY OF EXISTING HOME TRANSACTIONS ALL HOME TYPES, DECEMBER 2015 ALL TREB AREAS 3 1 1 1 2 5498 3
- 4. Toronto Real Estate Board Market Watch, December 2015 SUMMARY OF EXISTING HOME TRANSACTIONS ALL HOME TYPES, DECEMBER 2015 CITY OF TORONTO MUNICIPAL BREAKDOWN 4 Number of Sales Dollar Volume Average Price Median Price New Listings SNLR (Trend) Active Listings Mos. Inv. (Trend) Avg. SP / LP Avg. DOM TREB Total City of Toronto Total Toronto West Toronto W01 Toronto W02 Toronto W03 Toronto W04 Toronto W05 Toronto W06 Toronto W07 Toronto W08 Toronto W09 Toronto W10 Toronto Central Toronto C01 Toronto C02 Toronto C03 Toronto C04 Toronto C06 Toronto C07 Toronto C08 Toronto C09 Toronto C10 Toronto C11 Toronto C12 Toronto C13 Toronto C14 Toronto C15 Toronto East Toronto E01 Toronto E02 Toronto E03 Toronto E04 Toronto E05 Toronto E06 Toronto E07 Toronto E08 Toronto E09 Toronto E10 Toronto E11 4,945 $3,012,046,480 $609,110 $505,000 4,783 63.1% 9,137 1.8 99% 29 1,999 $1,253,258,040 $626,942 $480,000 2,029 57.7% 4,325 2.2 99% 31 535 $292,649,058 $547,008 $475,000 548 60.1% 1,066 2.1 99% 30 27 $17,585,300 $651,307 $467,000 30 54.9% 67 2.2 101% 31 40 $26,798,619 $669,965 $675,001 38 69.5% 44 1.3 100% 29 38 $19,058,100 $501,529 $505,000 41 65.5% 54 1.4 104% 20 53 $26,629,300 $502,440 $500,000 46 63.4% 90 1.8 99% 30 75 $31,556,818 $420,758 $442,000 96 63.0% 168 2.1 98% 28 90 $48,372,200 $537,469 $425,000 103 46.9% 260 3.4 98% 36 16 $13,584,000 $849,000 $800,000 15 60.5% 31 1.7 101% 23 113 $71,865,033 $635,974 $433,000 93 59.3% 217 2.2 98% 35 31 $15,582,800 $502,671 $540,000 24 69.7% 43 1.6 98% 27 52 $21,616,888 $415,709 $485,500 62 68.3% 92 1.7 98% 26 943 $685,942,882 $727,405 $452,500 987 52.7% 2,497 2.7 98% 35 291 $144,873,698 $497,848 $415,000 354 48.9% 911 3.2 99% 36 38 $40,876,725 $1,075,703 $802,500 47 47.3% 162 3.5 98% 44 22 $32,012,917 $1,455,133 $893,500 29 54.9% 76 2.4 95% 26 39 $57,076,300 $1,463,495 $1,335,800 31 58.9% 77 1.9 99% 25 24 $15,965,900 $665,246 $482,500 32 53.2% 69 2.7 102% 32 72 $60,534,768 $840,761 $595,500 72 55.4% 158 2.4 99% 41 102 $52,746,088 $517,119 $474,750 76 55.3% 215 2.5 98% 31 19 $26,769,962 $1,408,945 $942,000 16 60.6% 35 2.1 97% 28 19 $13,257,209 $697,748 $555,000 19 59.7% 48 1.9 102% 24 18 $10,760,700 $597,817 $393,150 24 63.6% 42 1.6 101% 19 22 $59,216,388 $2,691,654 $1,954,000 18 50.3% 100 3.7 95% 51 28 $16,140,503 $576,447 $485,000 33 65.6% 66 1.6 99% 30 120 $77,288,560 $644,071 $427,500 133 49.4% 324 2.9 99% 39 129 $78,423,164 $607,932 $410,000 103 52.8% 214 2.5 100% 31 521 $274,666,100 $527,190 $535,000 494 65.9% 762 1.3 101% 23 37 $25,417,110 $686,949 $650,000 33 66.6% 54 1.1 102% 20 40 $30,684,396 $767,110 $738,500 32 63.8% 46 1.2 101% 19 59 $36,887,138 $625,206 $663,000 52 68.8% 50 0.9 105% 15 69 $31,013,227 $449,467 $535,000 67 67.3% 92 1.3 100% 20 42 $20,903,500 $497,702 $415,000 47 67.1% 76 1.3 100% 22 19 $11,705,500 $616,079 $565,000 28 58.9% 34 1.5 100% 14 57 $25,870,576 $453,870 $308,800 57 61.6% 121 1.8 100% 36 35 $18,345,625 $524,161 $568,000 45 68.8% 63 1.4 99% 21 75 $32,989,940 $439,866 $405,000 54 66.3% 102 1.5 99% 27 31 $15,437,900 $497,997 $520,000 22 63.1% 50 1.5 98% 31 57 $25,411,188 $445,810 $416,000 57 69.2% 74 1.2 99% 26 1 1 1 2 8 3 9 4 5
- 5. Toronto Real Estate Board Market Watch, December 2015 SUMMARY OF EXISTING HOME TRANSACTIONS ALL HOME TYPES, YEAR-TO-DATE 2015 ALL TREB AREAS 5 Number of Sales Dollar Volume Average Price Median Price New Listings Avg. SP / LP Avg. DOM TREB Total Halton Region Burlington Halton Hills Milton Oakville Peel Region Brampton Caledon Mississauga City of Toronto Toronto West Toronto Central Toronto East York Region Aurora E. Gwillimbury Georgina King Markham Newmarket Richmond Hill Vaughan Whitchurch-Stouffville Durham Region Ajax Brock Clarington Oshawa Pickering Scugog Uxbridge Whitby Dufferin County Orangeville Simcoe County Adjala-Tosorontio Bradford West GwillimburyEssa Innisfil New Tecumseth 101,299 $63,029,986,321 $622,217 $521,270 160,520 100% 22 8,777 $5,860,297,711 $667,688 $581,000 12,705 98% 24 2,038 $1,215,419,961 $596,379 $545,750 2,736 98% 27 1,036 $575,619,191 $555,617 $509,950 1,470 98% 27 2,350 $1,282,619,851 $545,796 $518,000 3,212 99% 17 3,353 $2,786,638,708 $831,088 $720,000 5,287 98% 24 20,987 $11,067,325,841 $527,342 $482,000 32,786 99% 21 9,365 $4,574,774,359 $488,497 $465,000 14,087 99% 18 999 $684,741,374 $685,427 $605,000 1,631 97% 29 10,623 $5,807,810,108 $546,720 $495,000 17,068 99% 22 37,326 $24,607,919,966 $659,270 $517,500 64,731 101% 23 9,560 $5,431,570,736 $568,156 $510,000 15,899 101% 24 17,709 $13,564,415,619 $765,962 $495,000 33,576 100% 26 10,057 $5,611,933,611 $558,013 $550,000 15,256 103% 17 19,066 $14,828,974,695 $777,771 $695,500 29,877 100% 21 1,087 $811,679,297 $746,715 $659,900 1,505 100% 20 334 $208,389,983 $623,922 $550,750 523 97% 30 1,043 $428,584,301 $410,915 $390,000 1,539 98% 26 423 $425,834,722 $1,006,701 $860,000 800 96% 43 5,294 $4,252,971,372 $803,357 $740,000 8,728 102% 18 1,749 $1,081,753,528 $618,498 $587,000 2,225 100% 17 3,826 $3,392,792,424 $886,773 $795,000 6,214 101% 20 4,381 $3,493,309,719 $797,377 $720,000 6,928 99% 20 929 $733,659,349 $789,730 $678,000 1,415 98% 24 11,848 $5,237,789,828 $442,082 $415,000 15,975 100% 17 2,174 $1,067,509,206 $491,035 $468,900 2,843 101% 13 210 $69,918,335 $332,944 $280,000 384 96% 46 1,958 $767,733,842 $392,101 $365,000 2,567 100% 18 3,071 $1,074,226,724 $349,797 $334,900 3,983 100% 15 1,478 $783,950,651 $530,413 $489,225 2,119 101% 17 388 $184,347,397 $475,122 $430,000 627 97% 39 341 $202,163,377 $592,854 $542,000 558 98% 35 2,228 $1,087,940,296 $488,304 $460,000 2,894 101% 15 704 $277,303,453 $393,897 $372,750 806 99% 27 704 $277,303,453 $393,897 $372,750 806 99% 27 2,591 $1,150,374,827 $443,989 $415,000 3,640 98% 33 203 $104,317,407 $513,879 $486,000 307 97% 54 749 $394,077,420 $526,138 $508,500 1,011 98% 24 325 $121,705,074 $374,477 $330,000 452 98% 35 649 $265,680,268 $409,369 $378,000 1,028 98% 35 665 $264,594,658 $397,887 $374,900 842 98% 32 1 1 1 2 4 5
- 6. Toronto Real Estate Board Market Watch, December 2015 SUMMARY OF EXISTING HOME TRANSACTIONS ALL HOME TYPES, YEAR-TO-DATE 2015 CITY OF TORONTO MUNICIPAL BREAKDOWN 6 Number of Sales Dollar Volume Average Price Median Price New Listings Avg. SP / LP Avg. DOM TREB Total City of Toronto Total Toronto West Toronto W01 Toronto W02 Toronto W03 Toronto W04 Toronto W05 Toronto W06 Toronto W07 Toronto W08 Toronto W09 Toronto W10 Toronto Central Toronto C01 Toronto C02 Toronto C03 Toronto C04 Toronto C06 Toronto C07 Toronto C08 Toronto C09 Toronto C10 Toronto C11 Toronto C12 Toronto C13 Toronto C14 Toronto C15 Toronto East Toronto E01 Toronto E02 Toronto E03 Toronto E04 Toronto E05 Toronto E06 Toronto E07 Toronto E08 Toronto E09 Toronto E10 Toronto E11 101,299 $63,029,986,321 $622,217 $521,270 160,520 100% 22 37,326 $24,607,919,966 $659,270 $517,500 64,731 101% 23 9,560 $5,431,570,736 $568,156 $510,000 15,899 101% 24 658 $461,629,188 $701,564 $548,950 1,199 103% 22 901 $630,944,194 $700,271 $675,000 1,297 104% 17 732 $384,510,271 $525,287 $525,000 1,117 102% 19 845 $422,824,142 $500,384 $502,000 1,332 100% 23 1,269 $551,008,895 $434,207 $470,000 2,014 99% 27 1,366 $710,482,902 $520,119 $467,500 2,915 100% 29 302 $263,212,818 $871,566 $817,500 499 102% 19 1,973 $1,333,453,768 $675,851 $527,000 3,325 99% 25 546 $304,102,602 $556,964 $592,000 783 100% 23 968 $369,401,956 $381,614 $425,000 1,418 99% 25 17,709 $13,564,415,619 $765,962 $495,000 33,576 100% 26 5,107 $2,602,555,822 $509,606 $418,500 10,440 99% 30 804 $978,525,747 $1,217,072 $945,000 1,701 100% 29 533 $643,179,974 $1,206,717 $810,000 970 100% 20 986 $1,425,200,566 $1,445,437 $1,360,225 1,674 101% 20 396 $287,787,128 $726,735 $786,500 745 101% 25 1,392 $1,022,333,188 $734,435 $494,500 2,511 100% 26 1,857 $916,225,736 $493,390 $420,000 3,357 99% 26 358 $586,238,177 $1,637,537 $1,371,500 591 99% 22 641 $513,688,683 $801,386 $633,000 1,073 103% 20 440 $307,675,846 $699,263 $370,850 692 102% 21 451 $1,001,539,152 $2,220,708 $1,831,000 896 97% 29 888 $694,496,881 $782,091 $610,000 1,354 104% 20 2,075 $1,462,823,175 $704,975 $440,000 4,200 99% 29 1,781 $1,122,145,544 $630,065 $455,000 3,372 102% 25 10,057 $5,611,933,611 $558,013 $550,000 15,256 103% 17 886 $647,278,561 $730,563 $705,000 1,331 107% 13 758 $643,947,221 $849,535 $755,000 1,188 103% 13 1,087 $749,517,788 $689,529 $670,000 1,581 105% 12 1,216 $569,077,360 $467,991 $525,000 1,807 102% 17 1,029 $539,984,254 $524,766 $450,000 1,534 103% 18 401 $262,743,636 $655,221 $580,000 681 101% 16 1,026 $494,162,701 $481,640 $438,000 1,666 103% 22 685 $357,959,644 $522,569 $535,000 996 100% 20 1,367 $567,227,882 $414,944 $367,500 2,061 101% 21 686 $382,491,435 $557,568 $558,039 1,088 101% 18 916 $397,543,129 $433,999 $430,500 1,323 102% 18 1 1 1 2 4 5
- 7. Toronto Real Estate Board Market Watch, December 2015 SUMMARY OF EXISTING HOME TRANSACTIONS DETACHED HOUSES, DECEMBER 2015 ALL TREB AREAS 7 Sales Dollar Volume Average Price Median Price New Listings Active Listings Avg. SP / LP Avg. DOM TREB Total Halton Region Burlington Halton Hills Milton Oakville Peel Region Brampton Caledon Mississauga City of Toronto Toronto West Toronto Central Toronto East York Region Aurora E. Gwillimbury Georgina King Markham Newmarket Richmond Hill Vaughan Whitchurch-Stouffville Durham Region Ajax Brock Clarington Oshawa Pickering Scugog Uxbridge Whitby Dufferin County Orangeville Simcoe County Adjala-Tosorontio Bradford West GwillimburyEssa Innisfil New Tecumseth 2,134 $1,761,551,941 $825,470 $670,000 1,980 3,644 98% 28 206 $165,788,488 $804,798 $700,250 164 472 97% 34 49 $33,700,900 $687,773 $635,000 36 107 97% 32 35 $22,395,900 $639,883 $595,000 28 77 98% 39 44 $27,825,500 $632,398 $588,500 40 101 99% 24 78 $81,866,188 $1,049,567 $873,250 60 187 97% 39 431 $305,067,543 $707,813 $633,000 461 759 97% 28 228 $129,966,669 $570,029 $558,500 275 339 98% 23 45 $37,896,900 $842,153 $690,000 29 113 96% 44 158 $137,203,974 $868,380 $723,000 157 307 97% 32 571 $593,633,494 $1,039,638 $765,000 514 843 99% 26 195 $157,708,351 $808,761 $681,000 183 312 99% 27 163 $288,280,079 $1,768,589 $1,350,000 138 276 98% 32 213 $147,645,064 $693,169 $646,600 193 255 101% 21 464 $462,657,069 $997,106 $870,550 405 858 98% 30 28 $27,149,788 $969,635 $804,000 20 51 97% 32 12 $9,923,299 $826,942 $717,500 10 42 96% 51 50 $20,694,000 $413,880 $379,950 42 94 98% 39 13 $14,930,000 $1,148,462 $920,000 20 70 95% 39 105 $118,643,656 $1,129,940 $960,000 82 141 99% 25 50 $37,622,500 $752,450 $687,500 40 37 98% 25 87 $110,577,676 $1,271,008 $1,090,000 77 147 99% 27 88 $95,716,550 $1,087,688 $936,250 80 173 98% 24 31 $27,399,600 $883,858 $780,000 34 103 96% 45 361 $183,688,640 $508,833 $480,000 344 475 99% 24 69 $39,881,812 $577,997 $565,000 58 46 99% 15 7 $2,771,400 $395,914 $274,900 23 58 95% 61 55 $27,309,980 $496,545 $443,000 49 75 99% 27 116 $46,109,680 $397,497 $378,000 103 104 99% 18 32 $20,784,574 $649,518 $558,500 34 59 100% 23 12 $5,399,300 $449,942 $426,000 14 40 97% 29 10 $8,759,672 $875,967 $702,200 14 42 92% 70 60 $32,672,222 $544,537 $496,500 49 51 99% 29 17 $8,443,400 $496,671 $480,000 19 21 97% 27 17 $8,443,400 $496,671 $480,000 19 21 97% 27 84 $42,273,307 $503,254 $485,000 73 216 98% 38 13 $7,065,707 $543,516 $527,000 12 40 99% 57 30 $16,784,300 $559,477 $550,000 23 36 98% 25 4 $1,549,500 $387,375 $382,500 7 30 98% 26 20 $8,336,000 $416,800 $414,500 21 81 97% 35 17 $8,537,800 $502,224 $451,500 10 29 97% 55 1 2 3 4 51 1 1
- 8. Toronto Real Estate Board Market Watch, December 2015 SUMMARY OF EXISTING HOME TRANSACTIONS DETACHED HOUSES, DECEMBER 2015 CITY OF TORONTO MUNICIPAL BREAKDOWN 8 Sales Dollar Volume Average Price Median Price New Listings Active Listings Avg. SP / LP Avg. DOM TREB Total City of Toronto Total Toronto West Toronto W01 Toronto W02 Toronto W03 Toronto W04 Toronto W05 Toronto W06 Toronto W07 Toronto W08 Toronto W09 Toronto W10 Toronto Central Toronto C01 Toronto C02 Toronto C03 Toronto C04 Toronto C06 Toronto C07 Toronto C08 Toronto C09 Toronto C10 Toronto C11 Toronto C12 Toronto C13 Toronto C14 Toronto C15 Toronto East Toronto E01 Toronto E02 Toronto E03 Toronto E04 Toronto E05 Toronto E06 Toronto E07 Toronto E08 Toronto E09 Toronto E10 Toronto E11 2,134 $1,761,551,941 $825,470 $670,000 1,980 3,644 98% 28 571 $593,633,494 $1,039,638 $765,000 514 843 99% 26 195 $157,708,351 $808,761 $681,000 183 312 99% 27 5 $7,190,000 $1,438,000 $1,490,000 10 9 101% 12 10 $9,098,390 $909,839 $854,444 13 13 102% 17 16 $9,338,100 $583,631 $561,550 21 31 106% 13 28 $18,187,400 $649,550 $610,500 28 57 99% 36 18 $11,966,018 $664,779 $655,000 25 38 100% 18 21 $17,131,600 $815,790 $670,000 18 33 98% 26 12 $11,131,000 $927,583 $865,000 12 18 102% 24 45 $48,495,955 $1,077,688 $890,000 25 69 98% 40 13 $9,843,000 $757,154 $770,000 7 14 98% 23 27 $15,326,888 $567,663 $550,000 24 30 99% 22 163 $288,280,079 $1,768,589 $1,350,000 138 276 98% 32 4 $4,133,000 $1,033,250 $1,107,500 7 9 103% 22 2 $1,583,000 $791,500 $791,500 6 10 120% 10 14 $26,788,917 $1,913,494 $1,218,000 16 29 93% 27 28 $51,726,800 $1,847,386 $1,774,500 15 44 98% 29 11 $11,056,900 $1,005,173 $925,000 13 11 105% 28 29 $40,976,798 $1,412,993 $1,290,000 8 19 100% 39 2 $2,080,000 $1,040,000 $1,040,000 0 3 95% 54 6 $17,511,000 $2,918,500 $3,130,000 5 11 96% 52 1 $1,290,000 $1,290,000 $1,290,000 3 5 129% 5 4 $5,811,000 $1,452,750 $1,522,500 3 4 101% 6 14 $51,056,888 $3,646,921 $3,297,500 11 61 95% 51 7 $7,312,000 $1,044,571 $962,000 5 9 99% 39 19 $33,348,700 $1,755,195 $1,630,000 31 50 101% 31 22 $33,605,076 $1,527,503 $1,379,400 15 11 101% 25 213 $147,645,064 $693,169 $646,600 193 255 101% 21 7 $5,833,500 $833,357 $791,700 6 8 100% 35 14 $13,182,596 $941,614 $838,500 12 14 102% 16 30 $22,137,888 $737,930 $735,000 29 31 103% 17 33 $20,611,527 $624,592 $600,000 31 28 102% 14 10 $7,954,300 $795,430 $827,900 9 15 102% 20 15 $9,627,600 $641,840 $565,000 21 23 100% 12 10 $8,636,988 $863,699 $782,500 14 29 100% 42 18 $13,490,625 $749,479 $660,125 22 34 99% 17 36 $22,078,640 $613,296 $602,500 20 22 100% 21 17 $10,625,000 $625,000 $590,000 14 35 98% 32 23 $13,466,400 $585,496 $567,000 15 16 99% 30 1 1 1 1 2 3 4 5
- 9. Toronto Real Estate Board Market Watch, December 2015 SUMMARY OF EXISTING HOME TRANSACTIONS SEMI-DETACHED HOUSES, DECEMBER 2015 ALL TREB AREAS 9 Sales Dollar Volume Average Price Median Price New Listings Active Listings Avg. SP / LP Avg. DOM TREB Total Halton Region Burlington Halton Hills Milton Oakville Peel Region Brampton Caledon Mississauga City of Toronto Toronto West Toronto Central Toronto East York Region Aurora E. Gwillimbury Georgina King Markham Newmarket Richmond Hill Vaughan Whitchurch-Stouffville Durham Region Ajax Brock Clarington Oshawa Pickering Scugog Uxbridge Whitby Dufferin County Orangeville Simcoe County Adjala-Tosorontio Bradford West GwillimburyEssa Innisfil New Tecumseth 477 $275,591,576 $577,760 $534,000 392 391 101% 18 22 $11,356,100 $516,186 $519,500 19 17 100% 12 6 $3,020,900 $503,483 $525,950 4 6 99% 15 3 $1,471,000 $490,333 $480,000 3 1 101% 19 10 $5,260,500 $526,050 $522,000 7 3 100% 9 3 $1,603,700 $534,567 $550,000 5 7 102% 9 178 $88,125,577 $495,088 $482,250 162 171 99% 20 100 $45,426,192 $454,262 $446,500 97 95 99% 21 6 $2,922,000 $487,000 $503,500 3 2 100% 12 72 $39,777,385 $552,464 $546,000 62 74 100% 19 158 $117,510,665 $743,738 $692,500 130 146 103% 20 46 $28,772,829 $625,496 $566,250 47 60 100% 22 47 $44,662,035 $950,256 $805,000 35 42 103% 22 65 $44,075,801 $678,089 $650,000 48 44 103% 17 62 $38,452,805 $620,207 $619,975 41 32 101% 18 6 $3,274,838 $545,806 $556,444 3 0 105% 14 0 - - - 0 0 - - 0 - - - 2 3 - - 0 - - - 0 0 - - 16 $10,864,388 $679,024 $657,250 11 8 103% 16 12 $6,101,191 $508,433 $533,000 5 4 99% 17 9 $6,016,388 $668,488 $670,000 6 6 102% 18 16 $10,569,500 $660,594 $652,000 10 10 99% 23 3 $1,626,500 $542,167 $549,000 4 1 100% 14 49 $17,404,629 $355,197 $325,000 37 20 101% 13 12 $5,631,300 $469,275 $484,500 7 4 102% 16 0 - - - 0 0 - - 4 $1,294,900 $323,725 $307,500 1 0 103% 18 25 $7,327,529 $293,101 $290,000 17 10 101% 14 5 $2,140,500 $428,100 $425,000 7 4 102% 6 1 $285,500 $285,500 $285,500 1 0 95% 5 0 - - - 1 1 - - 2 $724,900 $362,450 $362,450 3 1 101% 3 6 $1,859,900 $309,983 $307,450 2 3 98% 19 6 $1,859,900 $309,983 $307,450 2 3 98% 19 2 $881,900 $440,950 $440,950 1 2 100% 7 0 - - - 0 0 - - 1 $457,000 $457,000 $457,000 1 0 99% 6 0 - - - 0 0 - - 0 - - - 0 0 - - 1 $424,900 $424,900 $424,900 0 2 101% 8 1 1 1 1 2 3 4 5
- 10. Toronto Real Estate Board Market Watch, December 2015 SUMMARY OF EXISTING HOME TRANSACTIONS SEMI-DETACHED HOUSES, DECEMBER 2015 CITY OF TORONTO MUNICIPAL BREAKDOWN 10 Sales Dollar Volume Average Price Median Price New Listings Active Listings Avg. SP / LP Avg. DOM TREB Total City of Toronto Total Toronto West Toronto W01 Toronto W02 Toronto W03 Toronto W04 Toronto W05 Toronto W06 Toronto W07 Toronto W08 Toronto W09 Toronto W10 Toronto Central Toronto C01 Toronto C02 Toronto C03 Toronto C04 Toronto C06 Toronto C07 Toronto C08 Toronto C09 Toronto C10 Toronto C11 Toronto C12 Toronto C13 Toronto C14 Toronto C15 Toronto East Toronto E01 Toronto E02 Toronto E03 Toronto E04 Toronto E05 Toronto E06 Toronto E07 Toronto E08 Toronto E09 Toronto E10 Toronto E11 477 $275,591,576 $577,760 $534,000 392 391 101% 18 158 $117,510,665 $743,738 $692,500 130 146 103% 20 46 $28,772,829 $625,496 $566,250 47 60 100% 22 1 $777,000 $777,000 $777,000 0 2 111% 3 11 $7,952,879 $722,989 $707,777 8 2 102% 19 9 $5,502,000 $611,333 $555,000 15 21 104% 13 3 $1,833,500 $611,167 $560,000 2 3 98% 19 16 $8,589,250 $536,828 $520,000 18 22 97% 26 2 $1,580,000 $790,000 $790,000 1 2 99% 14 0 - - - 0 0 - - 1 $1,050,000 $1,050,000 $1,050,000 0 1 96% 50 1 $470,000 $470,000 $470,000 0 3 98% 39 2 $1,018,200 $509,100 $509,100 3 4 99% 32 47 $44,662,035 $950,256 $805,000 35 42 103% 22 9 $9,894,260 $1,099,362 $1,065,000 7 12 110% 22 9 $11,818,425 $1,313,158 $909,000 2 5 98% 41 4 $2,728,000 $682,000 $679,000 5 5 110% 9 2 $1,855,000 $927,500 $927,500 1 0 111% 9 0 - - - 1 1 - - 3 $2,095,000 $698,333 $705,000 2 0 99% 18 3 $3,110,000 $1,036,667 $850,000 3 4 100% 33 0 - - - 0 1 - - 4 $4,039,059 $1,009,765 $915,030 1 0 103% 6 1 $935,000 $935,000 $935,000 1 0 119% 2 1 $707,500 $707,500 $707,500 1 0 98% 8 3 $1,911,903 $637,301 $620,000 5 6 106% 21 0 - - - 0 0 - - 8 $5,567,888 $695,986 $689,000 6 8 101% 19 65 $44,075,801 $678,089 $650,000 48 44 103% 17 15 $12,243,751 $816,250 $785,000 9 16 103% 18 14 $10,361,900 $740,136 $772,500 9 8 102% 16 12 $8,574,150 $714,513 $694,250 12 6 113% 7 3 $1,294,000 $431,333 $435,000 4 5 97% 10 3 $2,102,500 $700,833 $774,500 2 2 96% 33 2 $1,129,000 $564,500 $564,500 0 0 107% 5 7 $4,231,000 $604,429 $578,000 5 3 99% 34 0 - - - 1 1 - - 1 $507,500 $507,500 $507,500 0 0 97% 36 3 $1,330,000 $443,333 $440,000 2 0 100% 23 5 $2,302,000 $460,400 $415,000 4 3 99% 9 1 1 1 1 2 3 4 5
- 11. Toronto Real Estate Board Market Watch, December 2015 SUMMARY OF EXISTING HOME TRANSACTIONS CONDOMINIUM TOWNHOUSES, DECEMBER 2015 ALL TREB AREAS 11 Sales Dollar Volume Average Price Median Price New Listings Active Listings Avg. SP / LP Avg. DOM TREB Total Halton Region Burlington Halton Hills Milton Oakville Peel Region Brampton Caledon Mississauga City of Toronto Toronto West Toronto Central Toronto East York Region Aurora E. Gwillimbury Georgina King Markham Newmarket Richmond Hill Vaughan Whitchurch-Stouffville Durham Region Ajax Brock Clarington Oshawa Pickering Scugog Uxbridge Whitby Dufferin County Orangeville Simcoe County Adjala-Tosorontio Bradford West GwillimburyEssa Innisfil New Tecumseth 414 $173,280,665 $418,552 $380,000 353 535 99% 26 38 $14,663,800 $385,889 $345,500 24 37 98% 27 15 $6,122,400 $408,160 $367,000 11 12 98% 25 7 $1,823,500 $260,500 $240,000 4 1 99% 20 3 $1,020,500 $340,167 $327,000 1 3 98% 19 13 $5,697,400 $438,262 $353,000 8 21 98% 36 137 $52,679,237 $384,520 $370,000 113 152 99% 27 43 $14,266,400 $331,777 $334,500 28 37 99% 24 1 $390,000 $390,000 $390,000 1 1 98% 96 93 $38,022,837 $408,848 $398,900 84 114 98% 27 156 $74,509,938 $477,628 $413,500 148 254 99% 27 52 $20,551,450 $395,220 $358,500 48 78 98% 32 55 $34,130,800 $620,560 $494,000 49 91 99% 27 49 $19,827,688 $404,647 $402,800 51 85 100% 24 44 $20,970,590 $476,604 $460,500 32 48 99% 25 3 $1,203,000 $401,000 $480,000 1 4 98% 71 0 - - - 0 0 - - 0 - - - 0 0 - - 0 - - - 0 0 - - 15 $7,527,700 $501,847 $417,700 20 25 100% 15 8 $3,305,300 $413,163 $398,500 1 2 99% 16 8 $4,316,000 $539,500 $571,000 3 3 99% 38 10 $4,618,590 $461,859 $460,500 7 14 98% 24 0 - - - 0 0 - - 37 $10,027,100 $271,003 $289,000 35 43 100% 19 4 $1,346,500 $336,625 $332,250 7 8 100% 25 0 - - - 0 1 - - 5 $1,125,500 $225,100 $223,000 3 3 98% 17 10 $1,788,500 $178,850 $158,000 8 10 100% 23 10 $3,386,500 $338,650 $334,750 9 10 101% 14 0 - - - 0 1 - - 0 - - - 1 4 - - 8 $2,380,100 $297,513 $298,500 7 6 98% 19 0 - - - 0 0 - - 0 - - - 0 0 - - 2 $430,000 $215,000 $215,000 1 1 96% 45 0 - - - 0 0 - - 0 - - - 0 0 - - 0 - - - 0 0 - - 0 - - - 0 0 - - 2 $430,000 $215,000 $215,000 1 1 96% 45 1 1 1 1 2 3 4 5
- 12. Toronto Real Estate Board Market Watch, December 2015 SUMMARY OF EXISTING HOME TRANSACTIONS CONDOMINIUM TOWNHOUSES, DECEMBER 2015 CITY OF TORONTO MUNICIPAL BREAKDOWN 12 Sales Dollar Volume Average Price Median Price New Listings Active Listings Avg. SP / LP Avg. DOM TREB Total City of Toronto Total Toronto West Toronto W01 Toronto W02 Toronto W03 Toronto W04 Toronto W05 Toronto W06 Toronto W07 Toronto W08 Toronto W09 Toronto W10 Toronto Central Toronto C01 Toronto C02 Toronto C03 Toronto C04 Toronto C06 Toronto C07 Toronto C08 Toronto C09 Toronto C10 Toronto C11 Toronto C12 Toronto C13 Toronto C14 Toronto C15 Toronto East Toronto E01 Toronto E02 Toronto E03 Toronto E04 Toronto E05 Toronto E06 Toronto E07 Toronto E08 Toronto E09 Toronto E10 Toronto E11 414 $173,280,665 $418,552 $380,000 353 535 99% 26 156 $74,509,938 $477,628 $413,500 148 254 99% 27 52 $20,551,450 $395,220 $358,500 48 78 98% 32 4 $2,270,900 $567,725 $500,500 3 3 100% 35 7 $4,440,150 $634,307 $470,000 7 9 99% 51 2 $761,000 $380,500 $380,500 2 1 100% 33 6 $2,190,900 $365,150 $366,500 7 6 99% 14 14 $4,187,500 $299,107 $313,850 14 29 97% 31 1 $525,000 $525,000 $525,000 3 14 94% 33 0 - - - 0 0 - - 8 $3,153,000 $394,125 $426,500 2 4 99% 26 2 $1,042,000 $521,000 $521,000 1 0 100% 6 8 $1,981,000 $247,625 $231,500 9 12 94% 41 55 $34,130,800 $620,560 $494,000 49 91 99% 27 15 $9,424,900 $628,327 $467,500 13 19 99% 26 3 $3,200,000 $1,066,667 $925,000 1 5 97% 33 0 - - - 0 3 - - 1 $887,000 $887,000 $887,000 1 2 111% 9 0 - - - 1 2 - - 2 $822,000 $411,000 $411,000 7 17 98% 24 2 $1,132,200 $566,100 $566,100 3 3 102% 16 1 $1,250,200 $1,250,200 $1,250,200 0 0 96% 44 1 $513,500 $513,500 $513,500 2 3 96% 43 1 $247,000 $247,000 $247,000 1 3 100% 42 4 $4,358,000 $1,089,500 $1,119,000 3 12 97% 62 0 - - - 1 0 - - 5 $2,971,000 $594,200 $636,000 2 8 98% 21 20 $9,325,000 $466,250 $427,500 14 14 98% 20 49 $19,827,688 $404,647 $402,800 51 85 100% 24 2 $1,101,500 $550,750 $550,750 2 4 101% 30 3 $1,781,900 $593,967 $547,000 3 8 100% 16 0 - - - 0 0 - - 5 $1,869,900 $373,980 $333,000 3 5 98% 20 10 $4,159,300 $415,930 $415,000 11 16 100% 26 1 $699,900 $699,900 $699,900 1 2 100% 7 7 $3,390,100 $484,300 $475,300 3 5 105% 21 1 $355,000 $355,000 $355,000 3 8 100% 11 5 $1,525,300 $305,060 $334,000 5 9 96% 45 5 $1,440,000 $288,000 $315,000 2 5 98% 26 10 $3,504,788 $350,479 $327,450 18 23 100% 19 1 1 1 1 2 3 4 5
- 13. Toronto Real Estate Board Market Watch, December 2015 SUMMARY OF EXISTING HOME TRANSACTIONS CONDOMINIUM APARTMENT, DECEMBER 2015 ALL TREB AREAS 13 Sales Dollar Volume Average Price Median Price New Listings Active Listings Avg. SP / LP Avg. DOM TREB Total Halton Region Burlington Halton Hills Milton Oakville Peel Region Brampton Caledon Mississauga City of Toronto Toronto West Toronto Central Toronto East York Region Aurora E. Gwillimbury Georgina King Markham Newmarket Richmond Hill Vaughan Whitchurch-Stouffville Durham Region Ajax Brock Clarington Oshawa Pickering Scugog Uxbridge Whitby Dufferin County Orangeville Simcoe County Adjala-Tosorontio Bradford West GwillimburyEssa Innisfil New Tecumseth 1,464 $553,756,564 $378,249 $330,000 1,700 4,216 98% 36 38 $18,248,900 $480,234 $351,000 49 146 97% 41 16 $5,594,900 $349,681 $329,500 12 26 97% 43 1 $210,000 $210,000 $210,000 3 4 96% 49 3 $1,076,000 $358,667 $338,000 10 15 97% 26 18 $11,368,000 $631,556 $550,500 24 101 96% 41 213 $59,012,604 $277,054 $265,000 219 512 97% 34 37 $9,030,188 $244,059 $225,000 39 63 98% 34 1 $472,500 $472,500 $472,500 1 0 95% 21 175 $49,509,916 $282,914 $268,500 179 449 97% 35 1,038 $415,291,143 $400,088 $348,500 1,168 2,976 98% 36 223 $73,122,128 $327,902 $310,000 251 591 97% 36 654 $298,091,768 $455,798 $390,000 742 2,037 98% 37 161 $44,077,247 $273,772 $262,000 175 348 98% 28 146 $54,029,017 $370,062 $330,750 228 527 98% 41 1 $318,000 $318,000 $318,000 5 7 97% 33 0 - - - 0 0 - - 0 - - - 0 1 - - 3 $1,049,000 $349,667 $319,000 0 8 96% 134 49 $16,711,529 $341,052 $320,000 90 217 98% 43 2 $669,900 $334,950 $334,950 1 3 98% 38 37 $12,055,738 $325,831 $298,000 46 127 97% 40 52 $22,015,850 $423,382 $347,500 80 158 98% 35 2 $1,209,000 $604,500 $604,500 6 6 94% 57 28 $6,971,900 $248,996 $243,200 34 46 99% 16 7 $1,663,500 $237,643 $245,000 5 9 99% 20 0 - - - 0 0 - - 5 $1,114,500 $222,900 $221,000 5 6 100% 12 6 $1,156,000 $192,667 $181,500 8 5 100% 15 6 $1,599,900 $266,650 $244,450 13 23 99% 19 0 - - - 0 0 - - 0 - - - 2 2 - - 4 $1,438,000 $359,500 $349,000 1 1 98% 11 0 - - - 0 0 - - 0 - - - 0 0 - - 1 $203,000 $203,000 $203,000 2 9 98% 89 0 - - - 0 0 - - 0 - - - 1 1 - - 0 - - - 0 0 - - 0 - - - 0 1 - - 1 $203,000 $203,000 $203,000 1 7 98% 89 1 1 1 1 2 3 4 5
- 14. Toronto Real Estate Board Market Watch, December 2015 SUMMARY OF EXISTING HOME TRANSACTIONS CONDOMINIUM APARTMENT, DECEMBER 2015 CITY OF TORONTO MUNICIPAL BREAKDOWN 14 Sales Dollar Volume Average Price Median Price New Listings Active Listings Avg. SP / LP Avg. DOM TREB Total City of Toronto Total Toronto West Toronto W01 Toronto W02 Toronto W03 Toronto W04 Toronto W05 Toronto W06 Toronto W07 Toronto W08 Toronto W09 Toronto W10 Toronto Central Toronto C01 Toronto C02 Toronto C03 Toronto C04 Toronto C06 Toronto C07 Toronto C08 Toronto C09 Toronto C10 Toronto C11 Toronto C12 Toronto C13 Toronto C14 Toronto C15 Toronto East Toronto E01 Toronto E02 Toronto E03 Toronto E04 Toronto E05 Toronto E06 Toronto E07 Toronto E08 Toronto E09 Toronto E10 Toronto E11 1,464 $553,756,564 $378,249 $330,000 1,700 4,216 98% 36 1,038 $415,291,143 $400,088 $348,500 1,168 2,976 98% 36 223 $73,122,128 $327,902 $310,000 251 591 97% 36 16 $6,527,400 $407,963 $330,500 15 48 98% 39 10 $3,677,200 $367,720 $342,450 8 19 97% 39 10 $2,987,000 $298,700 $286,250 3 1 97% 35 15 $3,897,500 $259,833 $256,500 9 24 96% 28 25 $5,861,650 $234,466 $218,000 36 76 96% 36 59 $24,523,700 $415,656 $365,000 73 207 97% 43 1 $298,000 $298,000 $298,000 2 9 99% 20 58 $18,411,078 $317,432 $309,000 65 138 98% 32 14 $3,647,800 $260,557 $249,000 16 26 96% 33 15 $3,290,800 $219,387 $230,000 24 43 95% 27 654 $298,091,768 $455,798 $390,000 742 2,037 98% 37 257 $116,536,638 $453,450 $400,000 322 860 98% 38 20 $20,082,300 $1,004,115 $732,500 34 136 96% 55 4 $2,496,000 $624,000 $599,000 8 33 99% 37 8 $2,607,500 $325,938 $302,500 13 27 99% 18 13 $4,909,000 $377,615 $385,000 17 54 97% 35 38 $16,640,970 $437,920 $412,750 54 120 97% 46 93 $44,954,888 $483,386 $405,000 68 200 98% 31 8 $4,290,762 $536,345 $503,000 7 19 98% 16 12 $6,382,150 $531,846 $481,500 13 36 99% 29 12 $3,767,700 $313,975 $264,000 17 34 98% 22 3 $3,094,000 $1,031,333 $773,000 3 27 97% 52 16 $5,294,600 $330,913 $309,950 20 48 98% 30 94 $39,372,860 $418,860 $389,000 99 263 97% 41 76 $27,662,400 $363,979 $342,900 67 180 97% 38 161 $44,077,247 $273,772 $262,000 175 348 98% 28 10 $4,059,459 $405,946 $426,500 13 24 102% 12 8 $4,714,500 $589,313 $499,000 7 16 97% 33 13 $3,007,100 $231,315 $196,500 9 12 98% 19 24 $5,040,800 $210,033 $202,500 25 49 97% 27 16 $4,737,400 $296,088 $295,250 23 41 99% 21 1 $249,000 $249,000 $249,000 6 9 94% 72 30 $7,792,488 $259,750 $274,500 31 78 98% 36 13 $2,934,000 $225,692 $201,000 15 16 97% 27 33 $8,878,500 $269,045 $272,000 29 70 97% 30 3 $577,900 $192,633 $183,000 4 10 96% 30 10 $2,086,100 $208,610 $240,000 13 23 97% 38 1 1 1 1 2 3 4 5
- 15. Toronto Real Estate Board Market Watch, December 2015 SUMMARY OF EXISTING HOME TRANSACTIONS LINK, DECEMBER 2015 ALL TREB AREAS 15 Sales Dollar Volume Average Price Median Price New Listings Active Listings Avg. SP / LP Avg. DOM TREB Total Halton Region Burlington Halton Hills Milton Oakville Peel Region Brampton Caledon Mississauga City of Toronto Toronto West Toronto Central Toronto East York Region Aurora E. Gwillimbury Georgina King Markham Newmarket Richmond Hill Vaughan Whitchurch-Stouffville Durham Region Ajax Brock Clarington Oshawa Pickering Scugog Uxbridge Whitby Dufferin County Orangeville Simcoe County Adjala-Tosorontio Bradford West GwillimburyEssa Innisfil New Tecumseth 70 $40,160,944 $573,728 $604,000 59 39 101% 16 3 $1,460,000 $486,667 $510,000 4 2 101% 5 2 $900,000 $450,000 $450,000 3 2 102% 5 0 - - - 0 0 - - 0 - - - 0 0 - - 1 $560,000 $560,000 $560,000 1 0 98% 5 5 $2,706,000 $541,200 $525,000 6 6 101% 25 1 $439,000 $439,000 $439,000 0 1 98% 76 0 - - - 0 0 - - 4 $2,267,000 $566,750 $562,500 6 5 101% 12 12 $7,765,800 $647,150 $637,500 7 6 102% 23 1 $580,000 $580,000 $580,000 0 1 98% 29 3 $2,262,800 $754,267 $742,000 1 0 100% 8 8 $4,923,000 $615,375 $627,500 6 5 104% 28 27 $19,284,600 $714,244 $695,000 22 20 99% 18 0 - - - 0 1 - - 0 - - - 0 0 - - 0 - - - 0 0 - - 1 $554,000 $554,000 $554,000 0 0 96% 25 17 $12,260,600 $721,212 $720,000 16 14 99% 18 0 - - - 0 0 - - 8 $5,647,000 $705,875 $695,000 5 4 99% 19 1 $823,000 $823,000 $823,000 1 1 99% 16 0 - - - 0 0 - - 20 $7,829,644 $391,482 $370,000 20 3 103% 7 3 $1,101,000 $367,000 $335,000 4 1 103% 5 0 - - - 0 0 - - 7 $2,635,000 $376,429 $365,000 8 2 105% 5 3 $1,066,000 $355,333 $350,000 2 0 103% 6 1 $450,000 $450,000 $450,000 1 0 99% 15 0 - - - 0 0 - - 0 - - - 0 0 - - 6 $2,577,644 $429,607 $445,322 5 0 102% 10 0 - - - 0 0 - - 0 - - - 0 0 - - 3 $1,114,900 $371,633 $370,000 0 2 98% 27 0 - - - 0 0 - - 3 $1,114,900 $371,633 $370,000 0 0 98% 27 0 - - - 0 2 - - 0 - - - 0 0 - - 0 - - - 0 0 - - 1 1 1 1 2 3 4 5
- 16. Toronto Real Estate Board Market Watch, December 2015 SUMMARY OF EXISTING HOME TRANSACTIONS LINK, DECEMBER 2015 CITY OF TORONTO MUNICIPAL BREAKDOWN 16 Sales Dollar Volume Average Price Median Price New Listings Active Listings Avg. SP / LP Avg. DOM TREB Total City of Toronto Total Toronto West Toronto W01 Toronto W02 Toronto W03 Toronto W04 Toronto W05 Toronto W06 Toronto W07 Toronto W08 Toronto W09 Toronto W10 Toronto Central Toronto C01 Toronto C02 Toronto C03 Toronto C04 Toronto C06 Toronto C07 Toronto C08 Toronto C09 Toronto C10 Toronto C11 Toronto C12 Toronto C13 Toronto C14 Toronto C15 Toronto East Toronto E01 Toronto E02 Toronto E03 Toronto E04 Toronto E05 Toronto E06 Toronto E07 Toronto E08 Toronto E09 Toronto E10 Toronto E11 70 $40,160,944 $573,728 $604,000 59 39 101% 16 12 $7,765,800 $647,150 $637,500 7 6 102% 23 1 $580,000 $580,000 $580,000 0 1 98% 29 0 - - - 0 0 - - 0 - - - 0 0 - - 0 - - - 0 0 - - 0 - - - 0 0 - - 0 - - - 0 0 - - 0 - - - 0 0 - - 0 - - - 0 0 - - 0 - - - 0 0 - - 1 $580,000 $580,000 $580,000 0 0 98% 29 0 - - - 0 1 - - 3 $2,262,800 $754,267 $742,000 1 0 100% 8 0 - - - 0 0 - - 0 - - - 0 0 - - 0 - - - 0 0 - - 0 - - - 0 0 - - 0 - - - 0 0 - - 0 - - - 0 0 - - 0 - - - 0 0 - - 0 - - - 0 0 - - 0 - - - 0 0 - - 0 - - - 0 0 - - 0 - - - 0 0 - - 0 - - - 0 0 - - 0 - - - 0 0 - - 3 $2,262,800 $754,267 $742,000 1 0 100% 8 8 $4,923,000 $615,375 $627,500 6 5 104% 28 0 - - - 0 0 - - 0 - - - 0 0 - - 0 - - - 0 0 - - 0 - - - 0 0 - - 3 $1,950,000 $650,000 $645,000 1 1 102% 7 0 - - - 0 0 - - 3 $1,820,000 $606,667 $625,000 3 1 105% 59 0 - - - 0 0 - - 0 - - - 0 0 - - 0 - - - 0 0 - - 2 $1,153,000 $576,500 $576,500 2 3 107% 14 1 1 1 1 2 3 4 5
- 17. Toronto Real Estate Board Market Watch, December 2015 SUMMARY OF EXISTING HOME TRANSACTIONS ATTACHED/ROW/TOWNHOUSE, DECEMBER 2015 ALL TREB AREAS 17 Sales Dollar Volume Average Price Median Price New Listings Active Listings Avg. SP / LP Avg. DOM TREB Total Halton Region Burlington Halton Hills Milton Oakville Peel Region Brampton Caledon Mississauga City of Toronto Toronto West Toronto Central Toronto East York Region Aurora E. Gwillimbury Georgina King Markham Newmarket Richmond Hill Vaughan Whitchurch-Stouffville Durham Region Ajax Brock Clarington Oshawa Pickering Scugog Uxbridge Whitby Dufferin County Orangeville Simcoe County Adjala-Tosorontio Bradford West GwillimburyEssa Innisfil New Tecumseth 378 $202,592,790 $535,960 $498,500 281 274 100% 21 68 $34,180,030 $502,648 $474,500 46 44 99% 22 8 $3,980,400 $497,550 $459,500 5 6 100% 20 5 $2,396,900 $479,380 $444,900 4 2 98% 32 33 $14,934,000 $452,545 $455,000 26 9 100% 14 22 $12,868,730 $584,942 $537,400 11 27 97% 33 77 $35,975,286 $467,212 $453,000 57 46 99% 19 46 $18,811,600 $408,948 $424,900 41 27 99% 15 7 $3,369,000 $481,286 $490,000 3 1 98% 28 24 $13,794,686 $574,779 $556,500 13 18 99% 24 59 $40,576,000 $687,729 $655,000 50 68 100% 22 18 $11,914,300 $661,906 $682,500 15 15 99% 20 16 $14,544,400 $909,025 $815,000 14 30 99% 25 25 $14,117,300 $564,692 $514,000 21 23 102% 21 105 $64,953,324 $618,603 $604,000 74 85 101% 21 6 $3,350,000 $558,333 $542,500 5 5 101% 17 3 $1,181,000 $393,667 $382,000 0 2 98% 43 3 $1,049,000 $349,667 $345,000 0 6 100% 11 4 $2,801,990 $700,498 $721,995 1 3 99% 57 16 $9,645,700 $602,856 $596,000 19 21 101% 19 8 $4,233,700 $529,213 $544,250 5 3 102% 13 28 $19,960,344 $712,869 $696,250 22 20 102% 18 30 $19,107,090 $636,903 $610,000 15 24 99% 23 7 $3,624,500 $517,786 $524,000 7 1 101% 13 52 $21,168,650 $407,089 $414,400 41 23 101% 15 19 $8,259,950 $434,734 $435,000 13 5 101% 13 0 - - - 0 0 - - 4 $1,234,000 $308,500 $322,500 5 3 102% 6 3 $768,500 $256,167 $270,000 4 2 103% 8 9 $4,023,000 $447,000 $444,000 7 5 100% 27 0 - - - 0 0 - - 0 - - - 1 3 - - 17 $6,883,200 $404,894 $396,000 11 5 100% 13 6 $2,062,900 $343,817 $349,000 3 1 99% 79 6 $2,062,900 $343,817 $349,000 3 1 99% 79 11 $3,676,600 $334,236 $325,000 10 7 99% 21 0 - - - 0 0 - - 2 $899,500 $449,750 $449,750 3 3 98% 24 2 $610,000 $305,000 $305,000 2 1 99% 32 4 $1,268,100 $317,025 $326,550 4 2 99% 16 3 $899,000 $299,667 $297,000 1 1 98% 18 1 1 1 1 2 3 4 5
- 18. Toronto Real Estate Board Market Watch, December 2015 SUMMARY OF EXISTING HOME TRANSACTIONS ATTACHED/ROW/TOWNHOUSE, DECEMBER 2015 CITY OF TORONTO MUNICIPAL BREAKDOWN 18 Sales Dollar Volume Average Price Median Price New Listings Active Listings Avg. SP / LP Avg. DOM TREB Total City of Toronto Total Toronto West Toronto W01 Toronto W02 Toronto W03 Toronto W04 Toronto W05 Toronto W06 Toronto W07 Toronto W08 Toronto W09 Toronto W10 Toronto Central Toronto C01 Toronto C02 Toronto C03 Toronto C04 Toronto C06 Toronto C07 Toronto C08 Toronto C09 Toronto C10 Toronto C11 Toronto C12 Toronto C13 Toronto C14 Toronto C15 Toronto East Toronto E01 Toronto E02 Toronto E03 Toronto E04 Toronto E05 Toronto E06 Toronto E07 Toronto E08 Toronto E09 Toronto E10 Toronto E11 378 $202,592,790 $535,960 $498,500 281 274 100% 21 59 $40,576,000 $687,729 $655,000 50 68 100% 22 18 $11,914,300 $661,906 $682,500 15 15 99% 20 1 $820,000 $820,000 $820,000 1 4 113% 4 2 $1,630,000 $815,000 $815,000 2 1 97% 14 1 $470,000 $470,000 $470,000 0 0 104% 8 1 $520,000 $520,000 $520,000 0 0 98% 20 2 $952,400 $476,200 $476,200 2 1 99% 17 7 $4,611,900 $658,843 $670,000 7 4 98% 22 3 $2,155,000 $718,333 $720,000 1 2 98% 24 1 $755,000 $755,000 $755,000 0 2 97% 38 0 - - - 0 0 - - 0 - - - 2 1 - - 16 $14,544,400 $909,025 $815,000 14 30 99% 25 6 $4,884,900 $814,150 $761,000 5 11 99% 14 3 $3,940,000 $1,313,333 $1,530,000 4 5 100% 13 0 - - - 0 2 - - 0 - - - 1 2 - - 0 - - - 0 0 - - 0 - - - 0 1 - - 2 $1,469,000 $734,500 $734,500 1 4 99% 49 0 - - - 0 0 - - 1 $1,032,500 $1,032,500 $1,032,500 0 2 96% 33 0 - - - 2 1 - - 0 - - - 0 0 - - 2 $1,622,000 $811,000 $811,000 1 1 96% 11 2 $1,596,000 $798,000 $798,000 0 1 97% 66 0 - - - 0 0 - - 25 $14,117,300 $564,692 $514,000 21 23 102% 21 3 $2,178,900 $726,300 $699,000 3 2 100% 17 1 $643,500 $643,500 $643,500 1 0 113% 6 4 $3,168,000 $792,000 $770,000 2 1 108% 14 4 $2,197,000 $549,250 $575,500 4 4 99% 24 0 - - - 1 1 - - 0 - - - 0 0 - - 0 - - - 1 5 - - 3 $1,566,000 $522,000 $489,000 4 4 102% 15 0 - - - 0 0 - - 3 $1,465,000 $488,333 $485,000 0 0 98% 41 7 $2,898,900 $414,129 $409,900 5 6 98% 23 1 1 1 1 2 3 4 5
- 19. Toronto Real Estate Board Market Watch, December 2015 SUMMARY OF EXISTING HOME TRANSACTIONS CO-OP APARTMENT, DECEMBER 2015 ALL TREB AREAS 19 Sales Dollar Volume Average Price Median Price New Listings Active Listings Avg. SP / LP Average DOM TREB Total Halton Region Burlington Halton Hills Milton Oakville Peel Region Brampton Caledon Mississauga City of Toronto Toronto West Toronto Central Toronto East York Region Aurora E. Gwillimbury Georgina King Markham Newmarket Richmond Hill Vaughan Whitchurch-Stouffville Durham Region Ajax Brock Clarington Oshawa Pickering Scugog Uxbridge Whitby Dufferin County Orangeville Simcoe County Adjala-Tosorontio Bradford West GwillimburyEssa Innisfil New Tecumseth 5 $4,084,000 $816,800 $942,000 10 20 103% 11 0 - - - 1 1 - - 0 - - - 0 0 - - 0 - - - 0 0 - - 0 - - - 0 0 - - 0 - - - 1 1 - - 1 $366,000 $366,000 $366,000 1 0 99% 6 0 - - - 0 0 - - 0 - - - 0 0 - - 1 $366,000 $366,000 $366,000 1 0 99% 6 4 $3,718,000 $929,500 $983,500 7 18 103% 12 0 - - - 2 6 - - 4 $3,718,000 $929,500 $983,500 5 10 103% 12 0 - - - 0 2 - - 0 - - - 1 1 - - 0 - - - 0 0 - - 0 - - - 0 0 - - 0 - - - 0 0 - - 0 - - - 0 0 - - 0 - - - 0 0 - - 0 - - - 0 0 - - 0 - - - 1 1 - - 0 - - - 0 0 - - 0 - - - 0 0 - - 0 - - - 0 0 - - 0 - - - 0 0 - - 0 - - - 0 0 - - 0 - - - 0 0 - - 0 - - - 0 0 - - 0 - - - 0 0 - - 0 - - - 0 0 - - 0 - - - 0 0 - - 0 - - - 0 0 - - 0 - - - 0 0 - - 0 - - - 0 0 - - 0 - - - 0 0 - - 0 - - - 0 0 - - 0 - - - 0 0 - - 0 - - - 0 0 - - 0 - - - 0 0 - - 0 - - - 0 0 - - 1 1 1 1 2 3 4 5
- 20. Toronto Real Estate Board Market Watch, December 2015 SUMMARY OF EXISTING HOME TRANSACTIONS CO-OP APARTMENT, DECEMBER 2015 CITY OF TORONTO MUNICIPAL BREAKDOWN 20 Sales Dollar Volume Average Price Median Price New Listings Active Listings Avg. SP / LP Avg. DOM TREB Total City of Toronto Total Toronto West Toronto W01 Toronto W02 Toronto W03 Toronto W04 Toronto W05 Toronto W06 Toronto W07 Toronto W08 Toronto W09 Toronto W10 Toronto Central Toronto C01 Toronto C02 Toronto C03 Toronto C04 Toronto C06 Toronto C07 Toronto C08 Toronto C09 Toronto C10 Toronto C11 Toronto C12 Toronto C13 Toronto C14 Toronto C15 Toronto East Toronto E01 Toronto E02 Toronto E03 Toronto E04 Toronto E05 Toronto E06 Toronto E07 Toronto E08 Toronto E09 Toronto E10 Toronto E11 5 $4,084,000 $816,800 $942,000 10 20 103% 11 4 $3,718,000 $929,500 $983,500 7 18 103% 12 0 - - - 2 6 - - 0 - - - 0 0 - - 0 - - - 0 0 - - 0 - - - 0 0 - - 0 - - - 0 0 - - 0 - - - 0 0 - - 0 - - - 1 0 - - 0 - - - 0 2 - - 0 - - - 1 3 - - 0 - - - 0 0 - - 0 - - - 0 1 - - 4 $3,718,000 $929,500 $983,500 5 10 103% 12 0 - - - 0 0 - - 0 - - - 0 1 - - 0 - - - 0 3 - - 0 - - - 0 0 - - 0 - - - 0 0 - - 0 - - - 1 1 - - 0 - - - 0 0 - - 4 $3,718,000 $929,500 $983,500 4 4 103% 12 0 - - - 0 0 - - 0 - - - 0 0 - - 0 - - - 0 0 - - 0 - - - 0 0 - - 0 - - - 0 0 - - 0 - - - 0 1 - - 0 - - - 0 2 - - 0 - - - 0 0 - - 0 - - - 0 0 - - 0 - - - 0 0 - - 0 - - - 0 1 - - 0 - - - 0 0 - - 0 - - - 0 0 - - 0 - - - 0 0 - - 0 - - - 0 0 - - 0 - - - 0 1 - - 0 - - - 0 0 - - 0 - - - 0 0 - - 1 1 1 1 2 3 4 5
- 21. Toronto Real Estate Board Market Watch, December 2015 SUMMARY OF EXISTING HOME TRANSACTIONS DETACHED CONDOMINIUM, DECEMBER 2015 ALL TREB AREAS 21 Sales Dollar Volume Average Price Median Price New Listings Active Listings Avg. SP / LP Avg. DOM TREB Total Halton Region Burlington Halton Hills Milton Oakville Peel Region Brampton Caledon Mississauga City of Toronto Toronto West Toronto Central Toronto East York Region Aurora E. Gwillimbury Georgina King Markham Newmarket Richmond Hill Vaughan Whitchurch-Stouffville Durham Region Ajax Brock Clarington Oshawa Pickering Scugog Uxbridge Whitby Dufferin County Orangeville Simcoe County Adjala-Tosorontio Bradford West GwillimburyEssa Innisfil New Tecumseth 2 $775,000 $387,500 $387,500 3 5 101% 55 0 - - - 0 0 - - 0 - - - 0 0 - - 0 - - - 0 0 - - 0 - - - 0 0 - - 0 - - - 0 0 - - 0 - - - 0 1 - - 0 - - - 0 0 - - 0 - - - 0 0 - - 0 - - - 0 1 - - 0 - - - 0 1 - - 0 - - - 0 0 - - 0 - - - 0 1 - - 0 - - - 0 0 - - 0 - - - 1 1 - - 0 - - - 0 0 - - 0 - - - 0 0 - - 0 - - - 0 0 - - 0 - - - 0 0 - - 0 - - - 1 1 - - 0 - - - 0 0 - - 0 - - - 0 0 - - 0 - - - 0 0 - - 0 - - - 0 0 - - 1 $425,000 $425,000 $425,000 1 0 106% 3 1 $425,000 $425,000 $425,000 1 0 106% 3 0 - - - 0 0 - - 0 - - - 0 0 - - 0 - - - 0 0 - - 0 - - - 0 0 - - 0 - - - 0 0 - - 0 - - - 0 0 - - 0 - - - 0 0 - - 0 - - - 0 0 - - 0 - - - 0 0 - - 1 $350,000 $350,000 $350,000 1 2 95% 106 0 - - - 0 0 - - 0 - - - 0 0 - - 0 - - - 0 0 - - 0 - - - 0 0 - - 1 $350,000 $350,000 $350,000 1 2 95% 106 1 1 1 1 2 3 4 5
- 22. Toronto Real Estate Board Market Watch, December 2015 SUMMARY OF EXISTING HOME TRANSACTIONS DETACHED CONDOMINIUM, DECEMBER 2015 CITY OF TORONTO MUNICIPAL BREAKDOWN 22 Sales Dollar Volume Average Price Median Price New Listings Active Listings Avg. SP / LP Avg. DOM TREB Total City of Toronto Total Toronto West Toronto W01 Toronto W02 Toronto W03 Toronto W04 Toronto W05 Toronto W06 Toronto W07 Toronto W08 Toronto W09 Toronto W10 Toronto Central Toronto C01 Toronto C02 Toronto C03 Toronto C04 Toronto C06 Toronto C07 Toronto C08 Toronto C09 Toronto C10 Toronto C11 Toronto C12 Toronto C13 Toronto C14 Toronto C15 Toronto East Toronto E01 Toronto E02 Toronto E03 Toronto E04 Toronto E05 Toronto E06 Toronto E07 Toronto E08 Toronto E09 Toronto E10 Toronto E11 2 $775,000 $387,500 $387,500 3 5 101% 55 0 - - - 0 1 - - 0 - - - 0 0 - - 0 - - - 0 0 - - 0 - - - 0 0 - - 0 - - - 0 0 - - 0 - - - 0 0 - - 0 - - - 0 0 - - 0 - - - 0 0 - - 0 - - - 0 0 - - 0 - - - 0 0 - - 0 - - - 0 0 - - 0 - - - 0 0 - - 0 - - - 0 1 - - 0 - - - 0 0 - - 0 - - - 0 0 - - 0 - - - 0 0 - - 0 - - - 0 0 - - 0 - - - 0 1 - - 0 - - - 0 0 - - 0 - - - 0 0 - - 0 - - - 0 0 - - 0 - - - 0 0 - - 0 - - - 0 0 - - 0 - - - 0 0 - - 0 - - - 0 0 - - 0 - - - 0 0 - - 0 - - - 0 0 - - 0 - - - 0 0 - - 0 - - - 0 0 - - 0 - - - 0 0 - - 0 - - - 0 0 - - 0 - - - 0 0 - - 0 - - - 0 0 - - 0 - - - 0 0 - - 0 - - - 0 0 - - 0 - - - 0 0 - - 0 - - - 0 0 - - 0 - - - 0 0 - - 0 - - - 0 0 - - 1 1 1 1 2 3 4 5
- 23. Toronto Real Estate Board Market Watch, December 2015 SUMMARY OF EXISTING HOME TRANSACTIONS CO-OWNERSHIP APARTMENT, DECEMBER 2015 ALL TREB AREAS 23 Sales Dollar Volume Average Price Median Price New Listings Active Listings Avg. SP / LP Avg. DOM TREB Total Halton Region Burlington Halton Hills Milton Oakville Peel Region Brampton Caledon Mississauga City of Toronto Toronto West Toronto Central Toronto East York Region Aurora E. Gwillimbury Georgina King Markham Newmarket Richmond Hill Vaughan Whitchurch-Stouffville Durham Region Ajax Brock Clarington Oshawa Pickering Scugog Uxbridge Whitby Dufferin County Orangeville Simcoe County Adjala-Tosorontio Bradford West GwillimburyEssa Innisfil New Tecumseth 1 $253,000 $253,000 $253,000 5 13 97% 60 0 - - - 0 0 - - 0 - - - 0 0 - - 0 - - - 0 0 - - 0 - - - 0 0 - - 0 - - - 0 0 - - 0 - - - 0 0 - - 0 - - - 0 0 - - 0 - - - 0 0 - - 0 - - - 0 0 - - 1 $253,000 $253,000 $253,000 5 13 97% 60 0 - - - 2 3 - - 1 $253,000 $253,000 $253,000 3 10 97% 60 0 - - - 0 0 - - 0 - - - 0 0 - - 0 - - - 0 0 - - 0 - - - 0 0 - - 0 - - - 0 0 - - 0 - - - 0 0 - - 0 - - - 0 0 - - 0 - - - 0 0 - - 0 - - - 0 0 - - 0 - - - 0 0 - - 0 - - - 0 0 - - 0 - - - 0 0 - - 0 - - - 0 0 - - 0 - - - 0 0 - - 0 - - - 0 0 - - 0 - - - 0 0 - - 0 - - - 0 0 - - 0 - - - 0 0 - - 0 - - - 0 0 - - 0 - - - 0 0 - - 0 - - - 0 0 - - 0 - - - 0 0 - - 0 - - - 0 0 - - 0 - - - 0 0 - - 0 - - - 0 0 - - 0 - - - 0 0 - - 0 - - - 0 0 - - 0 - - - 0 0 - - 1 1 1 1 2 3 4 5
- 24. Toronto Real Estate Board Market Watch, December 2015 SUMMARY OF EXISTING HOME TRANSACTIONS CO-OWNERSHIP APARTMENT, DECEMBER 2015 CITY OF TORONTO MUNICIPAL BREAKDOWN 24 Sales Dollar Volume Average Price Median Price New Listings Active Listings Avg. SP / LP Avg. DOM TREB Total City of Toronto Total Toronto West Toronto W01 Toronto W02 Toronto W03 Toronto W04 Toronto W05 Toronto W06 Toronto W07 Toronto W08 Toronto W09 Toronto W10 Toronto Central Toronto C01 Toronto C02 Toronto C03 Toronto C04 Toronto C06 Toronto C07 Toronto C08 Toronto C09 Toronto C10 Toronto C11 Toronto C12 Toronto C13 Toronto C14 Toronto C15 Toronto East Toronto E01 Toronto E02 Toronto E03 Toronto E04 Toronto E05 Toronto E06 Toronto E07 Toronto E08 Toronto E09 Toronto E10 Toronto E11 1 $253,000 $253,000 $253,000 5 13 97% 60 1 $253,000 $253,000 $253,000 5 13 97% 60 0 - - - 2 3 - - 0 - - - 1 1 - - 0 - - - 0 0 - - 0 - - - 0 0 - - 0 - - - 0 0 - - 0 - - - 1 2 - - 0 - - - 0 0 - - 0 - - - 0 0 - - 0 - - - 0 0 - - 0 - - - 0 0 - - 0 - - - 0 0 - - 1 $253,000 $253,000 $253,000 3 10 97% 60 0 - - - 0 0 - - 1 $253,000 $253,000 $253,000 0 0 97% 60 0 - - - 0 1 - - 0 - - - 0 2 - - 0 - - - 0 0 - - 0 - - - 0 0 - - 0 - - - 1 1 - - 0 - - - 0 0 - - 0 - - - 0 2 - - 0 - - - 0 0 - - 0 - - - 0 0 - - 0 - - - 1 2 - - 0 - - - 1 2 - - 0 - - - 0 0 - - 0 - - - 0 0 - - 0 - - - 0 0 - - 0 - - - 0 0 - - 0 - - - 0 0 - - 0 - - - 0 0 - - 0 - - - 0 0 - - 0 - - - 0 0 - - 0 - - - 0 0 - - 0 - - - 0 0 - - 0 - - - 0 0 - - 0 - - - 0 0 - - 0 - - - 0 0 - - 1 1 1 1 2 3 4 5
- 25. Toronto Real Estate Board Market Watch, December 2015 FOCUS ON THE MLS HOME PRICE INDEX INDEX AND BENCHMARK PRICE, DECEMBER 2015 ALL TREB AREAS 25 Composite Single-Family Detached Single-Family Attached Townhouse Apartment Index Benchmark Yr./Yr. % Chg. Index Benchmark Yr./Yr. % Chg. Index Benchmark Yr./Yr. % Chg. Index Benchmark Yr./Yr. % Chg. Index Benchmark Yr./Yr. % Chg. TREB Total Halton Region Burlington Halton Hills Milton Oakville Peel Region Brampton Caledon Mississauga City of Toronto York Region Aurora East Gwillimbury Georgina King Markham Newmarket Richmond Hill Vaughan Whitchurch-Stouffville Durham Region Ajax Brock Clarington Oshawa Pickering Scugog Uxbridge Whitby Dufferin County Orangeville Simcoe County Adjala-Tosorontio Bradford West GwillimburyEssa Innisfil New Tecumseth 187.9 $573,500 10.01% 192.9 $717,800 11.57% 197.5 $558,400 11.02% 183.4 $401,200 10.62% 164.7 $331,000 4.70% 197.9 $648,300 10.31% 195.2 $724,400 10.28% 199.2 $516,900 10.42% 186.0 $366,700 11.11% - - - 202.2 $606,900 11.71% 201.1 $708,400 12.28% 203.0 $483,900 10.39% 191.0 $378,700 10.79% - - - 177.4 $516,500 7.71% 176.3 $564,000 7.63% 191.1 $470,700 9.64% 171.3 $308,800 8.76% - - - 187.3 $517,200 9.28% 174.4 $604,700 7.85% 191.6 $478,400 9.93% 173.6 $318,300 11.71% - - - 207.5 $765,200 10.43% 206.5 $855,800 10.49% 209.8 $568,000 10.65% 190.0 $419,600 11.63% - - - 178.1 $487,500 9.60% 180.5 $611,800 10.20% 183.4 $467,900 10.28% 184.9 $382,600 10.65% 151.6 $261,200 5.64% 173.3 $442,200 10.73% 173.4 $507,200 10.80% 175.3 $413,000 10.67% 167.8 $311,600 9.89% 138.9 $217,400 6.85% 162.0 $578,200 8.14% 161.7 $594,900 8.16% 181.3 $448,200 7.79% - - - - - - 183.3 $512,900 8.91% 192.6 $719,000 9.87% 193.3 $528,000 10.08% 190.6 $409,300 10.94% 153.9 $269,900 5.48% 187.0 $613,200 7.66% 199.3 $864,100 10.05% 203.5 $676,100 8.59% 186.1 $449,800 9.02% 167.3 $345,700 4.30% 210.1 $721,000 14.31% 213.0 $837,400 14.82% 215.5 $624,400 14.57% 190.2 $483,300 16.47% 165.7 $359,500 6.49% 204.1 $657,000 17.37% 203.1 $754,500 16.46% 212.7 $550,000 18.50% 165.6 $419,400 18.29% 167.5 $346,400 12.72% 181.0 $586,700 13.76% 183.1 $603,400 14.29% 187.9 $397,800 11.38% - - - - - - 177.1 $367,600 10.34% 186.5 $384,200 12.35% 188.8 $372,100 7.52% - - - - - - 189.7 $804,200 11.00% 191.1 $806,300 10.72% 214.9 $503,300 14.49% - - - - - - 219.0 $753,700 14.24% 227.6 $935,600 15.42% 223.6 $665,900 14.55% 199.4 $495,400 19.33% 166.5 $383,800 4.39% 192.1 $566,500 16.78% 190.9 $642,700 17.48% 199.3 $470,000 17.30% 190.6 $384,800 13.25% 170.2 $286,600 11.53% 221.8 $804,300 14.98% 237.5 $1,009,500 15.74% 225.9 $685,000 14.15% 175.4 $490,900 11.44% 160.9 $335,100 7.77% 203.6 $736,000 12.55% 196.8 $819,200 12.71% 210.3 $639,900 13.13% 198.3 $541,800 15.56% 168.8 $374,600 7.17% 212.5 $801,200 13.51% 211.5 $811,600 13.16% 190.6 $523,500 14.75% - - - - - - 172.9 $406,800 12.27% 171.4 $446,800 12.25% 181.4 $363,500 13.80% 160.8 $263,700 9.31% 159.2 $286,200 5.36% 182.4 $450,700 13.22% 180.8 $484,200 12.86% 190.2 $409,100 13.42% 173.7 $317,400 12.35% 152.9 $259,600 5.74% 143.0 $270,200 6.64% 143.6 $271,900 6.37% - - - - - - - - - 168.9 $357,400 15.05% 161.7 $388,600 13.55% 175.0 $334,100 16.67% 161.8 $289,600 -0.31% 160.9 $227,700 5.16% 167.7 $321,200 14.08% 167.4 $356,600 15.45% 177.6 $297,500 15.25% 140.8 $188,400 9.57% 151.8 $204,900 1.81% 179.0 $484,000 8.75% 178.6 $558,100 8.37% 187.8 $437,700 10.47% 175.7 $315,400 9.40% 166.6 $326,200 6.32% 159.9 $415,000 3.70% 163.8 $421,800 3.34% 157.1 $328,800 7.60% - - - - - - 163.1 $498,700 9.32% 162.9 $504,500 8.53% 158.0 $387,700 9.19% - - - - - - 173.4 $452,400 11.80% 175.0 $502,700 11.54% 178.3 $392,800 12.92% 163.2 $299,200 11.48% 153.1 $298,600 4.15% 173.8 $398,300 11.70% 180.8 $412,000 11.95% 169.1 $317,000 10.81% - - - - - - 173.8 $398,300 11.70% 180.8 $412,000 11.95% 169.1 $317,000 10.81% - - - - - - 172.7 $368,200 13.99% 166.5 $368,900 12.88% 181.5 $348,300 15.38% - - - - - - 150.3 $533,400 17.51% 150.3 $533,400 17.51% - - - - - - - - - 192.9 $479,400 14.21% 173.0 $529,900 12.56% 193.7 $402,700 12.35% - - - - - - 171.7 $402,200 17.68% 169.3 $428,100 17.49% 175.0 $298,100 18.08% - - - - - - 166.4 $307,800 10.20% 166.4 $308,400 9.98% 182.8 $284,400 11.80% - - - - - - 162.6 $375,600 19.65% 158.4 $408,000 19.64% 170.1 $324,800 19.45% - - - - - -
- 26. Toronto Real Estate Board Market Watch, December 2015 FOCUS ON THE MLS HOME PRICE INDEX INDEX AND BENCHMARK PRICE, DECEMBER 2015 CITY OF TORONTO 26 Composite Single-Family Detached Single-Family Attached Townhouse Apartment Index Benchmark Yr./Yr. % Chg. Index Benchmark Yr./Yr. % Chg. Index Benchmark Yr./Yr. % Chg. Index Benchmark Yr./Yr. % Chg. Index Benchmark Yr./Yr. % Chg. TREB Total City of Toronto Toronto W01 Toronto W02 Toronto W03 Toronto W04 Toronto W05 Toronto W06 Toronto W07 Toronto W08 Toronto W09 Toronto W10 Toronto C01 Toronto C02 Toronto C03 Toronto C04 Toronto C06 Toronto C07 Toronto C08 Toronto C09 Toronto C10 Toronto C11 Toronto C12 Toronto C13 Toronto C14 Toronto C15 Toronto E01 Toronto E02 Toronto E03 Toronto E04 Toronto E05 Toronto E06 Toronto E07 Toronto E08 Toronto E09 Toronto E10 Toronto E11 188 $573,500 10.01% 193 $717,800 11.57% 198 $558,400 11.02% 183 $401,200 10.62% 165 $331,000 4.70% 187 $613,200 7.66% 199 $864,100 10.05% 204 $676,100 8.59% 186 $449,800 9.02% 167 $345,700 4.30% 172 $700,500 5.53% 178 $917,400 5.26% 192 $740,000 5.33% 232 $477,300 16.02% 150 $350,300 7.29% 205 $736,900 8.95% 211 $864,000 8.51% 239 $730,600 11.14% 166 $458,800 11.45% 146 $593,800 6.01% 207 $536,500 12.57% 210 $570,600 12.19% 215 $549,800 12.65% - - - 151 $287,800 12.86% 179 $467,800 11.42% 188 $592,000 10.81% 186 $541,200 9.66% 162 $394,300 17.61% 153 $225,700 10.30% 168 $400,600 14.09% 183 $610,400 13.30% 169 $494,300 12.73% 169 $278,000 15.04% 143 $187,500 15.82% 160 $467,500 2.43% 202 $640,200 7.46% 168 $509,400 4.80% 176 $518,800 5.01% 125 $311,200 -2.58% 177 $755,200 4.11% 186 $802,600 5.63% 174 $715,100 3.56% 124 $454,000 -10.18% 112 $454,600 4.28% 158 $643,200 5.19% 172 $899,100 4.75% 170 $643,400 0.36% 149 $364,700 0.54% 145 $291,100 7.19% 172 $441,700 6.05% 186 $694,700 7.34% 167 $467,000 0.06% 180 $465,000 14.81% 144 $185,200 0.98% 166 $385,800 9.27% 180 $528,500 7.87% 175 $473,800 9.16% 162 $292,600 15.34% 143 $217,700 11.06% 194 $480,600 2.21% 205 $725,100 0.59% 224 $781,100 3.94% 183 $544,800 0.33% 189 $392,500 1.89% 198 $937,700 6.64% 186 $1,474,300 8.39% 215 $1,133,400 11.03% 198 $927,300 6.21% 185 $517,000 2.26% 210 $1,081,300 9.20% 205 $1,237,300 9.96% 221 $816,700 13.59% - - - 208 $550,300 0.10% 190 $1,179,000 13.34% 196 $1,371,500 12.89% 200 $954,200 15.11% 168 $626,900 8.82% 158 $376,100 12.76% 203 $809,800 13.53% 211 $902,700 13.08% 183 $684,000 12.61% - - - 192 $424,100 12.82% 191 $655,000 11.46% 232 $1,059,800 16.62% 184 $658,100 10.37% 163 $477,300 12.22% 159 $374,300 5.79% 179 $461,900 0.22% 154 $478,300 -4.47% 192 $801,000 -2.73% 174 $526,200 -5.60% 180 $397,000 1.24% 141 $1,045,600 7.15% 126 $1,582,800 -0.94% 147 $1,194,600 0.41% 166 $856,800 -0.30% 153 $506,900 16.70% 206 $804,700 9.04% 206 $1,265,400 17.76% 212 $1,049,000 18.59% 242 $554,000 7.43% 198 $473,400 0.71% 188 $671,800 8.44% 183 $1,225,100 5.48% 207 $916,000 5.95% 126 $200,600 11.82% 193 $274,600 11.63% 176 $1,504,000 7.54% 170 $1,829,200 10.81% 200 $858,000 14.95% 198 $670,700 9.76% 179 $562,400 -3.82% 181 $667,400 7.36% 202 $1,080,700 11.01% 186 $598,100 10.75% 180 $513,100 9.88% 153 $302,900 0.39% 184 $626,600 4.00% 234 $1,267,900 8.70% 200 $976,200 3.30% 227 $768,400 5.82% 161 $405,100 1.51% 188 $629,500 6.32% 226 $1,059,400 9.60% 207 $674,900 8.99% 201 $494,200 8.90% 147 $344,300 1.80% 223 $693,100 8.04% 226 $764,700 11.03% 236 $744,200 9.46% 201 $406,000 -1.62% 200 $473,200 5.78% 205 $764,600 6.99% 188 $827,100 7.50% 215 $717,100 6.45% 200 $639,200 2.57% 212 $581,800 13.65% 205 $632,700 15.59% 213 $715,200 17.30% 199 $647,400 11.69% - - - 162 $241,700 16.76% 193 $484,500 8.73% 199 $588,800 9.98% 186 $451,800 5.74% 191 $413,000 8.21% 187 $283,600 5.11% 189 $505,700 11.10% 212 $748,200 10.54% 204 $562,400 9.49% 196 $425,900 14.43% 160 $313,800 10.67% 206 $581,700 12.20% 207 $591,000 12.03% 210 $499,900 10.64% 197 $486,900 11.18% 189 $417,000 8.93% 201 $495,700 10.38% 230 $751,800 12.60% 216 $563,800 11.94% 202 $438,300 12.14% 172 $294,500 7.50% 190 $467,200 13.62% 206 $641,800 15.18% 178 $455,900 8.30% 190 $388,500 11.29% 150 $239,800 4.52% 181 $436,300 10.18% 199 $565,800 10.69% 184 $451,800 10.84% 187 $344,600 13.68% 159 $297,600 8.92% 195 $552,900 8.98% 196 $628,100 8.58% 186 $484,000 6.10% 210 $367,600 15.14% 136 $218,400 0.74% 183 $403,000 9.86% 200 $555,700 7.18% 192 $434,600 7.52% 155 $304,000 13.83% 158 $235,100 17.19%
- 27. Toronto Real Estate Board Market Watch, December 2015 HISTORIC ANNUAL STATISTICS 27 Year Sales Average Price 2004 2005 2006 2007 2008 2009 2010 2011 2012 2013 2014 83,501 $315,231 84,145 $335,907 83,084 $351,941 93,193 $376,236 74,552 $379,347 87,308 $395,460 85,545 $431,276 89,096 $465,014 85,496 $497,130 87,049 $522,958 92,782 $566,624 2014 MONTHLY STATISTICS NOTES 1 - Sales, dollar volume, average sale prices and median sale prices are based on firm transactions entered into the TREB MLS® system between the first and last day of the month/period being reported. 2 - New listings entered into the TREB MLS® system between the first and last day of the month/period being reported. 3 - Active listings at the end of the last day of the month/period being reported. 4 - Ratio of the average selling price to the average listing price for firm transactions entered into the TREB MLS® system between the first and last day of the month/period being reported. 5 - Average number of days on the market for firm transactions entered into the TREB MLS® system between the first and last day of the month/period being reported. 6 - Due to past changes to TREB's service area, caution should be exercised when making historical comparisons. 7 - Past monthly and year-to-date figures are revised on a monthly basis. 8 - SNLR = Sales-to-New Listings Ratio. Calculated using a 12-month moving average (sales/new listings). 9 - Mos. Inv. = Months of Inventory. Calculated using a 12-month moving average (active listings/sales). 2015 MONTHLY STATISTICS *For historic annual sales and average price data over a longer time frame go to: January February March April May June July August September October November December Year to Date 4,318 $552,925 6,295 $596,316 8,889 $613,884 11,255 $636,089 11,641 $649,650 11,908 $639,266 9,817 $609,142 7,949 $603,450 8,151 $627,752 8,767 $630,915 7,364 $632,923 4,945 $609,110 101,299 $616,785 January February March April May June July August September October November December Annual 4,103 $526,965 5,696 $552,859 8,052 $558,019 9,660 $578,354 11,013 $584,946 10,132 $569,174 9,152 $550,625 7,568 $546,482 8,001 $574,424 8,512 $587,945 6,475 $577,468 4,418 $556,259 92,782 $566,624 1,6,7 1,7 1,7 http://www.torontorealestateboard.com/market_news/market_watch/historic_stats/p df/TREB_historic_statistics.pdf Copyright® 2016 Toronto Real Estate Board $622,217101,299