

Recommended
More Related Content
More from Michelle Makos
More from Michelle Makos (20)
Recently uploaded
Recently uploaded (20)
June Market Watch 2018
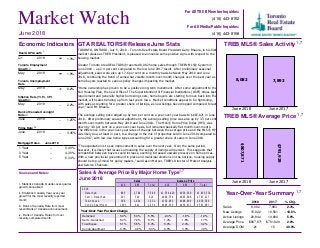
- 1. Toronto Employment Growth May 2018 1.9% Month June 2018 1 Year 3 Year 5 Year 3.49% 4.30% 5.34% June 2018 1 Year 3 Year 5 Year -- -- -- Market Watch For All TREB Member Inquiries: (416) 443-8158 For All Media/Public Inquiries: (416) 443-8152 GTA REALTORS® Release June Stats TORONTO, ONTARIO, July 5, 2018 – Toronto Real Estate Board President Garry Bhaura, in his first market release as TREB President, is pleased to announce some positive signs with respect to the housing market. Greater Toronto Area REALTORS® reported 8,082 home sales through TREB’s MLS® System in June 2018 – up 2.4 per cent compared to the low June 2017 result. After preliminary seasonal adjustment, sales were also up 17.6 per cent on a monthly basis between May 2018 and June 2018, continuing the trend of somewhat volatile month-over-month changes over the past year as home buyers reacted to various policy changes impacting the market. “Home ownership has proven to be a positive long-term investment. After some adjustment to the Fair Housing Plan, the new Office of The Superintendent of Financial Institutions (OSFI) stress test requirement and generally higher borrowing costs, home buyers are starting to move back into the market, with sales trending up from last year’s lows. Market conditions appear to be tightening, with sales accounting for a greater share of listings, as new listings have dropped compared to last year,” said Mr. Bhaura. The average selling price edged up by two per cent on a year-over-year basis to $807,871 in June 2018. After preliminary seasonal adjustment, the average selling price was also up by 3.3 per cent month-over-month between May 2018 and June 2018. The MLS® Home Price Index (HPI) was down by 4.8 per cent on a year-over-year basis, but remained basically flat month-over-month. The difference in the year-over-year rates of change between the average price and the MLS® HPI was likely due, at least in part, to a change in the mix of properties sold in June 2018 compared to June 2017, with low-rise home types accounting for a greater share of sales in June 2018. “The expectation is to see improvement in sales over the next year. Over the same period, however, it is likely that issues surrounding the supply of listings will persist. This suggests that competition between buyers could increase, exerting increased upward pressure on home prices. With a new provincial government in place and municipal elections on the horizon, housing supply should be top-of-mind for policy makers,” said Jason Mercer, TREB’s Director of Market Analysis and Service Channels. TREB MLS® Sales Activity 8,082 7,893 June 2018 June 2017 TREB MLS® Average Price $807,871 $791,929 June 2018 June 2017 Year-Over-Year Summary 2018 2017 % Chg. Sales New Listings Active Listings Average Price Average DOM 8,082 7,893 2.4% 15,922 19,561 -18.6% 20,844 19,680 5.9% $807,871 $791,929 2.0% 21 15 40.0% Sources and Notes: i - Statistics Canada, Quarter-over-quarter growth, annualized ii - Statistics Canada, Year-over-year growth for the most recently reported month iii - Bank of Canada, Rate from most recent Bank of Canada announcement iv - Bank of Canada, Rates for most recently completed month Real GDP Growth Q1 2018 1.3% Toronto Unemployment Rate May 2018 6.2% Inflation Rate (Yr./Yr. CPI Growth) May 2018 -- 2.2% Bank of Canada Overnight Rate June 2018 -- 1.25% Prime Rate June 2018 -- 3.45% Economic Indicators Metrics Sales Average Price 416 905 Total 416 905 Total 2018 Detached Semi - Detached Townhouse Condo Apartment 885 2,704 3,589 $1,354,429 $928,560 $1,033,574 297 519 816 $999,754 $665,606 $787,227 308 1,024 1,332 $736,963 $608,969 $638,566 1,593 641 2,234 $605,530 $450,672 $561,097 Sales & Average Price By Major Home Type June 2018 June 2018 i ii ii iii iv Detached Semi - Detached Townhouse Condo Apartment -2.4% -1.8% -1.9% 1.4% 1.8% 1.7% 5.6% 2.4% 3.2% 9.5% 3.4% 7.9% Detached Semi - Detached Townhouse Condo Apartment 5.9% 5.3% 5.5% 8.4% 7.9% 8.1% 5.1% 5.5% 5.4% -6.0% -3.6% -5.3% 1,7 1,7 1,7 1,7 Year-Over-Year Per Cent Change Mortgage Rates
- 2. Toronto Real Estate Board Market Watch, June 2018 SALES BY PRICE RANGE AND HOUSE TYPE JUNE 2018 2 Price Range Detached Semi-Detached Att/Row/Twnhouse Condo Townhouse Condo Apt Link Co-op Apt Det Condo Co-ownership Apt Total $0 to $99,999 $100,000 to $199,999 $200,000 to $299,999 $300,000 to $399,999 $400,000 to $499,999 $500,000 to $599,999 $600,000 to $699,999 $700,000 to $799,999 $800,000 to $899,999 $900,000 to $999,999 $1,000,000 to $1,249,999 $1,250,000 to $1,499,999 $1,500,000 to $1,749,999 $1,750,000 to $1,999,999 $2,000,000+ 0 0 1 0 1 0 0 0 0 2 5 0 0 3 10 0 0 0 1 19 15 1 0 7 67 0 1 0 0 91 49 9 7 59 429 1 2 0 1 557 137 40 61 170 660 14 4 3 0 1,089 268 92 173 184 429 21 0 2 0 1,169 478 238 217 114 260 14 2 0 0 1,323 565 170 100 32 133 10 0 1 0 1,011 465 97 58 23 92 23 1 0 0 759 337 45 41 16 46 6 0 0 0 491 515 68 25 9 43 2 0 1 0 663 318 32 10 7 26 0 0 1 0 394 152 13 4 3 14 0 0 0 0 186 80 3 3 1 4 0 0 0 0 91 205 8 2 2 20 0 0 0 0 237 Price Range Detached Semi-Detached Att/Row/Twnhouse Condo Townhouse Condo Apt Link Co-op Apt Det Condo Co-ownership Apt Total $0 to $99,999 $100,000 to $199,999 $200,000 to $299,999 $300,000 to $399,999 $400,000 to $499,999 $500,000 to $599,999 $600,000 to $699,999 $700,000 to $799,999 $800,000 to $899,999 $900,000 to $999,999 $1,000,000 to $1,249,999 $1,250,000 to $1,499,999 $1,500,000 to $1,749,999 $1,750,000 to $1,999,999 $2,000,000+ 1 0 1 0 7 0 0 0 0 9 12 1 1 21 58 0 5 0 2 100 50 6 0 57 421 0 7 0 3 544 238 48 35 324 2,488 6 8 0 9 3,156 762 183 325 846 3,442 98 10 8 5 5,679 1,375 476 893 778 2,331 101 3 12 1 5,970 2,166 1,096 1,045 481 1,295 71 7 2 1 6,164 2,572 780 539 166 684 80 1 3 0 4,825 2,247 358 326 104 426 87 2 3 0 3,553 1,727 210 188 58 243 42 1 0 0 2,469 2,504 257 135 49 239 32 0 1 0 3,217 1,479 131 53 36 113 4 2 2 0 1,820 740 48 20 9 59 0 0 0 0 876 410 18 7 5 33 0 0 0 0 473 919 49 13 11 73 0 0 2 0 1,067 SALES BY PRICE RANGE AND HOUSE TYPE YEAR-TO-DATE, 2018 Total Sales Share of Total Sales Average Price 3,589 816 702 630 2,234 91 10 8 2 8,082 44.4% 10.1% 8.7% 7.8% 27.6% 1.1% 0.1% 0.1% 0.0% 100.0% $1,033,574 $787,227 $692,112 $578,900 $561,097 $682,997 $492,761 $714,000 $244,500 $807,871 Total Sales Share of Total Sales Average Price 17,202 3,661 3,581 2,945 11,912 521 46 33 21 39,922 43.1% 9.2% 9.0% 7.4% 29.8% 1.3% 0.1% 0.1% 0.1% 100.0% $1,020,136 $782,289 $694,047 $568,830 $549,478 $692,109 $480,936 $768,664 $367,262 $789,893 1,7 1,7
- 3. Toronto Real Estate Board Market Watch, June 2018 Number of Sales Dollar Volume Average Price Median Price New Listings SNLR (Trend) Active Listings Mos. Inv. (Trend) Avg. SP / LP Avg. DOM TREB Total Halton Region Burlington Halton Hills Milton Oakville Peel Region Brampton Caledon Mississauga City of Toronto Toronto West Toronto Central Toronto East York Region Aurora E. Gwillimbury Georgina King Markham Newmarket Richmond Hill Vaughan Whitchurch-Stouffville Durham Region Ajax Brock Clarington Oshawa Pickering Scugog Uxbridge Whitby Dufferin County Orangeville Simcoe County Adjala-Tosorontio Bradford West GwillimburyEssa Innisfil New Tecumseth 8,082 $6,529,213,081 807,871 $682,000 15,922 47.9% 20,844 2.6 99% 21 837 $715,957,686 855,386 $720,000 1,534 49.3% 2,267 2.8 97% 25 236 $182,677,875 774,059 $671,000 371 55.2% 588 2.5 97% 26 97 $68,630,640 707,532 $645,000 157 58.0% 198 2.0 98% 22 206 $144,528,631 701,595 $660,000 360 52.9% 421 2.2 98% 22 298 $320,120,540 1,074,230 $887,000 646 42.0% 1,060 3.6 97% 28 1,693 $1,219,323,355 720,215 $670,000 3,256 49.2% 3,638 2.4 98% 20 771 $536,542,314 695,904 $663,000 1,504 47.3% 1,579 2.4 98% 20 89 $77,847,394 874,690 $825,000 200 44.3% 302 3.7 97% 24 833 $604,933,647 726,211 $660,000 1,552 51.7% 1,757 2.2 98% 20 3,096 $2,695,251,277 870,559 $686,500 5,243 57.5% 5,748 1.9 101% 17 819 $646,796,506 789,739 $675,000 1,367 58.6% 1,512 2.0 100% 18 1,498 $1,447,199,530 966,088 $675,000 2,552 57.8% 2,913 1.9 100% 16 779 $601,255,241 771,830 $716,000 1,324 55.7% 1,323 1.9 102% 17 1,260 $1,169,375,498 928,076 $827,750 3,253 33.3% 5,568 4.6 97% 28 94 $84,599,141 899,991 $748,000 229 30.9% 395 4.9 97% 32 55 $43,941,000 798,927 $725,000 148 25.4% 286 7.3 97% 36 71 $42,312,200 595,946 $540,000 191 32.7% 336 5.1 94% 35 34 $47,707,500 1,403,162 $1,050,000 119 24.9% 263 8.6 95% 32 330 $321,626,720 974,626 $867,940 753 37.5% 1,201 3.8 97% 27 132 $102,578,868 777,113 $713,500 270 32.6% 474 4.6 97% 30 193 $199,514,503 1,033,754 $922,000 621 30.0% 1,099 5.2 97% 27 289 $271,910,414 940,866 $885,000 747 35.6% 1,206 4.2 97% 25 62 $55,185,152 890,083 $748,000 175 33.4% 308 4.8 97% 32 918 $560,648,156 610,728 $575,000 1,895 48.0% 2,303 2.4 98% 21 156 $99,421,788 637,319 $600,000 249 50.9% 253 2.0 99% 20 11 $6,407,000 582,455 $430,000 36 41.6% 91 4.6 96% 30 164 $87,396,984 532,908 $509,500 332 51.5% 360 2.1 98% 21 236 $121,601,600 515,261 $496,250 578 46.0% 670 2.4 99% 21 123 $88,356,290 718,344 $670,000 209 46.8% 272 2.5 99% 20 30 $19,811,003 660,367 $643,000 74 44.5% 130 3.8 96% 28 29 $22,833,800 787,372 $765,000 68 44.2% 134 4.2 97% 39 169 $114,819,691 679,406 $652,000 349 48.3% 393 2.1 98% 19 46 $25,793,800 560,735 $578,450 91 65.1% 104 1.8 99% 30 46 $25,793,800 560,735 $578,450 91 65.1% 104 1.8 99% 30 232 $142,863,309 615,790 $574,500 650 34.9% 1,216 5.1 97% 33 16 $11,379,385 711,212 $676,688 36 45.1% 58 4.9 97% 38 55 $36,610,199 665,640 $638,000 143 32.4% 268 4.9 98% 23 28 $14,655,700 523,418 $455,750 82 44.5% 143 3.9 97% 43 72 $43,486,405 603,978 $529,000 247 26.4% 472 7.0 97% 33 61 $36,731,620 602,158 $572,000 142 44.0% 275 4.0 97% 35 SUMMARY OF EXISTING HOME TRANSACTIONS ALL HOME TYPES, JUNE 2018 ALL TREB AREAS 3 1 1 1 2 5498 3
- 4. Toronto Real Estate Board Market Watch, June 2018 SUMMARY OF EXISTING HOME TRANSACTIONS ALL HOME TYPES, JUNE 2018 CITY OF TORONTO MUNICIPAL BREAKDOWN 4 Number of Sales Dollar Volume Average Price Median Price New Listings SNLR (Trend) Active Listings Mos. Inv. (Trend) Avg. SP / LP Avg. DOM TREB Total City of Toronto Total Toronto West Toronto W01 Toronto W02 Toronto W03 Toronto W04 Toronto W05 Toronto W06 Toronto W07 Toronto W08 Toronto W09 Toronto W10 Toronto Central Toronto C01 Toronto C02 Toronto C03 Toronto C04 Toronto C06 Toronto C07 Toronto C08 Toronto C09 Toronto C10 Toronto C11 Toronto C12 Toronto C13 Toronto C14 Toronto C15 Toronto East Toronto E01 Toronto E02 Toronto E03 Toronto E04 Toronto E05 Toronto E06 Toronto E07 Toronto E08 Toronto E09 Toronto E10 Toronto E11 8,082 $6,529,213,081 $807,871 $682,000 15,922 47.9% 20,844 2.6 99% 21 3,096 $2,695,251,277 $870,559 $686,500 5,243 57.5% 5,748 1.9 101% 17 819 $646,796,506 $789,739 $675,000 1,367 58.6% 1,512 2.0 100% 18 62 $62,984,791 $1,015,884 $967,000 91 70.3% 64 1.2 105% 13 85 $85,601,203 $1,007,073 $950,000 107 68.0% 67 1.2 105% 12 50 $35,613,117 $712,262 $685,000 90 55.9% 97 1.9 102% 14 65 $40,944,500 $629,915 $555,000 133 54.4% 183 2.5 100% 20 110 $60,674,330 $551,585 $567,000 199 54.6% 258 2.6 99% 24 141 $104,839,081 $743,540 $647,000 258 59.4% 288 1.9 100% 19 25 $30,487,900 $1,219,516 $1,060,000 37 61.3% 43 1.7 99% 16 152 $149,007,285 $980,311 $669,000 229 61.1% 243 1.7 98% 19 55 $38,777,800 $705,051 $688,000 78 50.9% 102 2.6 98% 21 74 $37,866,499 $511,709 $434,250 145 52.8% 167 2.5 99% 19 1,498 $1,447,199,530 $966,088 $675,000 2,552 57.8% 2,913 1.9 100% 16 494 $363,444,769 $735,718 $625,000 720 67.3% 664 1.4 102% 14 75 $112,371,029 $1,498,280 $1,175,000 135 57.1% 161 2.2 101% 18 46 $83,921,160 $1,824,373 $1,316,500 94 54.0% 100 2.1 98% 18 79 $146,922,438 $1,859,778 $1,600,000 157 47.2% 187 2.4 101% 12 25 $19,081,218 $763,249 $518,000 64 51.4% 78 2.5 98% 14 97 $86,769,729 $894,533 $652,500 198 43.7% 307 3.2 97% 20 192 $139,816,912 $728,213 $635,750 245 69.0% 237 1.3 101% 16 25 $59,935,000 $2,397,400 $2,060,000 40 62.6% 47 1.9 102% 14 80 $69,953,299 $874,416 $727,000 95 66.3% 75 1.3 102% 13 37 $38,796,888 $1,048,565 $740,000 52 63.0% 47 1.5 101% 14 23 $58,844,800 $2,558,470 $1,230,000 82 34.0% 151 5.1 93% 26 65 $63,536,387 $977,483 $735,000 130 52.2% 133 2.2 98% 15 134 $114,091,500 $851,429 $582,800 283 51.2% 377 2.4 98% 20 126 $89,714,401 $712,019 $540,500 257 50.2% 349 2.6 97% 22 779 $601,255,241 $771,830 $716,000 1,324 55.7% 1,323 1.9 102% 17 68 $70,209,964 $1,032,499 $982,500 88 67.9% 50 0.9 109% 11 64 $68,711,065 $1,073,610 $931,500 92 65.9% 67 1.2 107% 9 99 $98,823,019 $998,212 $947,000 156 58.6% 108 1.4 107% 11 97 $59,410,188 $612,476 $647,500 143 57.7% 148 1.9 100% 17 77 $49,344,450 $640,837 $559,000 142 47.6% 167 2.7 98% 24 30 $32,674,600 $1,089,153 $935,050 67 47.2% 73 2.2 100% 22 71 $43,257,000 $609,254 $567,000 139 54.2% 178 2.4 99% 23 51 $39,549,200 $775,475 $701,000 102 53.4% 120 2.2 97% 18 89 $51,935,087 $583,540 $608,000 184 56.0% 181 1.9 99% 21 52 $43,383,668 $834,301 $760,000 112 44.6% 140 2.8 98% 19 81 $43,957,000 $542,679 $540,000 99 58.0% 91 2.0 98% 17 1 1 1 2 8 3 9 4 5
- 5. Toronto Real Estate Board Market Watch, June 2018 SUMMARY OF EXISTING HOME TRANSACTIONS ALL HOME TYPES, YEAR-TO-DATE 2018 ALL TREB AREAS 5 Number of Sales Dollar Volume Average Price Median Price New Listings Avg. SP / LP Avg. DOM TREB Total Halton Region Burlington Halton Hills Milton Oakville Peel Region Brampton Caledon Mississauga City of Toronto Toronto West Toronto Central Toronto East York Region Aurora E. Gwillimbury Georgina King Markham Newmarket Richmond Hill Vaughan Whitchurch-Stouffville Durham Region Ajax Brock Clarington Oshawa Pickering Scugog Uxbridge Whitby Dufferin County Orangeville Simcoe County Adjala-Tosorontio Bradford West GwillimburyEssa Innisfil New Tecumseth 39,922 $31,534,108,330 $789,893 $670,000 84,644 99% 22 4,104 $3,482,999,061 $848,684 $739,500 8,608 97% 25 1,163 $891,828,414 $766,834 $690,000 2,176 98% 26 410 $303,509,530 $740,267 $685,000 774 98% 23 987 $694,087,748 $703,230 $660,000 1,892 98% 21 1,544 $1,593,573,369 $1,032,107 $877,500 3,766 97% 27 8,392 $5,980,147,485 $712,601 $659,000 16,431 98% 21 3,842 $2,666,278,684 $693,982 $659,900 7,614 98% 21 454 $421,475,077 $928,359 $825,000 1,007 97% 28 4,096 $2,892,393,724 $706,151 $635,000 7,810 98% 21 15,403 $12,928,498,432 $839,349 $662,500 27,284 101% 18 4,150 $3,178,128,594 $765,814 $663,250 7,106 101% 20 7,627 $7,057,547,205 $925,337 $645,000 13,709 100% 18 3,626 $2,692,822,633 $742,643 $700,000 6,469 102% 18 5,968 $5,505,438,921 $922,493 $835,500 18,488 97% 28 448 $410,186,034 $915,594 $811,000 1,334 96% 28 232 $187,222,030 $806,992 $727,000 877 97% 35 323 $180,159,504 $557,769 $515,000 1,087 96% 32 142 $203,043,998 $1,429,887 $1,307,500 615 95% 39 1,532 $1,431,570,469 $934,445 $869,500 4,188 98% 26 550 $420,520,163 $764,582 $722,250 1,732 97% 30 968 $962,210,746 $994,019 $900,000 3,404 97% 28 1,499 $1,458,850,721 $973,216 $890,000 4,323 97% 26 274 $251,675,256 $918,523 $822,000 928 97% 30 4,592 $2,752,564,678 $599,426 $567,000 9,905 99% 21 746 $479,063,635 $642,176 $615,000 1,405 99% 19 77 $41,302,400 $536,395 $444,900 224 96% 33 838 $446,143,390 $532,391 $502,000 1,716 99% 21 1,225 $625,955,911 $510,984 $490,000 2,856 99% 19 590 $412,923,128 $699,870 $655,250 1,208 98% 20 122 $80,491,503 $659,766 $610,602 320 97% 33 146 $112,096,308 $767,783 $687,500 335 97% 37 848 $554,588,403 $653,996 $620,000 1,841 98% 21 265 $143,009,073 $539,657 $535,000 431 99% 23 265 $143,009,073 $539,657 $535,000 431 99% 23 1,198 $741,450,680 $618,907 $580,000 3,497 97% 34 60 $46,787,417 $779,790 $676,688 154 96% 49 310 $212,008,048 $683,897 $650,000 884 97% 30 178 $91,968,400 $516,676 $479,500 441 97% 33 304 $182,268,805 $599,568 $532,500 1,214 96% 34 346 $208,418,010 $602,364 $580,000 804 97% 35 1 1 1 2 4 5
- 6. Toronto Real Estate Board Market Watch, June 2018 SUMMARY OF EXISTING HOME TRANSACTIONS ALL HOME TYPES, YEAR-TO-DATE 2018 CITY OF TORONTO MUNICIPAL BREAKDOWN 6 Number of Sales Dollar Volume Average Price Median Price New Listings Avg. SP / LP Avg. DOM TREB Total City of Toronto Total Toronto West Toronto W01 Toronto W02 Toronto W03 Toronto W04 Toronto W05 Toronto W06 Toronto W07 Toronto W08 Toronto W09 Toronto W10 Toronto Central Toronto C01 Toronto C02 Toronto C03 Toronto C04 Toronto C06 Toronto C07 Toronto C08 Toronto C09 Toronto C10 Toronto C11 Toronto C12 Toronto C13 Toronto C14 Toronto C15 Toronto East Toronto E01 Toronto E02 Toronto E03 Toronto E04 Toronto E05 Toronto E06 Toronto E07 Toronto E08 Toronto E09 Toronto E10 Toronto E11 39,922 $31,534,108,330 $789,893 $670,000 84,644 99% 22 15,403 $12,928,498,432 $839,349 $662,500 27,284 101% 18 4,150 $3,178,128,594 $765,814 $663,250 7,106 101% 20 314 $314,944,429 $1,003,008 $818,950 443 105% 13 403 $392,137,574 $973,046 $900,000 582 106% 11 252 $182,070,745 $722,503 $710,000 467 102% 17 368 $228,885,390 $621,971 $549,500 690 99% 25 535 $292,922,179 $547,518 $561,000 951 98% 25 725 $507,911,781 $700,568 $613,000 1,298 100% 20 158 $191,159,537 $1,209,870 $1,087,500 241 100% 18 793 $724,878,848 $914,097 $617,500 1,319 100% 19 226 $159,736,484 $706,799 $693,750 420 98% 25 376 $183,481,627 $487,983 $405,000 695 98% 25 7,627 $7,057,547,205 $925,337 $645,000 13,709 100% 18 2,558 $1,838,318,139 $718,654 $610,000 3,911 102% 17 385 $561,857,223 $1,459,369 $1,110,000 712 101% 20 242 $356,031,010 $1,471,203 $1,051,500 474 101% 17 347 $610,507,604 $1,759,388 $1,650,000 801 101% 15 156 $134,474,706 $862,017 $626,500 302 97% 20 494 $439,556,542 $889,791 $651,250 1,134 97% 22 968 $697,678,349 $720,742 $620,000 1,487 102% 15 144 $291,994,273 $2,027,738 $1,443,500 227 103% 19 348 $326,161,920 $937,247 $700,650 539 101% 13 195 $182,713,887 $936,994 $450,000 305 101% 15 122 $315,156,469 $2,583,250 $2,025,000 410 95% 25 322 $298,214,920 $926,133 $702,450 615 98% 19 670 $528,091,498 $788,196 $570,000 1,420 98% 19 676 $476,790,665 $705,312 $530,000 1,372 98% 22 3,626 $2,692,822,633 $742,643 $700,000 6,469 102% 18 326 $324,271,531 $994,698 $948,500 470 111% 11 331 $354,895,181 $1,072,191 $975,000 496 105% 12 443 $429,042,792 $968,494 $915,000 706 107% 12 451 $267,032,603 $592,090 $633,800 755 100% 19 342 $207,686,383 $607,270 $531,500 700 98% 25 157 $145,343,329 $925,754 $826,500 341 99% 18 340 $194,081,434 $570,828 $446,500 661 99% 23 260 $192,265,035 $739,481 $700,500 483 98% 22 430 $234,097,464 $544,413 $500,000 787 99% 20 234 $174,132,406 $744,156 $740,500 550 99% 20 312 $169,974,475 $544,790 $543,750 520 99% 21 1 1 1 2 4 5
- 7. Toronto Real Estate Board Market Watch, June 2018 SUMMARY OF EXISTING HOME TRANSACTIONS DETACHED HOUSES, JUNE 2018 ALL TREB AREAS 7 Sales Dollar Volume Average Price Median Price New Listings Active Listings Avg. SP / LP Avg. DOM TREB Total Halton Region Burlington Halton Hills Milton Oakville Peel Region Brampton Caledon Mississauga City of Toronto Toronto West Toronto Central Toronto East York Region Aurora E. Gwillimbury Georgina King Markham Newmarket Richmond Hill Vaughan Whitchurch-Stouffville Durham Region Ajax Brock Clarington Oshawa Pickering Scugog Uxbridge Whitby Dufferin County Orangeville Simcoe County Adjala-Tosorontio Bradford West GwillimburyEssa Innisfil New Tecumseth 3,589 $3,709,495,612 $1,033,574 $857,000 8,417 12,489 98% 23 442 $479,652,258 $1,085,186 $916,500 937 1,529 97% 27 119 $119,615,599 $1,005,173 $870,000 212 402 97% 27 70 $54,619,740 $780,282 $739,250 131 174 98% 23 86 $75,520,550 $878,146 $830,000 192 266 98% 27 167 $229,896,369 $1,376,625 $1,180,000 402 687 96% 28 761 $703,325,019 $924,212 $845,000 1,701 2,087 97% 20 407 $331,587,324 $814,711 $772,000 880 966 98% 19 71 $65,700,199 $925,355 $870,000 163 265 97% 23 283 $306,037,496 $1,081,405 $950,000 658 856 97% 21 885 $1,198,669,894 $1,354,429 $1,035,000 1,793 2,260 99% 18 293 $337,093,593 $1,150,490 $937,500 552 636 100% 17 241 $521,672,561 $2,164,616 $1,737,000 598 946 98% 17 351 $339,903,740 $968,387 $825,000 643 678 101% 18 672 $774,512,909 $1,152,549 $1,045,500 2,004 3,771 96% 31 52 $57,802,591 $1,111,588 $1,039,250 125 253 96% 34 35 $32,171,300 $919,180 $838,800 117 247 96% 40 66 $39,820,900 $603,347 $547,000 173 313 94% 36 27 $41,610,500 $1,541,130 $1,295,000 104 246 94% 35 139 $190,178,546 $1,368,191 $1,188,000 370 644 96% 29 81 $72,889,280 $899,868 $808,000 183 346 97% 32 95 $138,143,825 $1,454,146 $1,348,000 375 726 96% 29 135 $159,883,815 $1,184,325 $1,130,000 418 748 97% 27 42 $42,012,152 $1,000,289 $815,000 139 248 97% 33 619 $419,075,228 $677,020 $649,000 1,372 1,748 98% 21 99 $69,514,288 $702,165 $677,000 175 176 99% 20 11 $6,407,000 $582,455 $430,000 35 90 96% 30 100 $59,923,809 $599,238 $575,000 244 295 98% 20 171 $94,294,600 $551,430 $530,000 429 495 99% 20 71 $62,074,790 $874,293 $790,000 123 175 99% 19 29 $19,199,800 $662,062 $651,000 71 128 96% 29 22 $19,563,900 $889,268 $831,250 51 117 97% 44 116 $88,097,041 $759,457 $722,000 244 272 98% 18 33 $20,168,300 $611,161 $595,000 65 76 99% 26 33 $20,168,300 $611,161 $595,000 65 76 99% 26 177 $114,092,004 $644,588 $612,000 545 1,018 97% 35 16 $11,379,385 $711,212 $676,688 36 58 97% 38 35 $25,721,799 $734,909 $730,000 113 219 98% 23 19 $10,793,800 $568,095 $490,000 67 116 96% 51 63 $37,789,300 $599,830 $540,000 216 407 97% 35 44 $28,407,720 $645,630 $637,000 113 218 97% 35 1 2 3 4 51 1 1
- 8. Toronto Real Estate Board Market Watch, June 2018 SUMMARY OF EXISTING HOME TRANSACTIONS DETACHED HOUSES, JUNE 2018 CITY OF TORONTO MUNICIPAL BREAKDOWN 8 Sales Dollar Volume Average Price Median Price New Listings Active Listings Avg. SP / LP Avg. DOM TREB Total City of Toronto Total Toronto West Toronto W01 Toronto W02 Toronto W03 Toronto W04 Toronto W05 Toronto W06 Toronto W07 Toronto W08 Toronto W09 Toronto W10 Toronto Central Toronto C01 Toronto C02 Toronto C03 Toronto C04 Toronto C06 Toronto C07 Toronto C08 Toronto C09 Toronto C10 Toronto C11 Toronto C12 Toronto C13 Toronto C14 Toronto C15 Toronto East Toronto E01 Toronto E02 Toronto E03 Toronto E04 Toronto E05 Toronto E06 Toronto E07 Toronto E08 Toronto E09 Toronto E10 Toronto E11 3,589 $3,709,495,612 $1,033,574 $857,000 8,417 12,489 98% 23 885 $1,198,669,894 $1,354,429 $1,035,000 1,793 2,260 99% 18 293 $337,093,593 $1,150,490 $937,500 552 636 100% 17 14 $22,185,250 $1,584,661 $1,460,875 19 14 100% 13 29 $39,516,833 $1,362,649 $1,320,000 35 24 105% 11 29 $22,117,600 $762,676 $730,000 56 61 102% 12 27 $23,461,200 $868,933 $790,500 75 98 100% 20 18 $15,437,900 $857,661 $832,500 60 86 98% 17 47 $46,489,400 $989,136 $849,000 80 73 101% 16 17 $24,379,000 $1,434,059 $1,351,000 28 29 99% 14 58 $97,476,910 $1,680,636 $1,427,500 93 121 97% 22 26 $25,485,500 $980,212 $941,250 37 49 99% 24 28 $20,544,000 $733,714 $735,000 69 81 99% 17 241 $521,672,561 $2,164,616 $1,737,000 598 946 98% 17 6 $9,870,900 $1,645,150 $1,692,500 18 18 107% 8 11 $29,473,900 $2,679,445 $1,880,000 16 21 96% 23 25 $63,245,330 $2,529,813 $1,900,000 45 60 96% 22 52 $118,179,638 $2,272,685 $2,087,500 113 146 100% 12 7 $10,087,018 $1,441,003 $1,170,000 36 49 97% 15 28 $43,875,987 $1,567,000 $1,392,500 60 131 96% 20 0 $0 - $0 0 0 - - 12 $45,396,000 $3,783,000 $2,837,500 20 26 101% 18 10 $16,798,000 $1,679,800 $1,582,500 16 19 101% 9 11 $20,994,888 $1,908,626 $1,785,000 21 16 102% 10 9 $43,685,000 $4,853,889 $4,590,000 60 123 93% 20 27 $42,463,000 $1,572,704 $1,200,000 52 66 97% 14 23 $48,230,800 $2,096,991 $1,845,000 76 158 95% 28 20 $29,372,100 $1,468,605 $1,245,000 65 113 96% 20 351 $339,903,740 $968,387 $825,000 643 678 101% 18 15 $17,847,000 $1,189,800 $1,060,000 16 11 102% 13 18 $27,096,359 $1,505,353 $1,336,250 33 31 106% 12 66 $71,600,831 $1,084,861 $1,016,500 113 86 105% 12 49 $37,671,600 $768,808 $740,000 82 81 100% 16 22 $21,302,850 $968,311 $1,021,400 45 60 99% 31 24 $28,918,700 $1,204,946 $1,021,250 60 56 100% 20 23 $20,595,300 $895,448 $858,000 45 67 99% 24 32 $30,986,500 $968,328 $778,750 64 77 96% 21 42 $31,009,700 $738,326 $724,500 83 83 99% 20 36 $34,423,000 $956,194 $822,500 76 99 97% 21 24 $18,451,900 $768,829 $771,000 26 27 98% 18 1 1 1 1 2 3 4 5
- 9. Toronto Real Estate Board Market Watch, June 2018 SUMMARY OF EXISTING HOME TRANSACTIONS SEMI-DETACHED HOUSES, JUNE 2018 ALL TREB AREAS 9 Sales Dollar Volume Average Price Median Price New Listings Active Listings Avg. SP / LP Avg. DOM TREB Total Halton Region Burlington Halton Hills Milton Oakville Peel Region Brampton Caledon Mississauga City of Toronto Toronto West Toronto Central Toronto East York Region Aurora E. Gwillimbury Georgina King Markham Newmarket Richmond Hill Vaughan Whitchurch-Stouffville Durham Region Ajax Brock Clarington Oshawa Pickering Scugog Uxbridge Whitby Dufferin County Orangeville Simcoe County Adjala-Tosorontio Bradford West GwillimburyEssa Innisfil New Tecumseth 816 $642,376,836 $787,227 $710,500 1,309 1,221 102% 17 52 $35,016,488 $673,394 $680,000 76 95 98% 21 15 $9,563,100 $637,540 $663,000 11 18 98% 20 1 $470,000 $470,000 $470,000 4 7 98% 13 23 $15,217,000 $661,609 $680,000 42 40 98% 21 13 $9,766,388 $751,261 $715,000 19 30 98% 24 271 $182,562,848 $673,664 $670,000 474 410 99% 17 140 $89,266,249 $637,616 $635,000 264 218 99% 18 8 $5,400,500 $675,063 $677,250 8 8 98% 22 123 $87,896,099 $714,602 $715,000 202 184 99% 16 297 $296,927,082 $999,754 $901,000 429 344 107% 14 87 $74,863,817 $860,504 $780,000 127 120 106% 16 91 $112,394,317 $1,235,102 $1,113,018 138 135 105% 16 119 $109,668,948 $921,588 $892,500 164 89 110% 10 115 $87,447,118 $760,410 $784,000 203 258 98% 23 11 $7,850,000 $713,636 $670,000 19 24 98% 24 3 $2,131,500 $710,500 $720,000 7 13 97% 26 1 $542,000 $542,000 $542,000 1 1 99% 63 1 $1,050,000 $1,050,000 $1,050,000 3 4 124% 53 27 $22,654,018 $839,038 $830,000 54 66 98% 23 23 $13,855,200 $602,400 $632,000 25 32 99% 16 11 $8,947,500 $813,409 $818,000 27 41 97% 36 33 $27,074,900 $820,452 $813,000 58 65 98% 20 5 $3,342,000 $668,400 $661,000 9 12 97% 30 66 $32,514,800 $492,648 $466,500 105 87 99% 17 15 $8,791,300 $586,087 $580,000 14 13 98% 20 0 - - - 0 0 - - 8 $3,473,500 $434,188 $436,250 8 3 101% 9 30 $12,905,500 $430,183 $420,000 56 47 99% 19 7 $4,275,500 $610,786 $585,000 17 17 97% 16 0 - - - 1 1 - - 1 $480,000 $480,000 $480,000 1 0 96% 15 5 $2,589,000 $517,800 $547,000 8 6 100% 14 5 $2,256,000 $451,200 $458,000 7 8 98% 28 5 $2,256,000 $451,200 $458,000 7 8 98% 28 10 $5,652,500 $565,250 $585,000 15 19 97% 22 0 - - - 0 0 - - 8 $4,647,500 $580,938 $595,000 8 9 97% 23 0 - - - 1 1 - - 0 - - - 0 1 - - 2 $1,005,000 $502,500 $502,500 6 8 98% 17 1 1 1 1 2 3 4 5
- 10. Toronto Real Estate Board Market Watch, June 2018 SUMMARY OF EXISTING HOME TRANSACTIONS SEMI-DETACHED HOUSES, JUNE 2018 CITY OF TORONTO MUNICIPAL BREAKDOWN 10 Sales Dollar Volume Average Price Median Price New Listings Active Listings Avg. SP / LP Avg. DOM TREB Total City of Toronto Total Toronto West Toronto W01 Toronto W02 Toronto W03 Toronto W04 Toronto W05 Toronto W06 Toronto W07 Toronto W08 Toronto W09 Toronto W10 Toronto Central Toronto C01 Toronto C02 Toronto C03 Toronto C04 Toronto C06 Toronto C07 Toronto C08 Toronto C09 Toronto C10 Toronto C11 Toronto C12 Toronto C13 Toronto C14 Toronto C15 Toronto East Toronto E01 Toronto E02 Toronto E03 Toronto E04 Toronto E05 Toronto E06 Toronto E07 Toronto E08 Toronto E09 Toronto E10 Toronto E11 816 $642,376,836 $787,227 $710,500 1,309 1,221 102% 17 297 $296,927,082 $999,754 $901,000 429 344 107% 14 87 $74,863,817 $860,504 $780,000 127 120 106% 16 12 $15,016,000 $1,251,333 $1,255,500 13 6 117% 7 25 $23,851,000 $954,040 $1,000,000 31 19 105% 10 13 $9,732,517 $748,655 $685,000 25 26 102% 17 3 $2,233,000 $744,333 $760,000 6 6 100% 30 26 $17,856,300 $686,781 $682,500 42 49 102% 24 3 $2,351,000 $783,667 $780,000 4 3 103% 11 0 - - - 0 0 - - 2 $1,675,000 $837,500 $837,500 2 0 100% 16 1 $800,000 $800,000 $800,000 3 9 100% 5 2 $1,349,000 $674,500 $674,500 1 2 104% 15 91 $112,394,317 $1,235,102 $1,113,018 138 135 105% 16 15 $20,724,111 $1,381,607 $1,315,000 19 23 110% 12 19 $29,234,018 $1,538,633 $1,300,000 21 18 108% 12 8 $8,131,000 $1,016,375 $1,001,500 12 8 106% 12 9 $11,922,000 $1,324,667 $1,205,000 9 8 106% 7 0 - - - 0 2 - - 6 $5,156,300 $859,383 $830,750 12 11 101% 23 5 $7,045,000 $1,409,000 $1,440,000 1 4 95% 46 0 - - - 1 1 - - 10 $11,423,000 $1,142,300 $1,100,000 15 7 107% 6 5 $6,962,000 $1,392,400 $1,255,000 10 5 99% 10 1 $948,000 $948,000 $948,000 0 1 86% 35 3 $2,175,888 $725,296 $725,000 10 12 98% 31 1 $1,056,000 $1,056,000 $1,056,000 0 0 92% 28 9 $7,617,000 $846,333 $835,000 28 35 98% 32 119 $109,668,948 $921,588 $892,500 164 89 110% 10 30 $32,442,464 $1,081,415 $1,037,500 47 22 116% 7 28 $28,844,796 $1,030,171 $1,007,500 30 12 111% 8 25 $23,642,188 $945,688 $947,000 25 4 110% 8 6 $4,079,000 $679,833 $657,500 12 9 101% 11 4 $2,785,000 $696,250 $710,000 11 9 99% 26 2 $1,505,000 $752,500 $752,500 3 3 101% 20 9 $6,386,500 $709,611 $708,000 9 9 102% 21 0 - - - 0 1 - - 5 $3,239,000 $647,800 $656,000 8 4 100% 9 2 $1,530,000 $765,000 $765,000 7 7 107% 14 8 $5,215,000 $651,875 $700,000 12 9 100% 18 1 1 1 1 2 3 4 5
- 11. Toronto Real Estate Board Market Watch, June 2018 SUMMARY OF EXISTING HOME TRANSACTIONS CONDOMINIUM TOWNHOUSES, JUNE 2018 ALL TREB AREAS 11 Sales Dollar Volume Average Price Median Price New Listings Active Listings Avg. SP / LP Avg. DOM TREB Total Halton Region Burlington Halton Hills Milton Oakville Peel Region Brampton Caledon Mississauga City of Toronto Toronto West Toronto Central Toronto East York Region Aurora E. Gwillimbury Georgina King Markham Newmarket Richmond Hill Vaughan Whitchurch-Stouffville Durham Region Ajax Brock Clarington Oshawa Pickering Scugog Uxbridge Whitby Dufferin County Orangeville Simcoe County Adjala-Tosorontio Bradford West GwillimburyEssa Innisfil New Tecumseth 630 $364,707,087 $578,900 $542,750 1,027 1,184 99% 22 76 $39,728,582 $522,745 $490,000 107 127 99% 25 33 $16,756,576 $507,775 $510,000 47 49 99% 23 6 $2,375,000 $395,833 $385,000 9 7 98% 17 9 $4,220,000 $468,889 $469,000 9 6 98% 25 28 $16,377,006 $584,893 $536,750 42 65 98% 28 209 $112,999,113 $540,666 $535,000 320 338 99% 21 59 $28,698,001 $486,407 $469,000 73 87 99% 26 0 - - - 0 1 - - 150 $84,301,112 $562,007 $550,000 247 250 99% 20 228 $151,612,892 $664,969 $594,000 357 362 100% 18 80 $46,074,226 $575,928 $558,500 110 110 100% 19 80 $68,147,955 $851,849 $702,750 132 124 100% 17 68 $37,390,711 $549,863 $542,750 115 128 99% 19 58 $36,463,400 $628,679 $616,500 150 244 98% 29 11 $5,602,000 $509,273 $537,500 16 40 99% 43 0 - - - 0 0 - - 0 - - - 1 2 - - 0 - - - 0 0 - - 22 $15,244,500 $692,932 $664,000 61 101 98% 25 5 $2,656,000 $531,200 $515,000 17 19 96% 44 9 $6,058,000 $673,111 $652,500 27 42 102% 21 11 $6,902,900 $627,536 $616,000 25 36 97% 25 0 - - - 3 4 - - 57 $23,131,100 $405,809 $410,000 83 97 99% 24 14 $6,410,500 $457,893 $461,000 10 9 98% 21 0 - - - 1 1 - - 7 $2,455,800 $350,829 $330,000 6 8 98% 29 14 $4,712,500 $336,607 $345,250 34 41 100% 22 11 $4,675,500 $425,045 $420,000 15 18 98% 31 0 - - - 0 0 - - 3 $1,569,900 $523,300 $610,000 5 5 97% 20 8 $3,306,900 $413,363 $419,000 12 15 100% 17 1 $416,500 $416,500 $416,500 4 3 98% 16 1 $416,500 $416,500 $416,500 4 3 98% 16 1 $355,500 $355,500 $355,500 6 13 99% 34 0 - - - 0 0 - - 0 - - - 2 3 - - 0 - - - 0 0 - - 0 - - - 1 2 - - 1 $355,500 $355,500 $355,500 3 8 99% 34 1 1 1 1 2 3 4 5
- 12. Toronto Real Estate Board Market Watch, June 2018 SUMMARY OF EXISTING HOME TRANSACTIONS CONDOMINIUM TOWNHOUSES, JUNE 2018 CITY OF TORONTO MUNICIPAL BREAKDOWN 12 Sales Dollar Volume Average Price Median Price New Listings Active Listings Avg. SP / LP Avg. DOM TREB Total City of Toronto Total Toronto West Toronto W01 Toronto W02 Toronto W03 Toronto W04 Toronto W05 Toronto W06 Toronto W07 Toronto W08 Toronto W09 Toronto W10 Toronto Central Toronto C01 Toronto C02 Toronto C03 Toronto C04 Toronto C06 Toronto C07 Toronto C08 Toronto C09 Toronto C10 Toronto C11 Toronto C12 Toronto C13 Toronto C14 Toronto C15 Toronto East Toronto E01 Toronto E02 Toronto E03 Toronto E04 Toronto E05 Toronto E06 Toronto E07 Toronto E08 Toronto E09 Toronto E10 Toronto E11 630 $364,707,087 $578,900 $542,750 1,027 1,184 99% 22 228 $151,612,892 $664,969 $594,000 357 362 100% 18 80 $46,074,226 $575,928 $558,500 110 110 100% 19 6 $4,247,000 $707,833 $727,500 9 5 103% 12 6 $5,600,000 $933,333 $871,000 8 4 106% 12 1 $576,000 $576,000 $576,000 1 1 105% 16 6 $3,112,000 $518,667 $508,500 10 16 102% 6 30 $13,935,450 $464,515 $479,750 41 40 98% 23 11 $7,204,976 $654,998 $678,888 13 13 98% 19 0 - - - 0 0 - - 9 $5,780,000 $642,222 $663,000 10 15 98% 23 4 $2,315,000 $578,750 $556,000 7 5 98% 9 7 $3,303,800 $471,971 $485,000 11 11 101% 21 80 $68,147,955 $851,849 $702,750 132 124 100% 17 18 $14,700,000 $816,667 $747,000 33 25 101% 15 3 $4,281,500 $1,427,167 $1,250,000 6 5 102% 15 2 $4,012,830 $2,006,415 $2,006,415 4 3 104% 49 0 - - - 1 1 - - 1 $780,000 $780,000 $780,000 3 2 98% 7 8 $4,653,500 $581,688 $623,750 13 14 98% 15 9 $7,538,000 $837,556 $698,000 13 10 101% 12 1 $1,175,000 $1,175,000 $1,175,000 1 1 107% 7 5 $4,890,000 $978,000 $975,000 3 1 100% 16 4 $3,488,000 $872,000 $857,500 2 3 98% 13 5 $5,368,800 $1,073,760 $998,800 10 14 94% 29 2 $1,135,000 $567,500 $567,500 4 3 99% 27 8 $5,639,225 $704,903 $655,000 12 14 101% 15 14 $10,486,100 $749,007 $660,750 27 28 98% 18 68 $37,390,711 $549,863 $542,750 115 128 99% 19 5 $4,727,000 $945,400 $955,000 6 4 99% 23 5 $3,889,569 $777,914 $805,000 8 7 100% 10 0 - - - 0 0 - - 9 $4,755,388 $528,376 $553,000 10 12 101% 13 11 $6,255,000 $568,636 $575,000 24 26 99% 15 0 - - - 0 6 - - 2 $1,160,000 $580,000 $580,000 12 14 97% 19 4 $2,220,000 $555,000 $579,000 8 8 97% 7 6 $2,244,500 $374,083 $332,250 13 14 99% 36 8 $3,466,654 $433,332 $483,500 13 15 100% 22 18 $8,672,600 $481,811 $505,500 21 22 98% 23 1 1 1 1 2 3 4 5
- 13. Toronto Real Estate Board Market Watch, June 2018 SUMMARY OF EXISTING HOME TRANSACTIONS CONDOMINIUM APARTMENT, JUNE 2018 ALL TREB AREAS 13 Sales Dollar Volume Average Price Median Price New Listings Active Listings Avg. SP / LP Avg. DOM TREB Total Halton Region Burlington Halton Hills Milton Oakville Peel Region Brampton Caledon Mississauga City of Toronto Toronto West Toronto Central Toronto East York Region Aurora E. Gwillimbury Georgina King Markham Newmarket Richmond Hill Vaughan Whitchurch-Stouffville Durham Region Ajax Brock Clarington Oshawa Pickering Scugog Uxbridge Whitby Dufferin County Orangeville Simcoe County Adjala-Tosorontio Bradford West GwillimburyEssa Innisfil New Tecumseth 2,234 $1,253,489,892 $561,097 $489,000 3,585 4,005 100% 19 111 $57,363,577 $516,789 $430,000 164 227 98% 27 43 $21,065,200 $489,888 $435,000 58 82 98% 28 2 $751,000 $375,500 $375,500 1 1 99% 12 22 $9,497,400 $431,700 $418,750 23 22 99% 23 44 $26,049,977 $592,045 $447,500 82 122 98% 29 295 $121,300,404 $411,188 $397,500 463 480 98% 21 54 $19,423,750 $359,699 $357,500 79 77 98% 23 0 - - - 2 2 - - 241 $101,876,654 $422,725 $405,000 382 401 98% 20 1,593 $964,608,964 $605,530 $535,000 2,498 2,584 101% 17 333 $166,985,929 $501,459 $465,000 529 592 100% 19 1,049 $706,540,498 $673,537 $585,000 1,625 1,642 101% 16 211 $91,082,537 $431,671 $405,000 344 350 100% 19 185 $91,673,669 $495,533 $455,000 369 580 98% 27 3 $1,422,000 $474,000 $482,000 20 23 97% 23 0 - - - 0 0 - - 0 - - - 0 2 - - 1 $690,000 $690,000 $690,000 2 5 97% 37 71 $33,726,080 $475,015 $447,000 130 195 99% 27 6 $2,572,500 $428,750 $412,000 10 20 97% 45 50 $22,798,790 $455,976 $436,000 102 166 98% 26 54 $30,464,299 $564,154 $506,000 103 159 98% 24 0 - - - 2 10 - - 44 $16,901,278 $384,120 $360,000 72 90 98% 26 5 $1,736,000 $347,200 $351,000 9 8 97% 12 0 - - - 0 0 - - 13 $4,236,075 $325,852 $315,000 10 6 98% 35 6 $2,703,000 $450,500 $368,000 8 24 98% 32 13 $5,182,500 $398,654 $367,000 23 27 98% 20 1 $611,203 $611,203 $611,203 1 0 107% 7 1 $310,000 $310,000 $310,000 4 4 94% 68 5 $2,122,500 $424,500 $390,000 17 21 98% 24 2 $443,000 $221,500 $221,500 1 0 96% 44 2 $443,000 $221,500 $221,500 1 0 96% 44 4 $1,199,000 $299,750 $300,000 18 44 97% 22 0 - - - 0 0 - - 2 $547,000 $273,500 $273,500 5 12 97% 15 0 - - - 0 0 - - 0 - - - 7 26 - - 2 $652,000 $326,000 $326,000 6 6 97% 30 1 1 1 1 2 3 4 5
- 14. Toronto Real Estate Board Market Watch, June 2018 SUMMARY OF EXISTING HOME TRANSACTIONS CONDOMINIUM APARTMENT, JUNE 2018 CITY OF TORONTO MUNICIPAL BREAKDOWN 14 Sales Dollar Volume Average Price Median Price New Listings Active Listings Avg. SP / LP Avg. DOM TREB Total City of Toronto Total Toronto West Toronto W01 Toronto W02 Toronto W03 Toronto W04 Toronto W05 Toronto W06 Toronto W07 Toronto W08 Toronto W09 Toronto W10 Toronto Central Toronto C01 Toronto C02 Toronto C03 Toronto C04 Toronto C06 Toronto C07 Toronto C08 Toronto C09 Toronto C10 Toronto C11 Toronto C12 Toronto C13 Toronto C14 Toronto C15 Toronto East Toronto E01 Toronto E02 Toronto E03 Toronto E04 Toronto E05 Toronto E06 Toronto E07 Toronto E08 Toronto E09 Toronto E10 Toronto E11 2,234 $1,253,489,892 $561,097 $489,000 3,585 4,005 100% 19 1,593 $964,608,964 $605,530 $535,000 2,498 2,584 101% 17 333 $166,985,929 $501,459 $465,000 529 592 100% 19 29 $20,155,500 $695,017 $569,000 48 39 102% 16 19 $11,933,370 $628,072 $535,000 23 15 105% 11 7 $3,187,000 $455,286 $446,000 7 8 99% 11 29 $12,138,300 $418,562 $430,000 41 60 99% 21 32 $11,307,680 $353,365 $368,650 44 64 99% 26 75 $44,294,805 $590,597 $520,500 151 191 99% 22 3 $1,417,900 $472,633 $449,000 3 11 99% 35 79 $40,365,375 $510,954 $475,000 120 105 100% 17 24 $10,177,300 $424,054 $420,050 28 27 96% 19 36 $12,008,699 $333,575 $350,000 64 72 97% 20 1,049 $706,540,498 $673,537 $585,000 1,625 1,642 101% 16 442 $301,738,858 $682,667 $600,500 633 582 102% 14 40 $47,946,000 $1,198,650 $853,000 87 112 101% 20 10 $8,053,000 $805,300 $729,500 31 28 104% 7 18 $16,820,800 $934,489 $742,000 33 29 103% 14 17 $8,214,200 $483,188 $471,000 24 24 100% 15 52 $30,432,942 $585,249 $564,000 106 143 99% 20 168 $114,480,724 $681,433 $612,500 219 211 102% 15 10 $11,883,000 $1,188,300 $1,161,500 14 14 103% 10 53 $35,178,299 $663,741 $625,000 58 45 102% 14 17 $7,352,000 $432,471 $405,000 19 22 103% 17 8 $8,843,000 $1,105,375 $883,500 11 12 97% 30 31 $16,113,999 $519,806 $455,000 62 47 100% 15 101 $57,715,475 $571,440 $520,888 193 202 100% 18 82 $41,768,201 $509,368 $468,000 135 171 99% 22 211 $91,082,537 $431,671 $405,000 344 350 100% 19 12 $8,561,500 $713,458 $730,000 16 7 107% 10 10 $6,293,450 $629,345 $620,500 15 14 103% 10 8 $3,580,000 $447,500 $368,000 16 17 107% 12 30 $10,614,300 $353,810 $354,500 35 38 98% 23 36 $16,081,600 $446,711 $433,000 54 61 98% 24 4 $2,250,900 $562,725 $486,000 4 5 98% 35 37 $15,115,200 $408,519 $409,000 71 77 99% 22 13 $5,060,700 $389,285 $390,000 25 27 99% 14 36 $15,441,887 $428,941 $414,400 77 77 98% 23 0 - - - 7 12 - - 25 $8,083,000 $323,320 $329,000 24 15 98% 11 1 1 1 1 2 3 4 5
- 15. Toronto Real Estate Board Market Watch, June 2018 SUMMARY OF EXISTING HOME TRANSACTIONS LINK, JUNE 2018 ALL TREB AREAS 15 Sales Dollar Volume Average Price Median Price New Listings Active Listings Avg. SP / LP Avg. DOM TREB Total Halton Region Burlington Halton Hills Milton Oakville Peel Region Brampton Caledon Mississauga City of Toronto Toronto West Toronto Central Toronto East York Region Aurora E. Gwillimbury Georgina King Markham Newmarket Richmond Hill Vaughan Whitchurch-Stouffville Durham Region Ajax Brock Clarington Oshawa Pickering Scugog Uxbridge Whitby Dufferin County Orangeville Simcoe County Adjala-Tosorontio Bradford West GwillimburyEssa Innisfil New Tecumseth 91 $62,152,700 $682,997 $640,000 220 250 98% 23 5 $3,338,000 $667,600 $640,000 18 20 99% 14 2 $1,263,000 $631,500 $631,500 6 4 99% 4 1 $505,000 $505,000 $505,000 0 0 101% 7 0 - - - 4 4 - - 2 $1,570,000 $785,000 $785,000 8 12 98% 28 8 $5,094,000 $636,750 $622,500 17 17 97% 31 6 $3,664,000 $610,667 $605,000 8 9 97% 34 0 - - - 1 1 - - 2 $1,430,000 $715,000 $715,000 8 7 98% 21 3 $2,205,000 $735,000 $750,000 10 18 99% 20 0 - - - 0 1 - - 0 - - - 3 3 - - 3 $2,205,000 $735,000 $750,000 7 14 99% 20 40 $33,210,400 $830,260 $830,500 79 92 98% 24 1 $840,000 $840,000 $840,000 0 1 96% 50 0 - - - 0 0 - - 2 $945,000 $472,500 $472,500 1 0 95% 20 0 - - - 3 2 - - 31 $26,632,400 $859,110 $846,000 52 60 98% 20 0 - - - 2 2 - - 1 $860,000 $860,000 $860,000 11 19 97% 32 4 $3,280,000 $820,000 $827,500 10 8 98% 30 1 $653,000 $653,000 $653,000 0 0 98% 70 26 $13,775,500 $529,827 $521,500 80 77 98% 23 1 $495,000 $495,000 $495,000 1 1 97% 16 0 - - - 0 0 - - 16 $8,279,500 $517,469 $513,500 43 31 98% 23 1 $380,000 $380,000 $380,000 8 10 99% 20 1 $557,500 $557,500 $557,500 3 6 99% 30 0 - - - 1 1 - - 0 - - - 1 1 - - 7 $4,063,500 $580,500 $607,000 23 27 98% 25 0 - - - 0 1 - - 0 - - - 0 1 - - 9 $4,529,800 $503,311 $492,000 16 25 98% 22 0 - - - 0 0 - - 3 $1,615,400 $538,467 $550,000 5 10 98% 25 4 $1,917,000 $479,250 $464,500 7 10 98% 26 0 - - - 1 2 - - 2 $997,400 $498,700 $498,700 3 3 99% 9 1 1 1 1 2 3 4 5
- 16. Toronto Real Estate Board Market Watch, June 2018 SUMMARY OF EXISTING HOME TRANSACTIONS LINK, JUNE 2018 CITY OF TORONTO MUNICIPAL BREAKDOWN 16 Sales Dollar Volume Average Price Median Price New Listings Active Listings Avg. SP / LP Avg. DOM TREB Total City of Toronto Total Toronto West Toronto W01 Toronto W02 Toronto W03 Toronto W04 Toronto W05 Toronto W06 Toronto W07 Toronto W08 Toronto W09 Toronto W10 Toronto Central Toronto C01 Toronto C02 Toronto C03 Toronto C04 Toronto C06 Toronto C07 Toronto C08 Toronto C09 Toronto C10 Toronto C11 Toronto C12 Toronto C13 Toronto C14 Toronto C15 Toronto East Toronto E01 Toronto E02 Toronto E03 Toronto E04 Toronto E05 Toronto E06 Toronto E07 Toronto E08 Toronto E09 Toronto E10 Toronto E11 91 $62,152,700 $682,997 $640,000 220 250 98% 23 3 $2,205,000 $735,000 $750,000 10 18 99% 20 0 - - - 0 1 - - 0 - - - 0 0 - - 0 - - - 0 0 - - 0 - - - 0 0 - - 0 - - - 0 0 - - 0 - - - 0 0 - - 0 - - - 0 0 - - 0 - - - 0 0 - - 0 - - - 0 0 - - 0 - - - 0 0 - - 0 - - - 0 1 - - 0 - - - 3 3 - - 0 - - - 0 0 - - 0 - - - 0 0 - - 0 - - - 0 0 - - 0 - - - 0 0 - - 0 - - - 0 0 - - 0 - - - 1 1 - - 0 - - - 0 0 - - 0 - - - 0 0 - - 0 - - - 0 0 - - 0 - - - 0 0 - - 0 - - - 0 0 - - 0 - - - 0 0 - - 0 - - - 0 0 - - 0 - - - 2 2 - - 3 $2,205,000 $735,000 $750,000 7 14 99% 20 0 - - - 0 0 - - 0 - - - 0 0 - - 0 - - - 0 0 - - 0 - - - 0 0 - - 2 $1,585,000 $792,500 $792,500 5 6 98% 28 0 - - - 0 0 - - 0 - - - 1 7 - - 0 - - - 0 0 - - 0 - - - 0 0 - - 0 - - - 0 0 - - 1 $620,000 $620,000 $620,000 1 1 103% 5 1 1 1 1 2 3 4 5
- 17. Toronto Real Estate Board Market Watch, June 2018 SUMMARY OF EXISTING HOME TRANSACTIONS ATTACHED/ROW/TOWNHOUSE, JUNE 2018 ALL TREB AREAS 17 Sales Dollar Volume Average Price Median Price New Listings Active Listings Avg. SP / LP Avg. DOM TREB Total Halton Region Burlington Halton Hills Milton Oakville Peel Region Brampton Caledon Mississauga City of Toronto Toronto West Toronto Central Toronto East York Region Aurora E. Gwillimbury Georgina King Markham Newmarket Richmond Hill Vaughan Whitchurch-Stouffville Durham Region Ajax Brock Clarington Oshawa Pickering Scugog Uxbridge Whitby Dufferin County Orangeville Simcoe County Adjala-Tosorontio Bradford West GwillimburyEssa Innisfil New Tecumseth 702 $485,862,343 $692,112 $645,000 1,327 1,644 99% 20 150 $100,649,781 $670,999 $625,000 227 266 99% 20 23 $14,205,400 $617,626 $618,000 33 30 99% 24 17 $9,909,900 $582,935 $595,000 12 9 99% 19 66 $40,073,681 $607,177 $610,000 89 83 99% 15 44 $36,460,800 $828,655 $768,750 93 144 98% 25 148 $92,941,971 $627,986 $629,200 279 302 99% 18 105 $63,902,990 $608,600 $607,500 200 221 99% 17 9 $5,646,695 $627,411 $645,000 25 23 98% 17 34 $23,392,286 $688,008 $685,000 54 58 98% 21 80 $75,371,834 $942,148 $902,450 135 154 103% 14 24 $21,275,941 $886,498 $905,500 41 44 102% 15 29 $33,091,588 $1,141,089 $999,888 46 52 104% 13 27 $21,004,305 $777,937 $685,000 48 58 103% 15 188 $145,266,002 $772,692 $749,500 448 622 99% 25 16 $11,082,550 $692,659 $672,250 49 54 97% 22 17 $9,638,200 $566,953 $625,000 24 26 97% 28 2 $1,004,300 $502,150 $502,150 15 18 98% 18 5 $4,357,000 $871,400 $927,000 7 6 97% 12 38 $32,389,176 $852,347 $816,500 86 134 98% 29 17 $10,605,888 $623,876 $625,000 33 55 98% 28 27 $22,706,388 $840,977 $856,000 79 105 102% 20 52 $44,304,500 $852,010 $808,000 133 190 99% 22 14 $9,178,000 $655,571 $665,000 22 34 98% 29 105 $54,799,250 $521,898 $510,000 180 203 99% 21 21 $12,023,700 $572,557 $554,800 37 45 100% 19 0 - - - 0 0 - - 20 $9,028,300 $451,415 $455,000 21 17 99% 18 14 $6,606,000 $471,857 $484,500 43 53 99% 24 20 $11,590,500 $579,525 $585,000 28 29 99% 19 0 - - - 0 0 - - 2 $910,000 $455,000 $455,000 6 7 98% 14 28 $14,640,750 $522,884 $514,000 45 52 100% 25 5 $2,510,000 $502,000 $505,000 14 16 99% 50 5 $2,510,000 $502,000 $505,000 14 16 99% 50 26 $14,323,505 $550,904 $480,000 44 81 98% 20 0 - - - 0 0 - - 7 $4,078,500 $582,643 $598,000 10 15 99% 22 5 $1,944,900 $388,980 $400,000 7 16 100% 25 9 $5,697,105 $633,012 $460,000 22 34 97% 18 5 $2,603,000 $520,600 $510,000 5 16 99% 17 1 1 1 1 2 3 4 5
- 18. Toronto Real Estate Board Market Watch, June 2018 SUMMARY OF EXISTING HOME TRANSACTIONS ATTACHED/ROW/TOWNHOUSE, JUNE 2018 CITY OF TORONTO MUNICIPAL BREAKDOWN 18 Sales Dollar Volume Average Price Median Price New Listings Active Listings Avg. SP / LP Avg. DOM TREB Total City of Toronto Total Toronto West Toronto W01 Toronto W02 Toronto W03 Toronto W04 Toronto W05 Toronto W06 Toronto W07 Toronto W08 Toronto W09 Toronto W10 Toronto Central Toronto C01 Toronto C02 Toronto C03 Toronto C04 Toronto C06 Toronto C07 Toronto C08 Toronto C09 Toronto C10 Toronto C11 Toronto C12 Toronto C13 Toronto C14 Toronto C15 Toronto East Toronto E01 Toronto E02 Toronto E03 Toronto E04 Toronto E05 Toronto E06 Toronto E07 Toronto E08 Toronto E09 Toronto E10 Toronto E11 702 $485,862,343 $692,112 $645,000 1,327 1,644 99% 20 80 $75,371,834 $942,148 $902,450 135 154 103% 14 24 $21,275,941 $886,498 $905,500 41 44 102% 15 1 $1,381,041 $1,381,041 $1,381,041 2 0 129% 6 5 $4,327,000 $865,400 $905,000 9 5 102% 15 0 - - - 1 1 - - 0 - - - 1 3 - - 3 $2,007,000 $669,000 $685,000 9 16 99% 25 5 $4,498,900 $899,780 $899,900 7 5 100% 7 5 $4,691,000 $938,200 $945,000 6 3 101% 12 4 $3,710,000 $927,500 $972,500 3 1 102% 15 0 - - - 3 10 - - 1 $661,000 $661,000 $661,000 0 0 98% 35 29 $33,091,588 $1,141,089 $999,888 46 52 104% 13 13 $16,410,900 $1,262,377 $1,160,000 17 16 105% 8 1 $775,000 $775,000 $775,000 4 4 103% 10 0 - - - 0 0 - - 0 - - - 1 1 - - 0 - - - 1 1 - - 2 $2,199,000 $1,099,500 $1,099,500 6 7 102% 31 10 $10,753,188 $1,075,319 $999,444 11 11 104% 12 0 - - - 0 1 - - 1 $1,305,000 $1,305,000 $1,305,000 2 2 98% 51 0 - - - 0 1 - - 0 - - - 1 1 - - 2 $1,648,500 $824,250 $824,250 2 5 99% 8 0 - - - 1 2 - - 0 - - - 0 0 - - 27 $21,004,305 $777,937 $685,000 48 58 103% 15 6 $6,632,000 $1,105,333 $1,138,000 3 6 110% 17 3 $2,586,891 $862,297 $875,000 6 2 107% 6 0 - - - 2 1 - - 3 $2,289,900 $763,300 $805,000 4 7 99% 16 2 $1,335,000 $667,500 $667,500 3 5 100% 5 0 - - - 0 3 - - 0 - - - 1 4 - - 2 $1,282,000 $641,000 $641,000 3 4 100% 21 0 - - - 3 3 - - 6 $3,964,014 $660,669 $662,000 8 6 100% 9 5 $2,914,500 $582,900 $575,000 15 17 98% 29 1 1 1 1 2 3 4 5
- 19. Toronto Real Estate Board Market Watch, June 2018 SUMMARY OF EXISTING HOME TRANSACTIONS CO-OP APARTMENT, JUNE 2018 ALL TREB AREAS 19 Sales Dollar Volume Average Price Median Price New Listings Active Listings Avg. SP / LP Average DOM TREB Total Halton Region Burlington Halton Hills Milton Oakville Peel Region Brampton Caledon Mississauga City of Toronto Toronto West Toronto Central Toronto East York Region Aurora E. Gwillimbury Georgina King Markham Newmarket Richmond Hill Vaughan Whitchurch-Stouffville Durham Region Ajax Brock Clarington Oshawa Pickering Scugog Uxbridge Whitby Dufferin County Orangeville Simcoe County Adjala-Tosorontio Bradford West GwillimburyEssa Innisfil New Tecumseth 10 $4,927,611 $492,761 $461,500 12 14 103% 32 1 $209,000 $209,000 $209,000 1 0 100% 9 1 $209,000 $209,000 $209,000 1 0 100% 9 0 - - - 0 0 - - 0 - - - 0 0 - - 0 - - - 0 0 - - 0 - - - 1 1 - - 0 - - - 0 0 - - 0 - - - 0 0 - - 0 - - - 1 1 - - 7 $3,916,611 $559,516 $479,000 10 13 105% 31 1 $373,000 $373,000 $373,000 5 6 98% 77 6 $3,543,611 $590,602 $569,806 5 5 106% 24 0 - - - 0 2 - - 2 $802,000 $401,000 $401,000 0 0 94% 47 0 - - - 0 0 - - 0 - - - 0 0 - - 0 - - - 0 0 - - 0 - - - 0 0 - - 2 $802,000 $401,000 $401,000 0 0 94% 47 0 - - - 0 0 - - 0 - - - 0 0 - - 0 - - - 0 0 - - 0 - - - 0 0 - - 0 - - - 0 0 - - 0 - - - 0 0 - - 0 - - - 0 0 - - 0 - - - 0 0 - - 0 - - - 0 0 - - 0 - - - 0 0 - - 0 - - - 0 0 - - 0 - - - 0 0 - - 0 - - - 0 0 - - 0 - - - 0 0 - - 0 - - - 0 0 - - 0 - - - 0 0 - - 0 - - - 0 0 - - 0 - - - 0 0 - - 0 - - - 0 0 - - 0 - - - 0 0 - - 0 - - - 0 0 - - 1 1 1 1 2 3 4 5
- 20. Toronto Real Estate Board Market Watch, June 2018 SUMMARY OF EXISTING HOME TRANSACTIONS CO-OP APARTMENT, JUNE 2018 CITY OF TORONTO MUNICIPAL BREAKDOWN 20 Sales Dollar Volume Average Price Median Price New Listings Active Listings Avg. SP / LP Avg. DOM TREB Total City of Toronto Total Toronto West Toronto W01 Toronto W02 Toronto W03 Toronto W04 Toronto W05 Toronto W06 Toronto W07 Toronto W08 Toronto W09 Toronto W10 Toronto Central Toronto C01 Toronto C02 Toronto C03 Toronto C04 Toronto C06 Toronto C07 Toronto C08 Toronto C09 Toronto C10 Toronto C11 Toronto C12 Toronto C13 Toronto C14 Toronto C15 Toronto East Toronto E01 Toronto E02 Toronto E03 Toronto E04 Toronto E05 Toronto E06 Toronto E07 Toronto E08 Toronto E09 Toronto E10 Toronto E11 10 $4,927,611 $492,761 $461,500 12 14 103% 32 7 $3,916,611 $559,516 $479,000 10 13 105% 31 1 $373,000 $373,000 $373,000 5 6 98% 77 0 - - - 0 0 - - 1 $373,000 $373,000 $373,000 1 0 98% 77 0 - - - 0 0 - - 0 - - - 0 0 - - 0 - - - 1 1 - - 0 - - - 2 2 - - 0 - - - 0 0 - - 0 - - - 1 1 - - 0 - - - 0 2 - - 0 - - - 0 0 - - 6 $3,543,611 $590,602 $569,806 5 5 106% 24 0 - - - 0 0 - - 1 $660,611 $660,611 $660,611 0 0 103% 22 1 $479,000 $479,000 $479,000 1 0 100% 8 0 - - - 0 1 - - 0 - - - 0 0 - - 1 $452,000 $452,000 $452,000 0 0 98% 20 0 - - - 0 0 - - 2 $1,481,000 $740,500 $740,500 4 4 114% 18 0 - - - 0 0 - - 0 - - - 0 0 - - 0 - - - 0 0 - - 0 - - - 0 0 - - 0 - - - 0 0 - - 1 $471,000 $471,000 $471,000 0 0 99% 57 0 - - - 0 2 - - 0 - - - 0 0 - - 0 - - - 0 1 - - 0 - - - 0 0 - - 0 - - - 0 1 - - 0 - - - 0 0 - - 0 - - - 0 0 - - 0 - - - 0 0 - - 0 - - - 0 0 - - 0 - - - 0 0 - - 0 - - - 0 0 - - 0 - - - 0 0 - - 1 1 1 1 2 3 4 5
- 21. Toronto Real Estate Board Market Watch, June 2018 SUMMARY OF EXISTING HOME TRANSACTIONS DETACHED CONDOMINIUM, JUNE 2018 ALL TREB AREAS 21 Sales Dollar Volume Average Price Median Price New Listings Active Listings Avg. SP / LP Avg. DOM TREB Total Halton Region Burlington Halton Hills Milton Oakville Peel Region Brampton Caledon Mississauga City of Toronto Toronto West Toronto Central Toronto East York Region Aurora E. Gwillimbury Georgina King Markham Newmarket Richmond Hill Vaughan Whitchurch-Stouffville Durham Region Ajax Brock Clarington Oshawa Pickering Scugog Uxbridge Whitby Dufferin County Orangeville Simcoe County Adjala-Tosorontio Bradford West GwillimburyEssa Innisfil New Tecumseth 8 $5,712,000 $714,000 $550,000 17 28 98% 66 0 - - - 4 3 - - 0 - - - 3 3 - - 0 - - - 0 0 - - 0 - - - 1 0 - - 0 - - - 0 0 - - 1 $1,100,000 $1,100,000 $1,100,000 1 3 97% 108 0 - - - 0 1 - - 1 $1,100,000 $1,100,000 $1,100,000 1 2 97% 108 0 - - - 0 0 - - 1 $1,450,000 $1,450,000 $1,450,000 3 4 98% 31 0 - - - 0 0 - - 1 $1,450,000 $1,450,000 $1,450,000 0 0 98% 31 0 - - - 3 4 - - 0 - - - 0 1 - - 0 - - - 0 0 - - 0 - - - 0 0 - - 0 - - - 0 0 - - 0 - - - 0 0 - - 0 - - - 0 1 - - 0 - - - 0 0 - - 0 - - - 0 0 - - 0 - - - 0 0 - - 0 - - - 0 0 - - 1 $451,000 $451,000 $451,000 3 1 100% 11 1 $451,000 $451,000 $451,000 3 1 100% 11 0 - - - 0 0 - - 0 - - - 0 0 - - 0 - - - 0 0 - - 0 - - - 0 0 - - 0 - - - 0 0 - - 0 - - - 0 0 - - 0 - - - 0 0 - - 0 - - - 0 0 - - 0 - - - 0 0 - - 5 $2,711,000 $542,200 $540,000 6 16 97% 76 0 - - - 0 0 - - 0 - - - 0 0 - - 0 - - - 0 0 - - 0 - - - 0 0 - - 5 $2,711,000 $542,200 $540,000 6 16 97% 76 1 1 1 1 2 3 4 5
- 22. Toronto Real Estate Board Market Watch, June 2018 SUMMARY OF EXISTING HOME TRANSACTIONS DETACHED CONDOMINIUM, JUNE 2018 CITY OF TORONTO MUNICIPAL BREAKDOWN 22 Sales Dollar Volume Average Price Median Price New Listings Active Listings Avg. SP / LP Avg. DOM TREB Total City of Toronto Total Toronto West Toronto W01 Toronto W02 Toronto W03 Toronto W04 Toronto W05 Toronto W06 Toronto W07 Toronto W08 Toronto W09 Toronto W10 Toronto Central Toronto C01 Toronto C02 Toronto C03 Toronto C04 Toronto C06 Toronto C07 Toronto C08 Toronto C09 Toronto C10 Toronto C11 Toronto C12 Toronto C13 Toronto C14 Toronto C15 Toronto East Toronto E01 Toronto E02 Toronto E03 Toronto E04 Toronto E05 Toronto E06 Toronto E07 Toronto E08 Toronto E09 Toronto E10 Toronto E11 8 $5,712,000 $714,000 $550,000 17 28 98% 66 1 $1,450,000 $1,450,000 $1,450,000 3 4 98% 31 0 - - - 0 0 - - 0 - - - 0 0 - - 0 - - - 0 0 - - 0 - - - 0 0 - - 0 - - - 0 0 - - 0 - - - 0 0 - - 0 - - - 0 0 - - 0 - - - 0 0 - - 0 - - - 0 0 - - 0 - - - 0 0 - - 0 - - - 0 0 - - 1 $1,450,000 $1,450,000 $1,450,000 0 0 98% 31 0 - - - 0 0 - - 0 - - - 0 0 - - 0 - - - 0 0 - - 0 - - - 0 0 - - 0 - - - 0 0 - - 0 - - - 0 0 - - 0 - - - 0 0 - - 0 - - - 0 0 - - 0 - - - 0 0 - - 0 - - - 0 0 - - 0 - - - 0 0 - - 0 - - - 0 0 - - 1 $1,450,000 $1,450,000 $1,450,000 0 0 98% 31 0 - - - 0 0 - - 0 - - - 3 4 - - 0 - - - 0 0 - - 0 - - - 0 0 - - 0 - - - 0 0 - - 0 - - - 0 0 - - 0 - - - 0 0 - - 0 - - - 0 0 - - 0 - - - 0 0 - - 0 - - - 2 3 - - 0 - - - 0 0 - - 0 - - - 1 1 - - 0 - - - 0 0 - - 1 1 1 1 2 3 4 5
- 23. Toronto Real Estate Board Market Watch, June 2018 SUMMARY OF EXISTING HOME TRANSACTIONS CO-OWNERSHIP APARTMENT, JUNE 2018 ALL TREB AREAS 23 Sales Dollar Volume Average Price Median Price New Listings Active Listings Avg. SP / LP Avg. DOM TREB Total Halton Region Burlington Halton Hills Milton Oakville Peel Region Brampton Caledon Mississauga City of Toronto Toronto West Toronto Central Toronto East York Region Aurora E. Gwillimbury Georgina King Markham Newmarket Richmond Hill Vaughan Whitchurch-Stouffville Durham Region Ajax Brock Clarington Oshawa Pickering Scugog Uxbridge Whitby Dufferin County Orangeville Simcoe County Adjala-Tosorontio Bradford West GwillimburyEssa Innisfil New Tecumseth 2 $489,000 $244,500 $244,500 8 9 94% 36 0 - - - 0 0 - - 0 - - - 0 0 - - 0 - - - 0 0 - - 0 - - - 0 0 - - 0 - - - 0 0 - - 0 - - - 0 0 - - 0 - - - 0 0 - - 0 - - - 0 0 - - 0 - - - 0 0 - - 2 $489,000 $244,500 $244,500 8 9 94% 36 1 $130,000 $130,000 $130,000 3 3 81% 65 1 $359,000 $359,000 $359,000 5 6 100% 6 0 - - - 0 0 - - 0 - - - 0 0 - - 0 - - - 0 0 - - 0 - - - 0 0 - - 0 - - - 0 0 - - 0 - - - 0 0 - - 0 - - - 0 0 - - 0 - - - 0 0 - - 0 - - - 0 0 - - 0 - - - 0 0 - - 0 - - - 0 0 - - 0 - - - 0 0 - - 0 - - - 0 0 - - 0 - - - 0 0 - - 0 - - - 0 0 - - 0 - - - 0 0 - - 0 - - - 0 0 - - 0 - - - 0 0 - - 0 - - - 0 0 - - 0 - - - 0 0 - - 0 - - - 0 0 - - 0 - - - 0 0 - - 0 - - - 0 0 - - 0 - - - 0 0 - - 0 - - - 0 0 - - 0 - - - 0 0 - - 0 - - - 0 0 - - 0 - - - 0 0 - - 1 1 1 1 2 3 4 5
- 24. Toronto Real Estate Board Market Watch, June 2018 SUMMARY OF EXISTING HOME TRANSACTIONS CO-OWNERSHIP APARTMENT, JUNE 2018 CITY OF TORONTO MUNICIPAL BREAKDOWN 24 Sales Dollar Volume Average Price Median Price New Listings Active Listings Avg. SP / LP Avg. DOM TREB Total City of Toronto Total Toronto West Toronto W01 Toronto W02 Toronto W03 Toronto W04 Toronto W05 Toronto W06 Toronto W07 Toronto W08 Toronto W09 Toronto W10 Toronto Central Toronto C01 Toronto C02 Toronto C03 Toronto C04 Toronto C06 Toronto C07 Toronto C08 Toronto C09 Toronto C10 Toronto C11 Toronto C12 Toronto C13 Toronto C14 Toronto C15 Toronto East Toronto E01 Toronto E02 Toronto E03 Toronto E04 Toronto E05 Toronto E06 Toronto E07 Toronto E08 Toronto E09 Toronto E10 Toronto E11 2 $489,000 $244,500 $244,500 8 9 94% 36 2 $489,000 $244,500 $244,500 8 9 94% 36 1 $130,000 $130,000 $130,000 3 3 81% 65 0 - - - 0 0 - - 0 - - - 0 0 - - 0 - - - 0 0 - - 0 - - - 0 0 - - 1 $130,000 $130,000 $130,000 2 2 81% 65 0 - - - 1 1 - - 0 - - - 0 0 - - 0 - - - 0 0 - - 0 - - - 0 0 - - 0 - - - 0 0 - - 1 $359,000 $359,000 $359,000 5 6 100% 6 0 - - - 0 0 - - 0 - - - 1 1 - - 0 - - - 1 1 - - 0 - - - 0 1 - - 0 - - - 0 0 - - 0 - - - 0 0 - - 0 - - - 1 1 - - 0 - - - 0 0 - - 1 $359,000 $359,000 $359,000 1 1 100% 6 0 - - - 0 0 - - 0 - - - 0 0 - - 0 - - - 0 0 - - 0 - - - 1 1 - - 0 - - - 0 0 - - 0 - - - 0 0 - - 0 - - - 0 0 - - 0 - - - 0 0 - - 0 - - - 0 0 - - 0 - - - 0 0 - - 0 - - - 0 0 - - 0 - - - 0 0 - - 0 - - - 0 0 - - 0 - - - 0 0 - - 0 - - - 0 0 - - 0 - - - 0 0 - - 0 - - - 0 0 - - 1 1 1 1 2 3 4 5
- 25. Toronto Real Estate Board Market Watch, June 2018 FOCUS ON THE MLS HOME PRICE INDEX INDEX AND BENCHMARK PRICE, JUNE 2018 ALL TREB AREAS 25 Composite Single-Family Detached Single-Family Attached Townhouse Apartment Index Benchmark Yr./Yr. % Chg. Index Benchmark Yr./Yr. % Chg. Index Benchmark Yr./Yr. % Chg. Index Benchmark Yr./Yr. % Chg. Index Benchmark Yr./Yr. % Chg. TREB Total Halton Region Burlington Halton Hills Milton Oakville Peel Region Brampton Caledon Mississauga City of Toronto York Region Aurora East Gwillimbury Georgina King Markham Newmarket Richmond Hill Vaughan Whitchurch-Stouffville Durham Region Ajax Brock Clarington Oshawa Pickering Scugog Uxbridge Whitby Dufferin County Orangeville Simcoe County Adjala-Tosorontio Bradford West GwillimburyEssa Innisfil New Tecumseth 254.0 $772,100 -4.76% 251.5 $931,600 -9.30% 256.6 $721,800 -7.20% 256.1 $568,200 -3.65% 251.5 $502,400 7.52% 263.4 $849,300 -4.39% 260.5 $960,800 -6.96% 270.5 $692,000 -3.25% 284.4 $524,600 -3.03% 256.6 $474,500 6.92% 259.8 $705,800 -5.22% 251.6 $851,700 -10.72% 278.4 $667,900 0.18% 292.7 $537,900 -2.40% 255.6 $420,700 6.68% 245.1 $725,400 -2.74% 243.8 $793,200 -3.37% 251.2 $569,200 -0.95% 257.8 $414,300 -2.01% 243.9 $493,200 6.74% 248.7 $737,200 -1.31% 244.5 $875,000 -2.20% 257.1 $621,400 -0.92% 258.3 $427,700 -2.75% 253.8 $516,900 8.55% 276.5 $1,011,400 -5.28% 276.4 $1,168,400 -6.75% 283.1 $790,500 -7.21% 282.4 $611,000 -3.78% 259.0 $497,500 6.76% 244.1 $693,200 -3.10% 241.7 $853,400 -4.84% 246.4 $630,800 -3.94% 241.7 $518,900 -4.13% 239.2 $411,100 4.73% 246.3 $624,600 -3.49% 240.8 $703,300 -3.83% 247.6 $580,700 -3.13% 246.4 $450,400 -2.18% 225.9 $337,200 -2.12% 218.2 $801,300 -6.27% 217.7 $827,500 -6.97% 243.9 $602,500 -6.91% - - - 239.3 $581,700 7.74% 244.4 $725,300 -2.51% 247.4 $988,100 -5.72% 244.8 $675,100 -4.90% 240.0 $539,500 -4.80% 241.4 $425,500 5.83% 259.2 $840,200 1.29% 255.1 $1,119,400 -7.14% 266.1 $887,100 -3.52% 262.9 $634,300 0.46% 257.8 $529,300 9.10% 257.1 $868,000 -14.70% 262.9 $1,000,400 -16.67% 257.1 $743,800 -16.36% 237.3 $607,500 -10.72% 221.7 $487,400 1.33% 253.6 $839,200 -16.25% 254.9 $962,900 -17.05% 252.0 $649,900 -17.49% 236.6 $646,900 -13.46% 247.0 $516,300 -5.07% 230.6 $787,900 -17.67% 235.3 $838,600 -17.38% 240.0 $502,000 -15.31% - - - - - - 237.4 $452,400 -18.05% 243.7 $459,500 -18.00% 243.5 $480,100 -17.35% - - - - - - 233.4 $976,500 -14.38% 234.9 $977,200 -14.71% 224.7 $526,200 -19.11% - - - 231.5 $633,200 6.88% 263.5 $913,100 -13.89% 284.3 $1,169,600 -16.31% 264.8 $791,900 -16.15% 234.6 $619,200 -5.44% 213.4 $510,800 0.33% 234.0 $689,500 -16.19% 235.7 $794,500 -16.89% 231.2 $544,600 -17.46% 227.8 $473,000 -15.50% 265.6 $447,400 -3.56% 278.3 $999,800 -16.50% 299.2 $1,271,500 -18.00% 272.2 $827,300 -18.43% 233.1 $590,300 -17.55% 226.5 $460,900 -0.74% 251.6 $910,000 -10.84% 245.1 $1,018,900 -13.54% 255.9 $775,200 -13.55% 261.7 $711,600 -9.23% 223.3 $515,300 6.38% 258.1 $889,400 -17.04% 259.3 $930,200 -17.45% 227.9 $626,000 -15.15% 208.3 $373,900 -15.08% 251.7 $559,300 -6.64% 239.2 $558,600 -8.49% 235.4 $611,700 -8.69% 244.3 $487,900 -8.95% 241.5 $383,000 -9.96% 241.7 $412,100 -0.62% 241.4 $594,700 -9.76% 240.8 $646,000 -10.35% 244.6 $527,800 -10.80% 227.4 $415,700 -10.12% 230.1 $373,000 2.04% 195.1 $354,900 -4.32% 196.3 $358,300 -4.29% - - - - - - - - - 233.3 $492,500 -7.60% 227.0 $546,700 -7.61% 227.4 $434,400 -8.08% 267.7 $419,400 -12.63% 218.3 $323,600 -0.18% 243.7 $464,000 -8.86% 236.1 $503,900 -9.05% 259.1 $433,700 -7.83% 261.1 $324,200 -10.70% 233.7 $274,000 0.60% 243.8 $653,800 -7.30% 238.8 $743,800 -7.76% 247.8 $578,300 -6.84% 234.6 $418,900 -9.98% 276.3 $513,600 -2.54% 227.5 $594,000 -2.07% 235.2 $609,300 -1.84% 211.8 $443,300 -6.03% - - - - - - 225.7 $689,800 -5.25% 224.6 $693,600 -5.03% 224.5 $550,900 -3.98% - - - - - - 239.7 $624,200 -9.82% 241.0 $693,100 -10.28% 242.6 $534,400 -10.31% 204.2 $371,800 -9.28% 226.7 $411,000 -0.35% 257.2 $589,500 -0.58% 268.2 $611,200 -0.74% 249.7 $467,900 -1.15% - - - - - - 257.2 $589,500 -0.58% 268.2 $611,200 -0.74% 249.7 $467,900 -1.15% - - - - - - 244.4 $548,700 -8.36% 240.6 $559,300 -7.99% 251.4 $471,100 -7.16% - - - - - - 215.2 $647,600 -9.81% 214.9 $648,200 -9.90% - - - - - - - - - 251.1 $611,900 -13.83% 235.9 $645,300 -13.81% 258.9 $538,100 -11.88% - - - - - - 253.4 $484,100 -1.21% 250.6 $499,700 -2.64% 258.5 $402,500 0.27% - - - - - - 251.4 $486,700 -9.47% 252.4 $487,800 -8.82% 247.9 $379,000 -10.28% - - - - - - 219.6 $521,800 -6.47% 215.1 $545,200 -7.96% 231.9 $420,300 -5.35% - - - - - -
- 26. Toronto Real Estate Board Market Watch, June 2018 FOCUS ON THE MLS HOME PRICE INDEX INDEX AND BENCHMARK PRICE, JUNE 2018 CITY OF TORONTO 26 Composite Single-Family Detached Single-Family Attached Townhouse Apartment Index Benchmark Yr./Yr. % Chg. Index Benchmark Yr./Yr. % Chg. Index Benchmark Yr./Yr. % Chg. Index Benchmark Yr./Yr. % Chg. Index Benchmark Yr./Yr. % Chg. TREB Total City of Toronto Toronto W01 Toronto W02 Toronto W03 Toronto W04 Toronto W05 Toronto W06 Toronto W07 Toronto W08 Toronto W09 Toronto W10 Toronto C01 Toronto C02 Toronto C03 Toronto C04 Toronto C06 Toronto C07 Toronto C08 Toronto C09 Toronto C10 Toronto C11 Toronto C12 Toronto C13 Toronto C14 Toronto C15 Toronto E01 Toronto E02 Toronto E03 Toronto E04 Toronto E05 Toronto E06 Toronto E07 Toronto E08 Toronto E09 Toronto E10 Toronto E11 254.0 $772,100 -4.76% 251.5 $931,600 -9.30% 256.6 $721,800 -7.20% 256.1 $568,200 -3.65% 251.5 $502,400 7.52% 259.2 $840,200 1.29% 255.1 $1,119,400 -7.14% 266.1 $887,100 -3.52% 262.9 $634,300 0.46% 257.8 $529,300 9.10% 251.1 $1,012,000 12.60% 247.0 $1,288,900 9.10% 266.7 $1,028,400 7.54% 258.0 $546,100 8.49% 248.2 $561,200 16.31% 272.7 $969,900 3.53% 259.2 $1,096,500 -0.23% 295.0 $904,200 -0.77% 270.6 $637,600 7.21% 273.2 $585,800 15.81% 287.1 $741,000 1.41% 289.4 $786,700 -1.09% 282.8 $724,300 0.57% 274.9 $560,800 15.12% 273.1 $470,200 15.23% 258.0 $660,700 3.37% 259.2 $816,300 -2.15% 246.1 $711,600 2.20% 233.3 $551,300 6.82% 260.9 $382,100 14.83% 239.7 $568,900 5.09% 241.5 $800,900 -4.92% 221.5 $646,800 -4.32% 232.1 $421,500 8.21% 261.9 $344,100 24.95% 210.3 $615,900 3.85% 275.8 $880,600 -1.36% 224.3 $679,700 1.04% 295.8 $879,700 -1.37% 175.7 $445,200 11.13% 233.9 $1,002,700 -1.56% 248.2 $1,075,700 -2.09% 220.1 $902,500 0.36% - - - 155.9 $632,200 7.15% 221.8 $884,300 4.52% 214.5 $1,121,200 -2.59% 212.4 $786,900 -0.28% 243.8 $586,400 3.00% 226.5 $471,600 11.03% 236.4 $595,100 2.52% 228.3 $851,400 -2.81% 207.1 $595,500 1.22% 274.0 $712,900 10.84% 239.9 $307,600 8.45% 239.7 $552,100 -0.95% 246.4 $739,200 -2.88% 246.9 $631,900 -2.60% 211.6 $450,600 4.39% 239.2 $332,200 0.76% 284.0 $703,600 8.15% 279.4 $1,058,100 -2.65% 271.3 $949,700 -1.92% 272.6 $775,100 0.22% 284.5 $592,300 9.51% 262.1 $1,253,700 2.58% 233.9 $1,868,800 -4.10% 274.0 $1,437,000 -1.86% 277.5 $1,239,200 4.44% 258.3 $735,900 7.71% 293.0 $1,531,900 -1.45% 270.6 $1,663,000 -5.91% 286.9 $1,063,900 -3.79% - - - 335.0 $881,200 8.20% 246.5 $1,521,200 -2.84% 248.4 $1,750,100 -5.23% 248.1 $1,161,500 -4.94% 309.8 $1,138,800 3.82% 233.0 $538,900 8.68% 278.4 $1,084,100 -5.34% 268.4 $1,146,400 -16.98% 210.8 $779,800 -10.11% 247.8 $664,600 5.40% 291.4 $644,400 9.92% 260.4 $900,900 -4.41% 300.5 $1,374,700 -14.51% 215.6 $771,500 -14.00% 243.8 $687,200 4.46% 241.2 $589,000 6.49% 262.1 $685,600 5.60% 273.9 $1,598,000 -3.04% 270.3 $1,289,500 -3.19% 267.0 $697,300 5.53% 261.3 $564,800 6.44% 185.4 $1,312,300 7.92% 139.9 $1,757,400 -1.06% 154.0 $1,253,200 -1.60% 295.2 $1,616,800 11.02% 210.0 $695,700 10.12% 267.3 $1,043,600 2.49% 250.3 $1,545,300 -10.80% 237.5 $1,173,300 -11.87% 271.4 $792,200 5.56% 277.4 $662,400 9.64% 265.1 $938,100 7.85% 213.4 $1,453,700 -0.37% 236.6 $1,047,600 -1.42% 217.9 $377,500 0.05% 307.3 $446,200 12.56% 219.6 $1,873,600 -6.63% 199.7 $2,140,300 -13.51% 260.3 $1,089,600 -12.97% 211.1 $844,600 -4.05% 277.1 $868,800 10.09% 246.1 $891,100 -5.78% 248.8 $1,326,800 -20.18% 222.5 $710,000 -18.91% 239.3 $691,800 -1.56% 245.2 $493,700 14.58% 264.0 $863,200 -3.47% 289.4 $1,565,600 -16.67% 236.6 $1,152,100 -13.96% 319.1 $859,300 -1.72% 252.3 $635,400 3.32% 247.6 $803,500 -7.54% 295.6 $1,387,900 -20.11% 244.8 $795,800 -21.39% 286.5 $685,700 -3.24% 221.9 $516,000 7.51% 333.1 $1,040,300 3.87% 327.4 $1,155,300 1.24% 341.7 $1,077,900 3.45% 374.7 $685,000 0.83% 303.1 $719,000 11.27% 287.3 $1,078,400 1.77% 251.1 $1,144,100 2.16% 301.3 $1,009,000 1.14% 304.8 $915,100 -1.42% 269.1 $735,700 3.02% 268.4 $825,700 0.68% 275.0 $927,100 -1.72% 258.3 $845,900 2.70% - - - 250.3 $365,600 12.19% 258.7 $639,000 -0.88% 244.4 $720,500 -5.34% 252.5 $608,400 -6.62% 251.0 $544,100 0.84% 288.6 $442,800 6.57% 247.6 $649,700 -3.70% 257.3 $906,100 -9.59% 250.6 $690,500 -11.10% 250.5 $544,800 -7.63% 236.0 $463,500 10.95% 259.6 $724,000 -6.18% 259.4 $740,900 -7.82% 262.2 $623,700 -7.02% 252.4 $624,200 3.06% 256.8 $543,100 7.22% 260.8 $639,300 -3.19% 263.3 $863,000 -12.93% 252.0 $658,900 -15.15% 260.6 $564,600 -6.86% 260.5 $446,100 10.62% 260.7 $629,100 -0.42% 249.7 $778,300 -7.35% 226.6 $587,400 -7.13% 267.1 $545,200 3.77% 279.3 $445,600 12.30% 250.1 $598,000 0.36% 244.3 $693,700 -7.32% 235.6 $576,300 -6.58% 282.3 $524,600 -0.56% 251.9 $472,500 9.00% 260.5 $730,200 -6.53% 248.5 $796,200 -8.91% 243.9 $632,400 -8.31% 310.4 $541,900 -3.48% 258.1 $416,100 14.51% 258.6 $565,600 -1.97% 262.7 $730,700 -7.43% 261.0 $591,100 -5.78% 198.0 $388,600 -1.64% 295.9 $441,600 8.95%
- 27. Toronto Real Estate Board Market Watch, June 2018 HISTORIC ANNUAL STATISTICS 27 Year Sales Average Price 2006 2007 2008 2009 2010 2011 2012 2013 2014 2015 2016 83,084 $351,941 93,193 $376,236 74,552 $379,347 87,308 $395,460 85,545 $431,276 89,096 $465,014 85,496 $497,130 87,049 $522,958 92,782 $566,624 101,213 $622,121 113,040 $729,837 2017 MONTHLY STATISTICS NOTES 1 - Sales, dollar volume, average sale prices and median sale prices are based on firm transactions entered into the TREB MLS® system between the first and last day of the month/period being reported. 2 - New listings entered into the TREB MLS® system between the first and last day of the month/period being reported. 3 - Active listings at the end of the last day of the month/period being reported. 4 - Ratio of the average selling price to the average listing price for firm transactions entered into the TREB MLS® system between the first and last day of the month/period being reported. 5 - Average number of days on the market for firm transactions entered into the TREB MLS® system between the first and last day of the month/period being reported. 6 - Due to past changes to TREB's service area, caution should be exercised when making historical comparisons. 7 - Past monthly and year-to-date figures are revised on a monthly basis. 8 - SNLR = Sales-to-New Listings Ratio. Calculated using a 12-month moving average (sales/new listings). 9 - Mos. Inv. = Months of Inventory. Calculated using a 12-month moving average (active listings/sales). 2018 MONTHLY STATISTICS *For historic annual sales and average price data over a longer time frame go to: January February March April May June July August September October November December Year to Date 3,989 $735,793 5,151 $767,763 7,194 $784,568 7,763 $804,842 7,743 $803,681 8,082 $807,871 - - - - - - - - - - - - 39,922 $784,086 January February March April May June July August September October November December Annual 5,154 $768,427 7,955 $876,363 11,953 $915,089 11,466 $918,241 10,066 $862,149 7,893 $791,929 5,870 $745,896 6,308 $730,907 6,334 $774,489 7,070 $780,386 7,327 $761,385 4,877 $734,824 92,273 $822,580 1,6,7 1,7 1,7 http://www.torontorealestateboard.com/market_news/market_watch/historic_stats/p df/TREB_historic_statistics.pdf Copyright® 2018 Toronto Real Estate Board $789,89339,922