Call Girls Bommasandra Just Call 👗 7737669865 👗 Top Class Call Girl Service B...
Intellect 1QFY18
1. Anand Rathi Share and Stock Brokers Limited (hereinafter “ARSSBL”) is a full-service brokerage and equities-research firm and the views expressed therein are solely of
ARSSBL and not of the companies which have been covered in the Research Report. This report is intended for the sole use of the Recipient. Disclosures and analyst
certifications are present in the Appendix.
Anand Rathi Research India Equities
Technology
Company Update
India I Equities
Mohit Jain
Research Analyst
+9122 6626 6531
mohitjain@rathi.com
Shobit Singhal
Research Associate
+9122 6626 6511
shobitsinghal@rathi.com
Key financials (YE Mar) FY15 FY16 FY17 FY18e FY19e
Sales (` m) 6,087 8,065 9,110 10,030 11,503
Net profit (` m) -829 -411 -243 521 938
EPS (`) -8.3 -3.9 -2.3 4.0 7.3
Growth (%) - NM NM NM 80.0
PE (x) NM NM NM 24.5 13.6
PBV (x) 1.6 1.7 1.7 1.5 1.4
RoE (%) -12.5 -6.6 -3.3 7.2 10.5
RoCE (%) -15.6 -9.8 -5.7 6.7 9.5
Dividend yield (%) - - - - -
Net debt/equity (x) -0.4 -0.1 0.1 -0.1 -0.1
Source: Company, Anand Rathi Research
`
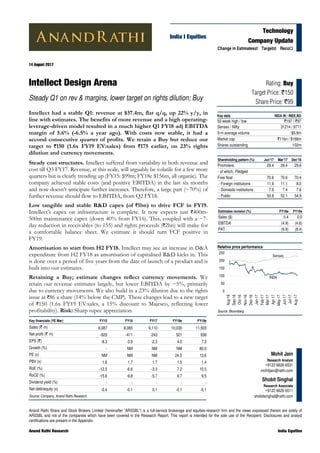
Rating: Buy
Target Price: `150
Share Price: `99
Key data INDA IN / INEE.BO
52-week high / low `197 / `97
Sensex / Nifty 31214 / 9711
3-m average volume $0.9m
Market cap `11bn / $168m
Shares outstanding 102m
Shareholding pattern (%) Jun'17 Mar'17 Dec'16
Promoters 29.4 29.4 29.6
- of which, Pledged -
Free float 70.6 70.6 70.4
- Foreign institutions 11.9 11.1 8.0
- Domestic institutions 7.9 7.4 7.6
- Public 50.9 52.1 54.9
Change in EstimatesTargetReco
14 August 2017
Intellect Design Arena
Steady Q1 on rev & margins, lower target on rights dilution; Buy
Intellect had a stable Q1: revenue at $37.4m, flat q/q, up 22% y/y, in
line with estimates. The benefits of more revenue and a high operating-
leverage-driven model resulted in a much higher Q1 FY18 adj EBITDA
margin of 5.6% (-6.5% a year ago). With costs now stable, it had a
second consecutive quarter of profits. We retain a Buy but reduce our
target to `150 (1.6x FY19 EV:sales) from `175 earlier, on 23% rights
dilution and currency movements.
Steady cost structures. Intellect suffered from variability in both revenue and
cost till Q3 FY17. Revenue, at this scale, will arguably be volatile for a few more
quarters but is clearly trending up (FY15: $99m; FY18e $156m, all organic). The
company achieved stable costs (and positive EBITDA) in the last six months
and now doesn’t anticipate further increases. Therefore, a large part (~70%) of
further revenue should flow to EBITDA, from Q2 FY18.
Low tangible and stable R&D capex (of `1bn) to drive FCF in FY19.
Intellect’s capex on infrastructure is complete. It now expects just `400m-
500m maintenance capex (down 40% from FY16). This, coupled with a ~7-
day reduction in receivables (to 155) and rights proceeds (`2bn) will make for
a comfortable balance sheet. We estimate it should turn FCF positive in
FY19.
Amortisation to start from H2 FY18. Intellect may see an increase in D&A
expenditure from H2 FY18 as amortisation of capitalised R&D kicks in. This
is done over a period of five years from the date of launch of a product and is
built into our estimates.
Retaining a Buy; estimate changes reflect currency movements. We
retain our revenue estimates largely, but lower EBITDA by ~5%, primarily
due to currency movements. We also build in a 23% dilution due to the rights
issue at `86 a share (14% below the CMP). These changes lead to a new target
of `150 (1.6x FY19 EV:sales, a 15% discount to Majesco, reflecting lower
profitability). Risk: Sharp rupee appreciation.
Relative price performance
Source: Bloomberg
INDA
Sensex
0
50
100
150
200
250
Aug-16
Sep-16
Oct-16
Nov-16
Dec-16
Jan-17
Feb-17
Mar-17
Apr-17
May-17
Jun-17
Jul-17
Aug-17
Estimates revision (%) FY18e FY19e
Sales ($) 0.4 0.0
EBITDA (4.9) (4.8)
PAT (9.9) (8.4)
3. 14 August 2017 Intellect Design Arena – Steady Q1 on rev & margins, lower target on rights dilution; Buy
Anand Rathi Research 3
Result Highlights
Q1 FY18 Results at a Glance
Fig 8 – Quarterly result (` m)
Year-end: Mar Q1 FY18 % q/q % y/y FY17 FY16 % y/y
Sales ($ m) 37 0.1 21.7 137 124 10.6
Sales 2,412 (3.7) 17.8 9,110 8,065 12.9
EBITDA 135 (13.4) NM (136) (555) NM
EBITDA margin (%) 5.6 -63 bps 1211 bps (1.5) (6.9) 540 bps
EBIT 77 (20.5) NM (377) (763) NM
EBIT margin (%) 3.2 -67 bps 1256 bps (4.1) (9.5) 532 bps
PBT 91 22.6 NM (239) (513) NM
Tax (36) NM 3.8 (28) 91 NM
Tax rate (%) (40.1) NM NM 11.9 (17.7) NM
Net Income 7 (95.0) NM (202) (411) NM
Source: Company
Fig 7 – Segment-wise results
Q1 FY17 Q2 FY17 Q3 FY17 Q4 FY17 Q1 FY18 Q/q % Y/y %
Revenues ($ m) 31 35 34 37 37 0.1 21.7
Growth Y/y % 1 10 14 16 22 524bps 2055bps
Revenues (` m) 2,048 2,294 2,265 2,504 2,412 -3.7 17.8
Eff. exchange rate 66.6 65.2 67.5 67.0 64.5 -3.8 -3.2
Employees (EoP) -est 4,220 4,240 4,200 4,180 4,280 2.4 1.4
Revenue Productivity ($ ‘000/employee) 7.3 8.3 8.0 8.9 8.7 -2.2 20.0
CoR (excluding D&A) (1,648) (1,793) (1,857) (1,794) (1,774) -1.1 7.7
As % of revenue -80 -78 -82 -72 -74 -190bps 692bps
SG&A (533) (516) (552) (553) (502) -9.2 -5.7
As % of revenue -26 -22 -24 -22 -21 127bps 519bps
EBITDA (133) (14) (145) 156 135 -13.4 NM
EBITDA margin % -6 -1 -6 6 6 -63bps 1211bps
EBIT -192 -75 -206 96 77 -20.5 NM
EBIT margin % -9 -3 -9 4 3 -67bps 1256bps
Other Income 175 (48) 106 18 56 213.9 -68.2
Forex gain / loss 142 15 50 (70) 10
PBT -33 -147 -133 74 91 22.6 NM
PBT margin % -2 -6 -6 3 4 81bps 536bps
Taxes (35) (27) (37) 71 (36) NM 3.8
ETR % 107 18 28 95 -40 NM NM
PAT (68) (174) (170) 145 54 -62.4 NM
PAT margin % -3 -8 -8 6 2 -352bps 556bps
Source: Company, Anand Rathi Research
Note: Analyst judgement used for R&D costs. May not match with the reported numbers. This is to normalize reported numbers for management discretion on capitalization and expensing out.
4. 14 August 2017 Intellect Design Arena – Steady Q1 on rev & margins, lower target on rights dilution; Buy
Anand Rathi Research 4
Conference call takeaways/other
details
There was no conference call in Q1 FY18 as the company was in a rights
issue process.
Here are the other details from results:
The business environment overall continues to be strong for BFSI
products as judged by the deal pipeline. Therefore, Intellect’s revenue
continues to scale up. We expect it to end the year with a comfortable
14% revenue growth in dollar terms.
The rights issue closed on 9th Aug’17.
R&D expenditure continues at ~`1bn a year. In Q1 FY18, there seems
to be additional capitalisation of `26m compared to Q4 FY17. This
benefitted the reported EBITDA by the same amount.
Intellect has a workforce of ~4,300, of which 1,500-1,600 are deployed
in R&D (new product developments).
The tax rate is a function of which subsidiaries and regions are turning
profitable. Therefore, “percent” may be misleading regarding an
effective tax rate. In absolute terms, the tax rate may hold at similar
levels as in Q1 FY18.
The Bangladesh subsidiary had a large proportion of revenues this
quarter and that led to the dramatic increase in minority interest for the
quarter. This will be normalized from next quarter.
Capex would be low as infrastructure needs are complete and the
business model is non-linear. R&D will be the major recurring capex.
Amortisation of new software will start in Q2 FY18 and increase
overall depreciation in FY19. We expect `130m amortization vs.
`1,000m R&D capitalisation in FY19.
Fig 9 – Intellect Design – License Revenues (US$m)
Source: Bloomberg, Anand Rathi Research
-
5.0
10.0
15.0
20.0
25.0
30.0
1QFY15
2QFY15
3QFY15
4QFY15
1QFY16
2QFY16
3QFY16
4QFY16
1QFY17
2QFY17
3QFY17
4QFY17
1QFY18
License + AMC Implementation and Support
US$m
5. 14 August 2017 Intellect Design Arena – Steady Q1 on rev & margins, lower target on rights dilution; Buy
Anand Rathi Research 5
Valuations
We have valued the stock on EV/sales, of 1.6x FY19e and an implied PE
of 20x. We retain our Buy recommendation with a new target of `150,
reflecting our optimism regarding Intellect’s ability to scale up revenues and
the efficacy of the cost-management programs in Q4 FY17 and Q1 FY18.
The company needs to deliver growth to create value and generate returns
for shareholders. Since most of its costs are fixed, it tends to suffer greater
losses in periods of slow growth (as in most of FY17). We believe that, at
this stage, the single most important variable for it is revenue growth. We,
therefore, continue to value it on EV:sales.
Capex is almost complete and will continue to trend lower, at ~`300m-
400m, further requirement being restricted to new-product development,
estimated at `1bn a year.
Revenue growth is coming along well, adjusted for overall weakness in the
industry. Margins are also turning out to be better now as the company
focuses on cost rationalisation and balances out disproportionate spending
on SG&A.
The positive thing about Intellect is that it can, at its discretion, decide to
cut costs as and when needed; it exercised this option in Q4 FY17 to
demonstrate the profitability of the underlying business model. We saw this
continued focus on managing costs in Q1 FY18.
Fig 10 – Change in estimates
FY18 FY19
(` m) New Old Chg % New Old Chg %
Revenues ($ m) 156 155 0.4 178 178 -
Revenues 10,030 10,383 (3.4) 11,503 11,957 (3.8)
EBITDA 932 980 (4.9) 1,503 1,578 (4.8)
EBITDA margin % 9.3 9.4 -15 bps 13.1 13.2 -13 bps
EBIT 678 734 (7.6) 1,133 1,302 (13.0)
EBIT margin % 6.8 7.1 -31 bps 9.9 10.9 -104 bps
PBT 693 768 (9.8) 1,177 1,283 (8.3)
Net Profit 588 653 (9.9) 940 1,026 (8.4)
Source: Anand Rathi Research
Fig 11 – 1-year forward EV/Sales
Source: Bloomberg, Anand Rathi Research
1.0
1.5
2.0
2.5
3.0
3.5
Jul-15
Sep-15
Nov-15
Jan-16
Mar-16
May-16
Jul-16
Sep-16
Nov-16
Jan-17
Mar-17
May-17
Jul-17
6. 14 August 2017 Intellect Design Arena – Steady Q1 on rev & margins, lower target on rights dilution; Buy
Anand Rathi Research 6
Risks
Business: Intellect operates in an industry (BFSI/discretionary
spending), currently traversing some turbulence on account of BRexit.
Its revenue targets/guidance may be affected by some of these
unforeseen circumstances. Of its revenue, 33% arises from Europe.
Sharp rupee appreciation.
7. Appendix
Analyst Certification
The views expressed in this Research Report accurately reflect the personal views of the analyst(s) about the subject securities or issuers and no part of the
compensation of the research analyst(s) was, is, or will be directly or indirectly related to the specific recommendations or views expressed by the research
analyst(s) in this report. The research analysts are bound by stringent internal regulations and also legal and statutory requirements of the Securities and Exchange
Board of India (hereinafter “SEBI”) and the analysts’ compensation are completely delinked from all the other companies and/or entities of Anand Rathi, and have
no bearing whatsoever on any recommendation that they have given in the Research Report.
Important Disclosures on subject companies
Rating and Target Price History (as of 14 August 2017)
Date Rating
TP
(`)
Share
Price (`)
1 01-Oct-15 Buy 230 171
2 04-Apr-16 Buy 290 236
3 07-Feb-17 Buy 175 133
Anand Rathi Ratings Definitions
Analysts’ ratings and the corresponding expected returns take into account our definitions of Large Caps (>US$1bn) and Mid/Small Caps (<US$1bn) as described
in the Ratings Table below:
Ratings Guide (12 months)
Buy Hold Sell
Large Caps (>US$1bn) >15% 5-15% <5%
Mid/Small Caps (<US$1bn) >25% 5-25% <5%
Research Disclaimer and Disclosure inter-alia as required under Securities and Exchange Board of India (Research Analysts) Regulations, 2014
Anand Rathi Share and Stock Brokers Ltd. (hereinafter refer as ARSSBL) (Research Entity) is a subsidiary of Anand Rathi Financial Services Ltd. ARSSBL is a
corporate trading and clearing member of Bombay Stock Exchange Ltd, National Stock Exchange of India Ltd. (NSEIL), Multi Stock Exchange of India Ltd (MCX-
SX), United Stock Exchange and also depository participant with National Securities Depository Ltd (NSDL) and Central Depository Services Ltd. ARSSBL is
engaged in the business of Stock Broking, Depository Participant and Mutual Fund distributor.
The research analysts, strategists, or research associates principally responsible for the preparation of Anand Rathi research have received compensation based
upon various factors, including quality of research, investor client feedback, stock picking, competitive factors and firm revenues.
General Disclaimer: This Research Report (hereinafter called “Report”) is meant solely for use by the recipient and is not for circulation. This Report does not
constitute a personal recommendation or take into account the particular investment objectives, financial situations, or needs of individual clients. The
recommendations, if any, made herein are expression of views and/or opinions and should not be deemed or construed to be neither advice for the purpose of
purchase or sale of any security, derivatives or any other security through ARSSBL nor any solicitation or offering of any investment /trading opportunity on behalf
of the issuer(s) of the respective security (ies) referred to herein. These information / opinions / views are not meant to serve as a professional investment guide for
the readers. No action is solicited based upon the information provided herein. Recipients of this Report should rely on information/data arising out of their own
investigations. Readers are advised to seek independent professional advice and arrive at an informed trading/investment decision before executing any trades or
making any investments. This Report has been prepared on the basis of publicly available information, internally developed data and other sources believed by
ARSSBL to be reliable. ARSSBL or its directors, employees, affiliates or representatives do not assume any responsibility for, or warrant the accuracy,
completeness, adequacy and reliability of such information / opinions / views. While due care has been taken to ensure that the disclosures and opinions given are
fair and reasonable, none of the directors, employees, affiliates or representatives of ARSSBL shall be liable for any direct, indirect, special, incidental,
consequential, punitive or exemplary damages, including lost profits arising in any way whatsoever from the information / opinions / views contained in this Report.
The price and value of the investments referred to in this Report and the income from them may go down as well as up, and investors may realize losses on any
investments. Past performance is not a guide for future performance. ARSSBL does not provide tax advice to its clients, and all investors are strongly advised to
consult with their tax advisers regarding taxation aspects of any potential investment.
Opinions expressed are our current opinions as of the date appearing on this Research only. We do not undertake to advise you as to any change of our views
expressed in this Report. Research Report may differ between ARSSBL’s RAs and/ or ARSSBL’s associate companies on account of differences in research
methodology, personal judgment and difference in time horizons for which recommendations are made. User should keep this risk in mind and not hold ARSSBL,
its employees and associates responsible for any losses, damages of any type whatsoever.
INDA
1
2
3
0
50
100
150
200
250
300
Dec-14
Mar-15
May-15
Jul-15
Oct-15
Dec-15
Mar-16
May-16
Aug-16
Oct-16
Dec-16
Mar-17
May-17
Aug-17