THREE DIMENSIONAL ELECTRON MICROSCOPY AND IN SILICO
Kerf Patterning
1. Kerf Patterning on Animal Cremains: Preliminary Analysis
of Microscopy Methods
Christopher E. Barrett1, Nambi Gamet1
1Anthropology Department, Western Washington University, 516 High St., Bellingham, WA 98225
Abstract
Introduction
Materials & Methods
Results
Discussion
In Forensic science reconstruction methodologies are critical to the
assessment and authentication of human behavior after time of action.
Archeological samples can present evidence of burning and thus provide
time depth to the issues involved (Ubelaker, 2009). Fire has been a
common method for the destruction of evidence in homicides, accidental
deaths, bombings, and aircraft accidence (Porta et al., 2013; Ubelaker,
2009; Alunni et al., 2014). Fire can be employed to destroy forensic
evidence in order to mislead or remove identification and reconstruction
of behavior. Contemporary research and case studies have greatly
augmented knowledge regarding the effects of extreme heat on
incinerated remains or cremains. Resulting from these scholarly efforts,
enhanced interpretation is now possible on such issues as:
• the extent of recovery
• reconstruction
• trauma
• individual identification
• color variation
• DNA recovery
Sharp force trauma and cut mark analyses to date have been intermittent
and superficially researched across a range of disciplines, despite its
potential to significantly contribute to anthropological investigation
(Herrman and Bennett, 1999; Tennick, 2012;). The use of fire is an
attempts to obscure a body is commonly encountered, however, fire does
not necessarily destroy evidence of trauma on bone (Robbins et al.,
2015). Advanced microscopy techniques such as scanning electron
microscopy (SEM) may also provided enhanced observational power
forensic reconstructions (Bartelink and Wiersema, 2001; Kooi and
Fairgrieve, 2013; Marciniak, 2009; Robbins et al. 2015).
Cremains are found within many broad anthropological contexts induced by
both human behavior as well as potentially stochastic environmental events,
adding to the challenge of reconstruction efforts (Alunni et al., 2013; Porta et
al,. 2013) . Ostensibly, enhanced observational methodologies from
developing x-ray and microscopy technologies, like SEM, have potential to
remove limitations met by other forms of observation and reconstruction
techniques, standard in forensics and anatomical methods. This study
recommends using an SEM for the examination of saw cuts in burnt bone
(Robbins, 2015).
Archaeological field methods and research using broad remote sensing
technologies demonstrate an emphasis on conservation as well as non-
invasive non-destructive processes in sample extraction, preparation, and
analysis. In culture resource management, archaeological excavation and
surveying has political and corporate applications while relying on
ecologically and sociocultural sensitive protocols. A social consciousness
underrepresented in principle ecological, sociological, and behavioral
research that is non-anthropological in origin. Enhanced observational
techniques and methodologies are made possible with progressive
equipment and technology. With additional observational information
provided by advanced microscopy, there are increasing opportunities for
multidisciplinary work.
A frequently overlooked element in the analysis of burned human remains is
reconstruction. Reconstruction provides a more holistic opportunity for
morphological interpretation and can greatly facilitate determinations of
human vs. non-human animal and recognition of specific skeletal elements.
Reconstruction can also increase the probability of identification and
recognition of trauma (Porta et al., 2013; Robbins et al., 2014; Rickman
2014; Ubelaker, 2002; Ubelaker, 2009).
Limitations and future ideas: SEM images of unburnt samples were not
taken, which would have provided further analyses for EDS spectrum
comparisons prior to and after incinerating activity. Potential follow up studies
may include EDS spectrum analyses of bones preserved in various
preservation mediums. Reconstruction capabilities could be evaluated using
metal residue analyses of metal blunt force trauma on bone.
We investigate the utility of scanning electron microscope (SEM)
methodologies in observing saw kerf patterning on burnt bone cut with
different types of saws. SEM analysis of kerf walls provide observations
that stereomicroscopes cannot. Kerf wall observations and interpretations
on cremains found within archaeological and forensic contribute to SEM
validity in methodologies of anthropological investigations.
We divided one Bos taurus, one Equidae, and two Cervus elaphus long
bones into three 9 cm segments using four different tools. Incineration of
bone segments was completed using a fire pit. Temperatures were
monitored using a Digi-Sense thermocouple thermometer. Thin sections
were prepared from the cut portions of each segment after burning.
Observations of kerf patterning were made using light and SEM.
Fractures and kerf wall patterning were observed using two different
microscopy methods. SEM provided further observations in comparison
to stereomicroscopes of kerf wall characteristics in cremains.
When comparing SEM and light microscopes the SEM provides a superior
observational method for the observation of kerf patterning in cremains. With
the SEM kerf pattern characteristics became very clear. Shallow false starts as
well as individual striations are very clear when compared to the stereo-light
microscope. The SEM also provided images of the heat induced fractures as
well as fractures due to weathering otherwise not visible using standard light
microscopy.
Two SEM/EDAX analyses were taken, providing elemental compositions of the
interior kerf floor and patterns as well as the superficial bone. Energy-
dispersive X-ray spectroscopy (EDS) analyses differed between the two site.
Kerf flooring, although observationally heterogeneous, yielded a homogenous
EDS spectrum distribution.
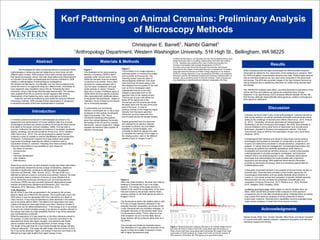
Figure 4. Reciprocating saw cutting by Bos taurus A. Fisheye image of burnt
kerf mark. B. Photo of unburnt kerf mark using stereo-light microscope. C.
Photo of burnt kerf mark using stereo-light microscope. D. Image of kerf mark
and location of EDAX analysis. E. Image of kerf mark and EDAX analysis. F.
EDS spectrum of kerf floor. G. EDS spectrum of superficial surface.
A.
B. C.
D. E.
F. G.
Marisa Acosta, Peter Thut, Charles Wandler, Mike Etnier, and Sarah Campbell
for constructive edits, sample collection, equipment acquisition, and technical
laboratory support and training.
Acknowledgments
Figure 1.
One drawback to the using scanning
electron microscopy (SEM) is that it
operates under vacuum and in many
SEMs the samples must be rendered
conductive to be viewed. This is often
achieved by coating samples with a
very thin layer of palladium and gold
metal particles or carbon. However,
there are a number of different types of
SEMs which all have specific purposes,
often associated with additional pieces
of equipment like specialized stages or
collectors. Some of these do not require
dry or conductive samples.
Fundamentally and functionally,
electron microscopes are in many ways
analogous to their optical counterparts
(light microscopes: LM). This is
somewhat surprising at first glance,
given the contrast between the simple
technology of the LM and the complex
electronics, vacuum equipment, voltage
supplies and electron optics system of
electron microscopes.
Figure 2.
The formation of an image requires a
scanning system to construct the image
point-by-point and line-by-line. The
scanning system uses two pairs of
electromagnetic deflection coils (scan
coils) that scan the beam along a line
then displace the line position to the next
scan so that a rectangular raster
(represented here by a red circle
instead) is generated both on the
specimen and on the viewing screen.
The first pair of scan coils bends the
beam off the optical axis of the
microscope and the second pair bends
the beam back onto the axis at the pivot
point of the scan. In order to
produce contrast in the image the signal
intensity from the beam-specimen
interaction must be measured from
point-to-point across the sample surface.
Signals generated from the specimen
are collected by an electron detector,
converted to photons via a scintillator,
amplified in a photomultiplier, and
converted to electrical signals and used
to modulate the intensity of the image on
the viewing screen, seen in the different
shades of grey on images D and E.
Figure 3.
After inner shell ionization, the atom may relax by
emitting a Characteristic X-ray or an Auger
electron. The energy of the Auger electron is
related to the electronic configuration of the atom
that was ionized by the primary electron beam,
causing variation on the EDS spectrums seen in
images F and G.
The fluorescence yield is the relative yield or ratio
of X-rays to Auger electrons, elements in the
samples chemical composition and those hit with
x-rays. Elements with low ionization energies, i.e.
the lighter elements on the periodic table, have
low fluorescence yields. That is, when an inner
shell ionization occurs it is more likely that an
Auger electron will be produced rather than an X-
ray photon.
This principle and shells are illustrated above.
The intensities of X-ray peaks for elements of low
atomic number are smaller compared to those
with a higher fluorescence yield.
Ammrf.org.au (2014). Introduction | MyScope. http://www.ammrf.org.au/myscope/confocal/introduction/
X-ray Absorption:
Not all of the X-rays that are generated in the sample by the primary
electron beam are emitted from the sample. This is particularly true in the
SEM where X-rays are generated within the interactions at a depth of
many microns. X-rays may be absorbed by other elements in the sample
due to the photo-electric effect. This effect is the observation that many
metals emit electrons when light shines upon them. Electrons emitted in
this manner can be called photoelectrons. If the energy of an X-ray photon
is equal to the critical ionization energy of an electron in another element in
the sample then there is a high probability that the X-ray will be absorbed
and a photoelectron produced.
While the absorption of X-rays depends on the other elements present in
the sample, it is also true that low-energy X-rays are more likely to be
absorbed than those with higher energies, and elements with higher
atomic numbers tend to be strong absorbers of lower energy X-rays.
The length of the path that the X-ray travels through the sample will also
influence absorption. The longer the path length, the more likely it is that
the X-ray will be absorbed. Again, low-energy X-rays are more likely to be
affected by longer path lengths than higher energy X-rays.
Dividing one Bos taurus, one Equidae, and two Cervus elaphus bones were
sawed once each with a circulating, reciprocating, and hand saw creating
(n=16). Samples were prepared from sites of direct burning after five
minutes of incineration with average temperatures of 476.2◦C
recorded using a Digi-Sense thermocouple thermometer. Microscope
observations and images of kerf patterning were completed and compared
using light stereomicroscope and SEM. Energy dispersive X-ray analysis
(EDAX) or energy dispersive X-ray microanalysis (EDXMA) is an analytical
technique used for the elemental analysis and chemical characterization of
samples, also quantifying levels of chemical residues. These analyses can
vary depending on experimental and behavior manipulation like firing.