Math Specialist Initiatives and Future Directions (Oregon)
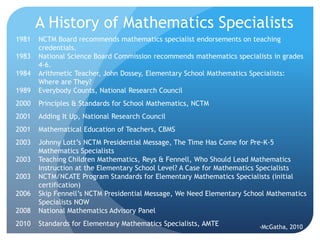
1. A History of Mathematics Specialists
1981
1989
NCTM Board recommends mathematics specialist endorsements on teaching
credentials.
National Science Board Commission recommends mathematics specialists in grades
4-6.
Arithmetic Teacher, John Dossey, Elementary School Mathematics Specialists:
Where are They?
Everybody Counts, National Research Council
2000
Principles & Standards for School Mathematics, NCTM
2001
Adding It Up, National Research Council
2001
Mathematical Education of Teachers, CBMS
2003
2008
Johnny Lott’s NCTM Presidential Message, The Time Has Come for Pre-K-5
Mathematics Specialists
Teaching Children Mathematics, Reys & Fennell, Who Should Lead Mathematics
Instruction at the Elementary School Level? A Case for Mathematics Specialists
NCTM/NCATE Program Standards for Elementary Mathematics Specialists (initial
certification)
Skip Fennell’s NCTM Presidential Message, We Need Elementary School Mathematics
Specialists NOW
National Mathematics Advisory Panel
2010
Standards for Elementary Mathematics Specialists, AMTE
1983
1984
2003
2003
2006
-McGatha, 2010
3. Overview of Session
Rationale for the use of Mathematics Specialists and their
impact
Overview of the national EMS Initiatives
Resources supporting EMS certification and program
development
Oregon’s story
Progress and and future direction through the ―certification‖
process
What research says about the influence of math
specialists
5. Why Math Specialists?
―Teacher‐leaders can have a significant
influence by assisting teachers in building
their mathematical and pedagogical
knowledge.…Teacher‐leaders’ support on a
day‐to‐day basis ranging from conversations
in the hall to in‐classroom coaching to regular
grade‐level and departmental seminars
focused on how students learn mathematics —
can be crucial to a teacher’s work life.‖
- National Council of Teachers of Mathematics, 2000
6. Why Math Specialists?
―A single mathematics education leader can
have an incredible impact on the
development and effectiveness of others.…
Leaders in mathematics education at all
levels of the school or district organization …
are crucial for ensuring attainment of high
‐quality school mathematics programs‖
- National Council of Supervisors of
Mathematics, 2008
7. Why Math Specialists?
“the use of teachers who have specialized in
elementary mathematics teaching could be a
practical alternative to increasing all elementary
teachers’ content knowledge (a problem of huge
scale) by focusing the need for expertise on
fewer teachers” (p. 44).
- National Mathematics
Advisory Panel, 2008
8. Common Core State Standards
Some content shifts to earlier grades
Focus on conceptual understanding
Focus on “mathematical
Problem Solving
Tools
Reasoning
Justification
Modeling
practices”
• Strategic Use of
• Precision
• Structure
• Generalization
9.
10. What do Math Specialists do?
They work in different settings and are asked to do a
variety of tasks:
Coach/mentor other teachers
Serve as a teacher leader/coordinator
Teach multiple classes of elementary students
(e.g., one teacher teaching all the 4th graders
math)
Teach special groups of students (remedial,
enrichment, pull-out or in-class)
Plan and provide professional learning
opportunities for teachers
11.
12. State Certification for EMS
Arizona
Maryland
Rhode Island
California
Michigan
South Dakota
Georgia
Missouri
Texas
Idaho
North Carolina
Utah
Kentucky
Ohio
Virginia
Louisiana
Oklahoma
Several other states are in the final stages of adding EMS certification
…. Arkansas and Pennsylvania
13. Charge of the AMTE EMS Initiative
With funding from The Brookhill Foundation:
Develop guidelines for EMS program development and
state certification.
Use the national leverage of AMTE (and other partnering
organizations) to advocate for more states to offer EMS
certification/endorsement.
15. MS Program Guidelines
Prerequisites:
Teacher licensure
At least three years of successful experience in teaching
mathematics
Components:
24 quarter hours (16 semester hours) spanning all of the
program components outlined in the standards.
Includes supervised mathematics specialist practicum –
working with a range of students and teachers.
16. Areas of Knowledge/Expertise
for Math Specialists
Content Knowledge for Teaching Mathematics
Pedagogical Knowledge for Teaching Mathematics
Leadership Knowledge and Skills
17. Mathematical Content
Knowledge
Specialized mathematics knowledge for teaching.
Deep understanding of mathematics.
1 Based on recommendations in Mathematics Education of Teachers
Report (2001 and 2012) and Guidelines for Assessment and
Instruction in Statistics Education (GAISE) Report (2007).
21. EMS State Certification Conference
Who are EMS professional?
What difference are they making?
How does a state get started with certification and
program development?
What resources are available?
What are next steps?
22. Oregon’s Math Specialist Task
Force
Team members:
Mark Freed, Oregon Department of Education
Linda Samek, George Fox University
Kathy Cheval, Salem Keizer School District
Lora Nordquist, Bend La-Pine School District
Cheryl Beaver, Western Oregon University
Ex-Officio Member:
Nicole Rigelman, Portland State University
23. Oregon’s MS Action Plan
Goal 1: Establish MS Certification in Oregon
Goal 2: Establish Preparation Programs for EMS
24. Goal 1: Establish MS Certification
Step 1: Develop standards
Review other state EMS certification stories & AMTE
standards
MS endorsement to a license
Model after reading specialist / school social worker
Elementary, middle, and high
25. Goal 1: Establish MS Certification
Step 2: Gather letters of support from various influential
bodies
E.g. Superintendents, Principals, Deans, Business,
Legislators, ODE, Teachers groups (e.g. OCTM, OMEC,
TOTOM, etc.)
Step 3: Present proposal at November meeting of TSPC
This is followed by a public review period
Step 4: Proposal voted on at April TSPC meeting
26. Goal 2: Design Preparation
Program for MS
Step 1: Secure funding for meetings
Step 2: Hold a planning retreat with representatives from
institutions across Oregon (summer 2012)
What is the Content? Format? Who will teach the
courses? What should the Field Experience look like?
Assessment issues?
Look at models from other states
READ Oregon & PrISM
Step 3: Implement programs
27. Future Steps
Find funding for first cohort
Find sustainable funding and programs
29. Virginia Math Specialists: Year by
Year Scale Score Performance
Significant difference in student achievement between
schools with and without an EMS, but this was NOT
evident in the first year of placement of an EMS at any
grade (in either cohort).
The pattern of achievement was:
o An increase in scores in Year 1,
o Followed by a greater increase in scores in Year 2,
o Followed by an even greater increase in scores in
Year 3.
The size of the increases in Years 2 and 3 drive the
statistically significant effect.
- Campbell, 2010
30. Difference between Students’ Mean
Achievement Scores on SOL’s
(Cohort 1 EMS versus Control Schools)
Grade 3
Grade 4
Grade 5
Year 1
(2006-07)
6.8
12.3
6.34
Year 2
(2007-08)
10.4
15.4*
19.6*
Year 3
(2008-09)
16.5
13.3
20.3*
Across
2006-09
10.71*
13.68**
15.25**
- Campbell, 2010
31. Achievement Comparison, MCP Cohort I Schools
Findell, Brosnan & Erchick (2008)
100
2007 Percent Proficient
80
60
Gr. 3
Gr. 4
Gr. 5
Gr. 6
40
20
0
0
20
40
60
2006 Percent Proficient
80
100
32. Ohio MCP Achievement Results
For one academic year in the program, for all grade levels combined
(grades 3-8), the average relative change for students achieving the
proficient level or higher was 4.65% greater for MCP-coached schools
than non-coached schools. (Zollinger, Brosnan, Erchick, and Bao,
2010).
Southern Elementary, Southern Ohio, Appalachian population:
Grade 3
2005
2006
2007
2008
2009
2010
Grade 4
59.5
36.1
77.4
63.9
79.7
84.3
59.1
66.7
80.8
82.4
82.0
79.7
Grade 5
Grade 6
Not given 29.5
53.2
15.2
40.0
66.0
85.9
57.4
57.8
58.7
75.0
96.2
Grade 7
Grade 8
58.9
51.2
64.6
51.0
93.3
94.3
43.9
52.8
59.5
73.3
75.0
83.0
33. Specialists' Knowledge of Mathematics for Teaching
85%
Cohort 1
80%
75%
70%
Cohort 2
65%
60%
55%
Pre-Course
Post-Course
First Year of
Experience
Second Year Third Year of
of Experience
Experience
36. Mean Hours per Contracted Week
EMS Activity
Cohort 1 Cohort 1 Cohort 1
Year 1
Year 2
Year 3
Cohort 2
Year 1
Coaching Teachers and Teams
8.21
4.91
4.84
3.83
Preparing for Coaching/Teaching
4.43
4.65
4.69
4.43
Supporting Assessment
3.98
5.06
5.14
4.69
Independently Teaching Students
1.13
1.65
1.69
1.35
Supporting School Math Program
1.88
1.58
1.91
1.91
Performing School-based Duties
2.44
3.45
3.9
3.68
Materials Mgmt/Communication
3.64
4.13
4.43
4.28
Attending Meetings
3.45
2.55
2.51
3.56
Engaging in Personal Prof. Activity
4.95
5.51
4.09
5.4
Non-educational Activity (e.g.,
lunch, travel, all-school event)
3.38
4.05
4.24
4.43
37. How MCP Coaches (Are Expected to)
Spend Their Time In a Typical Week
Brosnan & Erchick (2009)
1/2
Direct work with the teacher, in the classroom
1/5
Working with data (teacher data, student
achievement tests, student open problem
solving analysis)
About
1/6
Reflection and planning
About
1/6
Building level Professional development and
other school activities (committees, community
relations, etc.)
38. Achievement, Teacher Growth, and
Pursuing Consistent Success
Inconsistencies in the student achievement data in the
MCP as noted earlier, led to…
Analysis of the teacher understanding of student
thinking and knowledge of instructional decisions, which
led to…
Disaggregating teacher data by having worked with a
coach or not, which led to…
Raising a question about what led to the higher
achieving schools’ success.
39. Coaching Characteristics in the Most
Improved MCP Schools
Alignment
with MCP
Protocol
• One coach per building.
• Co-teaching/teaming more often
than modeling; and with 3-4
teachers at a time.
• Few non-coaching activities.
• Consistent pre- and postconferences.
• Provide embedded PD
Leadership
• Consistent attendance and
• Participation in school leadership
participation in MCP PD.
at the building level.
• Promotes expected role of coach.
Administrative • Strong administrative support to
Support
implement the program.
• Principal understanding of MCP
goals, pedagogy, MCP model.
Professional
• Average and above average
Knowledge
measures on content, pedagogy
and Coaching • High comfort level with the
Role
program.
• Analyzes student work and
assessment data with teachers.
• Pursues implementing MCP
model.
Focus on
MCP
Instructional
Principles
•
•
•
Student thinking.
Mathematical knowledge.
Questioning techniques.
•
•
Using process standards.
Using rich problems.
Editor's Notes
Ask about who is here… teacher, math coach/specialist, district leaders, higher education
Conferences in 2010 and 20112010 – 11 states attending and 2 states each sending 1 member2011 – 9 states attending
We’ve looked at our data in different ways:Change in MCP vs non-MCP schools (this slide); andIndividual schools (previous slide).Which leads to looking for explanations for inconsistencies that emerged when looking at individual schools – which we will talk about later.
37.5 hour per week average contracted expectation (7.5 hours per day)In addition, EMS spent over 4 hours per week on work-related tasks, including coaching, for which they received no financial compensation.EMS are not positioned in all schools in these districts, so assessment expectations are probably a reflection of a local school response to district pressures, and not a district-level assignment.Time in meetings was consistent within districts and differed between districts.During first year there was a second coaching/leadership course and for about half of Cohort 1, master’s degree completion carried over into Year 2 (with action research project).But all EMS need to continue learning and professional interaction/reading after placement.Most EMS volunteered for morning and afternoon bus duty (40-55 minutes per day)
So we looked at the 5 schools with the highest growth rate; and the 5 schools with the lowest growth rate to see what the coaches did in those schools
And these are absent in the least successful schoolsData sources: Looked at coach data (site visit reports, facilitator reports, weekly logs, coach content and pedagogy scores, administration participation.Data were form the 5 most improved (highest rate of growth) MCP schools and the 5 least improved (lowest rate of growth) MCP schools (out of 100+ schools).School Leadership examples: Building Leadership Team; School Improvement Team; Intervention Assistance Team.