Les données du Data Portal du Shift Project sur l'électricité britannique et suédoise
•Télécharger en tant que PPTX, PDF•
1 j'aime•750 vues

Utilisation des données du Data Portal créé par The Shift Project, think-tank de la transition carbone, pour introduire les transitions énergétiques au Royaume-Uni et en Suède, dans le cadre des Ateliers du Shift du 9 juin 2015.

Recommandé
Recommandé
Contenu connexe
En vedette
En vedette (20)
Plus de The Shift Project
Plus de The Shift Project (20)
Dernier
Dernier (20)
Les données du Data Portal du Shift Project sur l'électricité britannique et suédoise
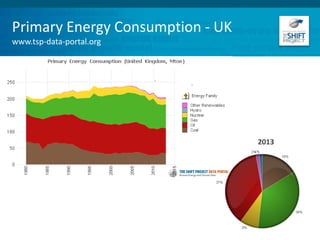
- 1. Primary Energy Consumption - UK www.tsp-data-portal.org 2013
- 2. Primary Energy Consumption - Sweden www.tsp-data-portal.org 2013
- 3. Primary Energy Consumption – France www.tsp-data-portal.org 2013
- 4. Primary energy consumption per capita (3 countries) www.tsp-data-portal.org
- 5. CO2 emissions per capita (3 countries) www.tsp-data-portal.org
- 6. Top CO2 emitters (Europe) www.tsp-data-portal.org
Notes de l'éditeur
- Gas and oil main resources being used in primary consumption, with coal at 16% in 2013 Renewables represent very small portion / nuclear: 8% Overall consumption has gone down over the past 10 years
- Nuclear is main source of energy with 41% in 2013 Followed by oil at 38% > reduced in the 80’s, has been going down slowly but steadily No more coal since 1995 Renewables and hydro represent 16% in 2013
- Nuclear is main source of energy with 42% > that percentage has gone up considerably since the early 80’s Oil is the 2nd source at 36% No more coal since 2005 Renewables and hydro are minor, less than 5%
- Measured in million tons oil equivalent (Mtoe) per million people Primary energy consumption > represents the sum of all the types of energy sourced to be consumed across each country Sweden at 0.4 higher than France, with UK at 0.3 Million tons oil equivalent
- In metric ton CO2 per million people With Sweden and France neck to neck at about 1.4 metric ton CO2 per million people And the UK considerably higher at 2 metric ton CO2 per million people (when previous graph shows it has the lowest consumption per capita)
- In metric ton CO2 equivalent in 2010 We can see how emissions are broken down by sectors Germany at the very top with 18%, followed by the UK at 12%. France is 4th with 9% Sweden is 17th with 1,2%