Graphing in Excel
•
0 j'aime•679 vues

Graphing in Excel: Beyond Basics Presented by Dale Roenigk, UNC School of Government, at Summer 2013 NCLGBA Conference, July 10, 2013
Recommandé

Recommandé
Contenu connexe
Similaire à Graphing in Excel
Similaire à Graphing in Excel (20)
Plus de PublicFinanceTV
Plus de PublicFinanceTV (20)
Graphing in Excel
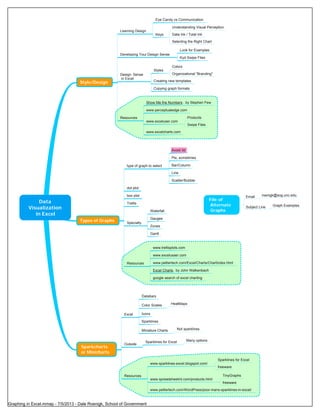
- 1. Data Visualization in Excel Style/Design Learning Design Eye Candy vs Communication Keys Understanding Visual Perception Data Ink / Total Ink Selecting the Right Chart Developing Your Design Sense Look for Examples Kyd Swipe Files Design Sense in Excel Styles Colors Organizational "Branding" Creating new templates Copying graph formats Resources Show Me the Numbers , by Stephen Few www.perceptualedge.com www.exceluser.com Products Swipe Files www.excelcharts.com Types of Graphs type of graph to select Avoid 3d Pie, sometimes Bar/Column Line Scatter/Bubble dot plot box plot Trellis Specialty Waterfall Gauges Zones Gantt Resources www.trellisplots.com www.excelusser.com www.peltiertech.com/Excel/Charts/ChartIndex.html Excel Charts , by John Walkenbach google search of excel charting Sparkcharts or Minicharts Excel Databars Color Scales HeatMaps Icons Sparklines Miniature Charts Not sparklines Outside Sparklines for Excel Many options Resources www.sparklines-excel.blogspot.com/ Sparklines for Excel freeware www.spreadsheetml.com/products.html TinyGraphs freeware www.peltiertech.com/WordPress/poor-mans-sparklines-in-excel/ File of Alternate Graphs Email roenigk@sog.unc.edu Subject Line Graph Examples Graphing in Excel.mmap - 7/5/2013 - Dale Roenigk, School of Government