In Sharjah ௵(+971)558539980 *_௵abortion pills now available.
Weekly Market Report
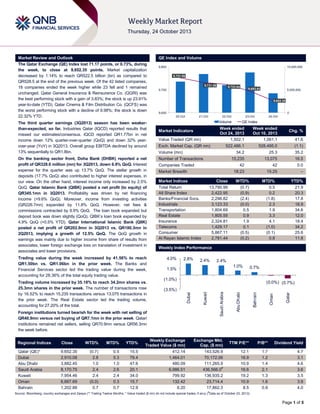
1. 9,731.56
Close
Qatar (QE)*
Dubai
Abu Dhabi
Saudi Arabia
Kuwait
Oman
Bahrain
9,652.35
2,910.08
3,882.45
8,170.75
7,954.46
6,667.69
1,202.88
9,693.93
5,000,000
9,652.35
9,600
0
20-Oct
21-Oct
22-Oct
23-Oct
Volume
Value Traded (QR mn)
QE Index
Week ended
Oct 10, 2013
1,061.1
522,486.1
528,495.0
(1.1)
Exch. Market Cap. (QR mn)
Volume (mn)
Chg. %
41.6
34.2
Market Indices
Close
Total Return
13,790.99
All Share Index
2,422.95
Banks/Financial Svcs.
2,296.82
Industrials
3,123.33
Transportation
1,804.69
Real Estate
1,805.55
Insurance
2,324.81
Telecoms
1,429.17
Consumer
5,867.11
Al Rayan Islamic Index
2,781.44
Market Indices
Weekly Index Performance
2.8%
2.4%
16.5
42
0.0
18:23
Market Breadth
35.2
13,075
42
Companies Traded
25.3
15,235
Number of Transactions
15:25
–
WTD%
(0.7)
(0.9)
(2.4)
(0.0)
0.5
0.9
1.9
0.1
(0.5)
(0.2)
MTD%
0.5
0.2
(1.8)
2.3
1.9
3.3
4.1
(1.0)
(0.1)
0.8
YTD%
21.9
20.3
17.8
18.9
34.6
12.0
18.4
34.2
25.6
11.8
2.4%
1.0%
1.5%
0.7%
(1.0%)
(3.5%)
Qatar
(0.0%) (0.7%)
Oman
4.0%
24-Oct
Week ended
Oct 24, 2013
1,502.1
Market Indicators
Foreign institutions turned bearish for the week with net selling of
QR40.9mn versus net buying of QR7.1mn in the prior week. Qatari
institutions remained net sellers, selling QR70.9mn versus QR56.3mn
the week before.
Regional Indices
9,723.64
9,700
Bahrain
Trading volume increased by 35.18% to reach 34.2mn shares vs.
25.3mn shares in the prior week. The number of transactions rose
by 16.52% to reach 15,235 transactions versus 13,075 transactions in
the prior week. The Real Estate sector led the trading volume,
accounting for 27.20% of the total.
9,751.89
Abu Dhabi
Trading value during the week increased by 41.56% to reach
QR1.50bn vs. QR1.06bn in the prior week. The Banks and
Financial Services sector led the trading value during the week,
accounting for 28.36% of the total equity trading value.
10,000,000
Saudi Arabia
On the banking sector front, Doha Bank (DHBK) reported a net
profit of QR328.6 million (mn) for 3Q2013, down 6.9% QoQ. Interest
expense for the quarter was up 13.7% QoQ. The stellar growth in
deposits (17.7% QoQ) also contributed to higher interest expenses, in
our view. On the other hand, interest income only increased by 2.5%
QoQ. Qatar Islamic Bank (QIBK) posted a net profit (to equity) of
QR345.1mn in 3Q2013. Profitability was driven by net financing
income (+9.6% QoQ). Moreover, income from investing activities
(QR226.7mn) expanded by 11.8% QoQ. However, net fees &
commissions contracted by 9.9% QoQ. The loan book expanded but
deposit book was down slightly (QoQ). QIBK‟s loan book expanded by
4.9% QoQ (+0.5% YTD). Qatar International Islamic Bank (QIIK)
posted a net profit of QR202.9mn in 3Q2013 vs. QR180.3mn in
2Q2013, implying a growth of 12.5% QoQ. The QoQ growth in
earnings was mainly due to higher income from share of results from
associates, lower foreign exchange loss on translation of investment in
associates and lower provisions.
9,800
Kuwait
The third quarter earnings (3Q2013) season has been weakerthan-expected, so far. Industries Qatar (IQCD) reported results that
missed our estimates/consensus. IQCD reported QR1.77bn in net
income down 12% quarter-over-quarter (QoQ) and down 32% yearover-year (YoY) in 3Q2013. Overall group EBITDA declined by around
13% sequentially to QR1.8bn.
QE Index and Volume
Dubai
Market Review and Outlook
The Qatar Exchange (QE) Index lost 71.17 points, or 0.73%, during
the week, to close at 9,652.35 points. Market capitalization
decreased by 1.14% to reach QR522.5 billion (bn) as compared to
QR528.5 at the end of the previous week. Of the 42 listed companies,
18 companies ended the week higher while 23 fell and 1 remained
unchanged. Qatar General Insurance & Reinsurance Co. (QGRI) was
the best performing stock with a gain of 3.83%; the stock is up 23.91%
year-to-date (YTD). Qatar Cinema & Film Distribution Co. (QCFS) was
the worst performing stock with a decline of 9.98%; the stock is down
22.32% YTD.
WTD%
MTD%
YTD%
Weekly Exchange
Traded Value ($ mn)
Exchange Mkt.
Cap. ($ mn)
TTM P/E**
P/B**
Dividend Yield
(0.7)
2.8
1.0
2.4
2.4
(0.0)
0.7
0.5
5.3
1.0
2.6
2.4
0.3
0.7
15.5
79.4
47.6
20.1
34.0
15.7
12.9
412.14
1,464.01
480.09
6,986.51
799.92
132.42
6.20
143,526.9
70,172.06
111,265.9
436,566.0#
136,935.2
23,714.4
17,862.3
12.1
16.9
10.9
16.6
19.2
10.9
8.5
1.7
1.2
1.4
2.1
1.3
1.6
0.9
4.7
3.1
4.6
3.6
3.5
3.9
4.0
#
Source: Bloomberg, country exchanges and Zawya (** Trailing Twelve Months; * Value traded ($ mn) do not include special trades, if any) ( Data as of October 23, 2013)
Page 1 of 5
2. News
Market & Corporate News
IQCD reports weaker-than-expected 3Q2013 results. In-line
with the general trend, seen thus far, of weaker-than-expected
3Q results posted by Qatari companies, IQCD reported results
that missed our estimates/consensus. IQCD reported
QR1.77bn in net income (-12% QoQ, -32% YoY). A significant
drop in fertilizer profitability and a weaker-than-expected topline contribution from steel led to the earnings miss, in our view.
Overall group EBITDA declined by around 13% sequentially to
QR1.8bn. Petrochemicals benefited from improved pricing and
lack of shutdowns, as expected. Revenue of QR1.4bn
increased by ~24% QoQ with net profit rising by ~22% to
around QR1bn. Improvement in LDPE and MTBE prices along
with volume growth (15/20 day unplanned shutdowns in
LDPE/MTBE lines in 2Q) boosted results. Fertilizers were
affected by lower urea prices along with planned maintenancerelated downtime. Revenue of QAR1.3bn fell 22% QoQ,
tracking the decline in realized urea prices. Net profit of
QR334mn (-54% QoQ), was also well below our model.
Besides weaker urea prices, volumes were also hurt by
planned downtime (ammonia: 28 days, urea: 23 days),
According to IQCD, its urea prices declined by more than 21%
QoQ (~$80/MT) to close at a 3-year low of $293/MT, which was
down more than $100/MT since early-2013. Steel segment
impacted by volume decline. Revenue of QAR1.3bn declined
~6% QoQ with volumes impacted by 72 days of
planned/unplanned maintenance-related downtime (vs. 52 days
in 2Q). Revenue was also impacted as DRI/HBI stocks were
reserved for the EF5 Greenfield steel melt shop (resulting in
~169,000 MT and ~17,000 MT, respectively, in lower sales
volume). Net profit declined ~10% QoQ to ~QR402mn with
margins still robust at ~30% (vs. ~31% in 2Q2013 and ~32% in
1Q2013). (QNBFS Research, QE)
DHBK 3Q2013 net income misses estimates – Doha Bank
(DHBK) reported a net profit of QR328.6mn for 3Q2013, down
6.9% QoQ. Interest expense for the quarter was up 13.7%
QoQ. The stellar growth in deposits (17.7% QoQ) also
contributed to higher interest expenses, in our view. On the
other hand, interest income only increased by 2.5% QoQ. Net
fees and commissions declined by 9.4% QoQ. On the
provisions front, the bank recorded combined provisions (loans
and investments) of QR75.0mn in 3Q2013 vs. QR48.6mn in
2Q2013. Customer deposits increase by 17.7% QoQ. The loan
book grew by 7.6% QoQ (+15.3% YTD) while deposits gained
by 17.7% QoQ (16.6% YTD). This led to a LTD of 97% at the
end of 3Q2013 vs. 106% at the end of 2Q2013. (QNBFS
Research, QE)
QIBK 3Q2013 results in line with our estimates – QIBK
posted a net profit (to equity) of QR345.1mn in 3Q2013. Net
income increased by 1.8% QoQ. Profitability was driven by net
financing income (+9.6% QoQ). Moreover, income from
investing activities (QR226.7mn) expanded by 11.8% QoQ.
However, net fees & commissions contracted by 9.9% QoQ.
The loan book expanded but deposit book was down slightly
(QoQ). QIBK‟s loan book expanded by 4.9% QoQ (+0.5%
YTD). Equity of unrestricted investment account holders (URIA)
ticked up by 1.3% QoQ (-1.9% YTD). However, customers‟
deposits in current account dropped by 8.5% QoQ (+33.7%
YTD). Customer deposits and URIA combined declined by
1.5% QoQ (+5.6% YTD). Hence, the loan-to-deposit ratio
increased to 95% vs. 89% at the end of 2Q2013. In terms of the
investment book, total investments increased by 2.1% QoQ.
Growth was driven by fixed income securities (+2.6% QoQ)
while equity investments receded by 2% QoQ. (QNBFS
Research, QE)
GWCS 3Q2013 Results hit by higher expenses and
provisions – Gulf Warehousing reported a net profit of
QR22.7mn vs. QR31.4mn in 2Q2013. However, for the nine
months of 2013, the bottom-line is up 24.5% YoY. Increased
cost/expenses and provisions for Imdad. Overall revenue came
in line. However, direct costs increased 11.9% QoQ, which was
above our estimates. Furthermore, general and administrative
(G&A) expenses increased by 201.6% QoQ to QR8.2mn vs.
QR2.7mn in 2Q2013 (this line item has been volatile in the past
as well). On the Imdad front, the company booked a provision
of QR2.4mn vs. QR0.2mn in 2Q2013 (we do not forecast
provisions). We maintain our estimates with a price target of
QR40.53. (QNBFS Research, QE)
UDCD reports net profit of QR180.4mn in 3Q2013 – United
Development Company (UDCD) has reported a net profit of
QR180.4mn in 3Q2013, reflecting an increase of 55.5% QoQ
(+51.9% YoY). Revenue fell by 32.8% QoQ (-31.1% YoY) to
QR513mn in 3Q2013. The main driver of profitability was a
48.6% QoQ (-51.4% YoY) drop in COGS. EPS amounted to
QR1.50 for the nine months ended September 30, 2013 as
compared to QR1.24 for the corresponding period in 2012.
(QE)
QNCD posts a net profit of QR86.5mn in 3Q2013 – Qatar
National Cement (QNCD) posted a net profit of QR86.5mn in
3Q2013 vs. QR116.9mn in 2Q2013. The decline is on the back
of lower sales, which is down 22.4% QoQ to QR208mn vs.
QR268mn in 2Q2013. We believe Ramadan and the summer
break led to a decline in sales volume. (QNBFS Research, QE)
QIIK 3Q2013 net income up 12.5% QoQ – QIIK (Qatar
International Islamic Bank) posted a net profit of QR202.9mn in
3Q2013. QIIK posted QR180.3mn in 2Q2013, implying a
growth of 12.5% QoQ. The QoQ growth in earnings was mainly
due to higher income from share of results from associates,
lower foreign exchange loss on translation of investment in
associates and lower provisions vs. our estimates. The loan
book and deposits expanded on a QoQ and YTD basis. QIIK‟s
loan book grew by 9.3% QoQ (+44.5% YTD), while total
deposits (URIA & current accounts) grew by 12.9% QoQ
(+24.9% YTD). However, the improved loan book did not make
a significant impact on income from financing activities, which
expanded by only 1.9% (QIIK has been aggressively targeting
the public sector in the last few quarters). On the other hand,
share of unrestricted investment account holders (URIA)
increased by 13.0% QoQ. Hence, net financing income
declined by 2.3% QoQ. Furthermore, income from investing
activities declined by 18.8% QoQ. We maintain our estimates
and reiterate our price target of QR57.18. For 2013 and 2014,
we expect QIIK to post earnings of QR729mn and QR782mn,
respectively. We feel the bank will increase DPS to QR3.75 for
2013 (QR3.50 DPS for the last two years). (QNBFS Research,
QE)
QNB Group issues dual-tranche dollar denominated bonds
– QNB Group issued a $1.5bn dual-tranche dollar denominated
bonds. The group issued a $750mn three-year floating rate
notes. QNB Group also issued a $750mn five-year, fixed-rate
tranche. The group mandated HSBC Holdings, Standard
Chartered, JP Morgan Chase, Royal Bank of Scotland and its
own investment banking arm for this sale. (QE)
Page 2 of 5
3. Qatar Exchange
Top 5 Gainers
Top 5 Decliners
0.0%
6.0%
4.0%
-4.0%
3.8%
3.3%
3.2%
-5.6%
-5.3%
-4.6%
-4.9%
2.3%
2.0%
2.0%
-8.0%
-10.0%
0.0%
-12.0%
Qatar General
Insurance &
Reinsurance
Barwa Real
Estate
Milaha
Qatar
Insurance
Salam
International
Investment
Source: Qatar Exchange (QE)
Widam Food
Co.
Medicare
Group
Source: Qatar Exchange (QE)
Most Active Shares by Value (QR Million)
260.0
Qatar Cinema Qatar German QNB Group
& Film
Co. for
Distribution
Medical
Devices
Most Active Shares by Volume (Million)
253.7
6.0
5.3
4.6
195.0
4.0
142.1
127.9
130.0
3.3
127.5
2.5
102.3
2.2
2.0
65.0
0.0
0.0
Industries
Qatar
Barwa Real
Estate
Medicare
Group
QNB Group
Commercial
Bank of Qatar
Source: Qatar Exchange (QE)
Barwa Real
Estate
Salam
International
Investment
United
Development
Medicare
Group
Qatari
Investors
Group
Source: Qatar Exchange (QE)
Investor Trading Percentage to Total Value Traded
Net Traded Value by Nationality (QR Million)
45
100%
22.84%
25.56%
15.88%
10.18%
23.81%
28.53%
37.47%
35.73%
Non-Qatari
80%
60%
582
40%
20%
537
(45)
Qatari
965
920
0%
Buy
Sell
Qatari Individuals
Qatari Institutions
Non-Qatari Individuals
Non-Qatari Institutions
Source: Qatar Exchange (QE)
(200)
-
200
Net Investment
400
600
Total Sold
800
1,000
1,200
Total Bought
Source: Qatar Exchange (QE)
Page 3 of 5
4. TECHNICAL ANALYSIS OF THE QE INDEX
Source: Bloomberg
The QE Index ended on a sour note after remaining flat for most part of the week. The index failed to surpass the stiff resistance of the descending trendline
and eventually penetrated below both the 21-day (currently at 9,708.47) and the 55-day (currently at 9,724.53) moving averages. The index also declined
below the important support band of 9,700.0-9,670.0, thus signaling a bearish signal. The next key level for the traders to watch out for support is the
9,600.0 psychological level. If the index dips below this level, then the bears may assume control and drag it to test the 9,535.0 level. Any sustained
weakness below this level may lead to increased selling pressure toward the 9,420.0 level. On the other hand, if the index manages to cling on to support of
the 9,600.0 psychological level, it may stand a chance of moving toward the 9,700.0-9800.0 levels. Technically speaking, the index‟s upward movement will
be in jeopardy as long as it trades below the descending trendline and may drift lower over a period of time. Meanwhile, both momentum indicators seem to
indicate a potential downtrend.
DEFINITIONS OF KEY TERMS USED IN TECHNICAL ANALYSIS
RSI (Relative Strength Index) indicator – RSI is a momentum oscillator that measures the speed and change of price movements. The RSI oscillates
between 0 to 100. The index is deemed to be overbought once the RSI approaches the 70 level, indicating that a correction is likely. On the other hand, if
the RSI approaches 30, it is an indication that the index may be getting oversold and therefore likely to bounce back.
MACD (Moving Average Convergence Divergence) indicator – The indicator consists of the MACD line and a signal line. The divergence or the
convergence of the MACD line with the signal line indicates the strength in the momentum during the uptrend or downtrend, as the case may be. When the
MACD crosses the signal line from below and trades above it, it gives a positive indication. The reverse is the situation for a bearish trend.
Candlestick chart – A candlestick chart is a price chart that displays the high, low, open, and close for a security. The „body‟ of the chart is portion between
the open and close price, while the high and low intraday movements form the „shadow‟. The candlestick may represent any time frame. We use a one-day
candlestick chart (every candlestick represents one trading day) in our analysis.
Doji candlestick pattern – A Doji candlestick is formed when a security's open and close are practically equal. The pattern indicates indecisiveness, and
based on preceding price actions and future confirmation, may indicate a bullish or bearish trend reversal.
Shooting Star/Inverted Hammer candlestick patterns – These candlestick patterns have a small real body (open price and close price are near to each
other), and a long upper shadow (large intraday movement on the upside). The Shooting Star is a bearish reversal pattern that forms after a rally. The
Inverted Hammer looks exactly like a Shooting Star, but forms after a downtrend. Inverted Hammers represent a potential bullish trend reversal.
Page 4 of 5
5. Price % Change 5(Oct 24)
Day
% Change
Monthly
Market Cap.
QR Million
TTM P/E
P/B
Div. Yield
160.00
(5.33)
(4.08)
111,957
12.1
2.2
3.8
Qatar Islamic Bank
66.80
(1.33)
(2.77)
15,784
14.6
1.4
5.6
Commercial Bank of Qatar
66.40
(1.92)
(2.92)
16,430
8.1
1.2
9.0
Doha Bank
54.50
(0.91)
1.30
14,081
9.6
1.6
7.6
Al Ahli Bank
55.80
1.27
0.00
7,091
13.7
2.1
5.4
Qatar International Islamic Bank
56.60
1.43
1.43
8,567
12.0
1.7
6.2
Masraf Al Rayan
29.35
0.86
2.09
22,013
13.8
2.3
3.4
Al Khaliji Bank
18.80
0.32
2.73
6,768
12.5
1.3
5.3
National Leasing
30.65
(2.08)
(11.29)
1,517
13.0
1.2
6.5
Dlala Holding
20.90
(0.95)
(3.15)
464
N/M
2.2
N/A
Qatar & Oman Investment
12.25
(4.15)
(5.04)
386
20.1
1.2
4.1
Islamic Holding Group
40.35
(3.93)
(3.93)
161
21.7
2.8
2.8
Company Name
Qatar National Bank
205,219
Banking and Financial Services
Zad Holding
68.00
(1.31)
2.41
890
8.0
0.7
5.9
Qatar German Co. for Medical Devices
14.81
(5.61)
(1.59)
171
N/M
0.9
N/A
Salam International Investment
12.25
2.00
1.58
1,400
10.9
0.8
5.7
Medicare Group
48.30
(4.55)
(0.41)
1,359
22.1
1.8
3.7
Qatar Cinema & Film Distribution
44.20
(9.98)
(11.60)
252
33.8
1.8
4.3
0.11
(0.25)
18,321
15.3
3.1
3.5
(4.87)
(5.79)
878
13.4
3.8
8.2
0.37
3.41
2,730
17.9
2.2
5.9
282.00
Qatar Fuel
48.80
Qatar Meat and Livestock
136.50
Al Meera Consumer Goods
26,002
Consumer Goods and Services
(0.40)
0.00
1,980
11.6
1.5
6.0
Qatar National Cement
102.00
50.00
0.59
0.99
5,008
11.8
2.0
5.9
Industries Qatar
153.00
0.59
2.07
92,565
11.4
2.9
5.1
31.25
0.81
7.76
3,885
16.7
1.8
2.4
155.00
(2.94)
(1.77)
15,500
10.8
2.9
4.7
Mannai Corp.
87.00
(0.91)
2.96
3,969
8.4
1.8
5.5
Aamal
14.20
(0.70)
(0.70)
8,520
13.3
1.3
N/A
Gulf International Services
56.80
0.89
8,445
14.0
2.9
2.6
Qatar Industrial Manufacturing
Qatari Investors Group
Qatar Electricity and Water
13.37
139,872
Industrials
Qatar Insurance
61.90
2.31
3.17
7,950
9.8
1.6
3.2
Doha Insurance
25.85
(1.71)
0.58
665
12.1
1.3
3.5
Qatar General Insurance & Reinsurance
57.00
3.83
10.68
3,286
3.9
1.0
1.5
Al Khaleej Takaful Insurance
39.35
(2.72)
(2.11)
672
14.1
1.2
2.1
Qatar Islamic Insurance
56.00
(2.10)
(1.75)
840
14.2
3.2
6.3
13,413
Insurance
United Development
21.60
(2.26)
(0.41)
7,284
8.9
0.7
4.6
Barwa Real Estate
26.65
3.29
6.60
10,370
17.3
0.8
5.6
Ezdan Real Estate
17.00
0.00
(1.28)
45,092
N/M
1.6
0.8
Mazaya Qatar Real Estate Development
11.49
0.09
(0.26)
1,149
17.3
1.1
5.2
44,236
13.1
1.7
3.6
7,651
N/M
1.3
N/A
63,896
Real Estate
138.10
0.07
(1.22)
9.05
0.22
0.33
Qatar Navigation (Milaha)
85.10
3.15
5.98
9,746
10.1
0.8
4.4
Gulf Warehousing
39.60
(2.22)
(2.10)
1,883
18.9
2.4
N/A
Qatar Gas Transport (Nakilat)
Transportation
18.87
(1.20)
(0.74)
10,567
13.8
3.0
5.3
Qatar Telecom
Vodafone Qatar
51,887
Telecoms
22,197
Qatar Exchange
522,486
Source: Bloomberg
Contacts
Saugata Sarkar
Ahmed M. Shehada
Keith Whitney
Sahbi Kasraoui
Head of Research
Head of Trading
Head of Sales
Manager - HNWI
Tel: (+974) 4476 6534
Tel: (+974) 4476 6535
Tel: (+974) 4476 6533
Tel: (+974) 4476 6544
saugata.sarkar@qnbfs.com.qa
ahmed.shehada@qnbfs.com.qa
keith.whitney@qnbfs.com.qa
sahbi.alkasraoui@qnbfs.com.qa
QNB Financial Services SPC
Contact Center: (+974) 4476 6666
PO Box 24025, Doha, Qatar
DISCLAIMER: This publication has been prepared by QNB Financial Services SPC (“QNBFS”) a wholly-owned subsidiary of Qatar National Bank (“QNB”). QNBFS is regulated by the Qatar
Financial Markets Authority and the Qatar Exchange; QNB is regulated by the Qatar Central Bank. This publication expresses the views and opinions of QNBFS at a given time only. It is not an
offer, promotion or recommendation to buy or sell securities or other investments, nor is it intended to constitute legal, tax, accounting, or financial advice. We therefore strongly advise potential
investors to seek independent professional advice before making any investment decision. Although the information in this report has been obtained from sources that QNBFS believes to be
reliable, we have not independently verified such information and it may not be accurate or complete. While this publication has been prepared with the utmost degree of care by our analysts,
QNBFS does not make any representations warranties as to the accuracy and completeness of the information it may contain, and declines any liability in that respect. QNBFS reserves the right
to amend the views and opinions expressed in this publication at any time. It may also express viewpoints or make investment decisions that differ significantly from, or even contradict, the views
and opinions included in this report.
COPYRIGHT: No part of this document may be reproduced without the explicit written permission of QNBFS.
Page 5 of 5