

Recommandé
Recommandé
Contenu connexe
En vedette
En vedette (15)
Plus de QNB Group
Plus de QNB Group (20)
Dernier
Dernier (20)
Weekly market report
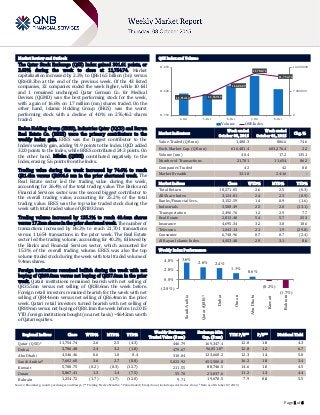
- 1. ` Page 1 of 6 Market Review and Outlook QSE Index and Volume The Qatar Stock Exchange (QSE) Index gained 301.61 points, or 2.63% during the week to close at 11,754.74. Market capitalization increased by 2.2% to QR616.5 billion (bn) versus QR603.3bn at the end of the previous week. Of the 43 listed companies, 32 companies ended the week higher, while 10 fell and 1 remained unchanged. Qatar German Co. for Medical Devises (QGMD) was the best performing stock for the week, with a gain of 16.6% on 1.7 million (mn) shares traded. On the other hand, Islamic Holding Group (IHGS) was the worst performing stock with a decline of 4.0% on 276,462 shares traded. Ezdan Holding Group (ERES), Industries Qatar (IQCD) and Barwa Real Estate Co. (BRES) were the primary contributors to the weekly index gain. ERES was the biggest contributor to the Index’s weekly gain, adding 91.9 points to the Index. IQCD added 32.0 points to the Index, while BRES contributed 24.3 points. On the other hand, Milaha (QNNS) contributed negatively to the Index, erasing 5.6 points from the Index. Trading value during the week increased by 74.6% to reach QR1.4bn versus QR806.6 mn in the prior shortened week. The Real Estate sector led the trading value during the week, accounting for 26.4% of the total trading value. The Banks and Financial Services sector was the second biggest contributor to the overall trading value, accounting for 25.2% of the total trading value. ERES was the top value traded stock during the week with total traded value of QR183.3mn. Trading volume increased by 135.1% to reach 40.4mn shares versus 17.2mn shares in the prior shortened week. The number of transactions increased by 86.2% to reach 21,701 transactions versus 11,654 transactions in the prior week. The Real Estate sector led the trading volume, accounting for 40.2%, followed by the Banks and Financial Services sector, which accounted for 15.3% of the overall trading volume. ERES was also the top volume traded stock during the week with total traded volume of 9.4mn shares. Foreign institutions remained bullish during the week with net buying of QR89.0mn versus net buying of QR37.0mn in the prior week. Qatari institutions remained bearish with net selling of QR35.5mn versus net selling of QR38.6mn the week before. Foreign retail investors remained bearish for the week with net selling of QR44.6mn versus net selling of QR6.4mn in the prior week. Qatari retail investors turned bearish with net selling of QR8.9mn versus net buying of QR8.1mn the week before. In 2015 YTD, foreign institutions bought (on a net basis) ~$642mn worth of Qatari equities. Market Indicators Week ended October 08, 2015 Week ended October 01, 2015 Chg. % Value Traded (QR mn) 1,408.3 806.6 74.6 Exch. Market Cap. (QR mn) 616,481.4 603,276.4 2.2 Volume (mn) 40.4 17.2 135.1 Number of Transactions 21,701 11,654 86.2 Companies Traded 42 42 0.0 Market Breadth 32:10 24:16 – Market Indices Close WTD% MTD% YTD% Total Return 18,271.05 2.6 2.5 (0.3) All Share Index 3,124.01 2.4 2.3 (0.9) Banks/Financial Svcs. 3,152.59 1.4 0.9 (1.6) Industrials 3,508.49 2.5 2.0 (13.1) Transportation 2,496.76 1.2 2.9 7.7 Real Estate 2,813.40 5.4 5.7 25.3 Insurance 4,695.34 3.2 3.8 18.6 Telecoms 1,043.13 2.1 1.9 (29.8) Consumer 6,740.96 0.7 0.7 (2.4) Al Rayan Islamic Index 4,453.48 2.9 3.1 8.6 Market Indices Weekly Index Performance Regional Indices Close WTD% MTD% YTD% Weekly Exchange Traded Value ($ mn) Exchange Mkt. Cap. ($ mn) TTM P/E** P/B** Dividend Yield Qatar (QSE)* 11,754.74 2.6 2.5 (4.3) 446.79 169,347.4 12.0 1.8 4.3 Dubai 3,706.48 2.4 3.2 (1.8) 479.67 96,051.8# 12.8 1.2 6.7 Abu Dhabi 4,546.46 0.6 1.0 0.4 310.04 123,660.2 12.3 1.4 5.0 Saudi Arabia# 7,602.68 3.6 2.7 (8.8) 5,023.92 455,500.8 16.2 1.8 3.4 Kuwait 5,708.75 (0.2) (0.3) (12.7) 211.55 88,746.5 14.6 1.0 4.5 Oman 5,867.41 1.3 1.4 (7.5) 55.70 23,837.6 11.2 1.3 4.4 Bahrain 1,254.72 (1.7) (1.7) (12.0) 9.71 19,670.5 7.9 0.8 5.5 Source: Bloomberg, country exchanges and Zawya (** Trailing Twelve Months; * Value traded ($ mn) do not include special trades, if any; # Data as of October 07, 2015) 11,514.12 11,569.12 11,686.09 11,788.71 11,754.74 0 7,000,000 14,000,000 11,350 11,600 11,850 4-Oct 5-Oct 6-Oct 7-Oct 8-Oct Volume QSEIndex 3.6% 2.6% 2.4% 1.3% 0.6% (0.2%) (1.7%) (2.0%) 0.0% 2.0% 4.0% SaudiArabia Qatar(QSE)* Dubai Oman AbuDhabi Kuwait Bahrain
- 2. Page 2 of 6 News Economic News QNB Group: Bank lending set to grow 10.5% in 2015 on project financing, expanding population – QNB Group (QNBK) said in a recent report that project lending and the expanding population will see bank lending in Qatar grow by 10.5% in 2015. QNBK in its “Monthly monitor” report said the overall loan book grew by 17.3% YoY in August from 15% in July. Public sector lending grew by 0.8% YoY, while lending to the private and foreign sectors grew strongly by 25.1% and 40.6%, respectively. Banking asset growth rose to 11.8% in August as compared to 10.6% in July on credit expansion. Foreign assets grew by 10.1% YoY, driven by credit expansion (40.6%), while domestic assets grew by 13.2%, also driven by the growth in domestic credit (15%). QNBK expects growth in bank assets to reach 10.5% in 2015, increasingly driven by project lending and population growth. The growth in bank deposits fell in August on lower public sector deposits. Bank deposit growth fell to 7.2% YoY in August 2015 from 8.4% in July. Public sector deposits contracted by 12.3%, private sector deposits grew by 9.9%, while non-resident deposits doubled, growing by 117.9%. QNBK expects deposit growth to reach 9.5% in 2015 reflecting strong population growth. Qatar’s population grew by 10.2% YoY in August to reach 2.29mn, driven by the large ramp up in infrastructure spending. QNBK expects Qatar’s ongoing investment program to continue to attract expatriates, resulting in overall population growth of 9% in 2015. Meanwhile, Qatar’s real estate price is expected to continue its strong growth, although at a more moderate pace, on rapid population growth and higher per capita GDP. The Qatar Central Bank’s (QCB) real estate price index had reached its highest point in June 2015, up 23.2% YoY, since its introduction four years ago. Qatar’s crude oil production fell to 613,000 barrels per day (bpd) in July 2015 from 664,000 bpd in June. QNBK expects Qatar’s crude oil production to stabilize while it anticipates that Brent crude oil price will average $55.4 per barrel, close to its average so far in 2015. (Gulf-Times.com, Peninsula Qatar) Market & Corporate News QNBK reports robust earnings in 9M2015 – QNB Group (QNBK) reported a 9% YoY increase in its 9M2015 net profit to QR8.7bn, primarily supported by a 5.1% YoY growth in its net interest income to QR9.5bn. Moreover, net fees & commissions income grew by 8.2% YoY to QR1.7bn. Consequently, the bank’s operating income jumped 5.9% YoY to QR12.4bn in 9M2015. On the other hand, the bank’s total expenses increased to QR2.6bn in 9M2015 from QR2.4bn in 9M2014 while its cost-to-income ratio marginally increased to 21.1% from 20.9% over the same period. On the balance sheet front, the loan expansion outpaced deposit growth with QNBK’s loans & advances rising 11.5% YoY to QR367bn, while customer deposits jumped 8.9% YoY to QR381bn in 9M2015. As a result, the loan-to-deposit ratio inched up to 96% in 9M2015 as compared to 94% in 9M2014. Total assets were up 9.6% YoY to QR521bn in 9M2015. The bank continued to exhibit strong asset quality with its NPL ratio declining to 1.5% in 9M2015 from 1.6% in 9M2014. QNBK’s coverage ratio also increased to 127% from 124%. The bank’s EPS stood at QR12.5 in 9M2015 as compared to QR11.4 in 9M2014. The bank’s capitalization continued to be strong with its capital adequacy ratio, as per the Qatar Central Bank (QCB) and Basel III requirements, hovering at 14.0% in 9M2015, higher than the regulatory minimum requirements of the QCB and Basel Committee. (QNB Group Press release) QFLS to disclose financial statements on October 26 – Qatar Fuel Company (QFLS) will announce its financial reports for the period ending September 30, 2015 on October 26, 2015. (QSE) ERES to announce financial statements on Oct 26 – Ezdan Holding Group (ERES) will disclose its financial reports for the period ending September 30, 2015 on October 26, 2015. (QSE) QGRI to announce financial statements on Oct 25 – Qatar General Insurance and Reinsurance Company (QGRI) will disclose its financial reports for the period ending September 30, 2015 on October 25, 2015. (QSE) QOIS to announce financial statements on Oct 25 – Qatar Oman Investment Company (QOIS) will disclose its financial reports for the period ending September 30, 2015 on October 25, 2015. (QSE) AKHI to announce financial statements on Oct 20 – Al Khaleej Takaful Group (AKHI) will disclose its financial reports for the period ending September 30, 2015 on October 20, 2015. (QSE) QCSD raises QNNS’ foreign ownership to 49% – The Qatar Central Securities Depository (QCSD) has amended the foreign ownership percentage in Qatar Navigation Company (QNNS), increasing it to 49% of the total capital, effective from October 7, 2015. This amendment is pursuant to Law No. (9), that allows foreign investors to own shares in companies, listed on the Qatar Stock Exchange, by not more than 49% of each company’s capital. The law also provides for the treatment of the GCC citizens as Qataris in terms of owning the shares of the listed companies. (QSE) CBQK completes squeeze-out process of Alternatifbank, to disclose financial statements on Oct 18 – The Commercial Bank (CBQK) has completed a formal squeeze-out process of its Turkey-based subsidiary - Alternatifbank A.S. CBQK that held 74.25% in Alternatifbank, completed the squeeze-out process along with Anadolu Endustri Holding, owning 17.21%, and Anadolu Motor Uretim ve Pazarlama, holding 7.79% shares of Alternatifbank. Following the transaction, CBQK has acquired further 0.75% shares of Alternatifbank from the Bourse Istanbul, which takes its holding to 75%. Following the squeeze-out process, the Alternatifbank shares have been delisted from the Bourse Istanbul. Meanwhile, CBQK announced that it would disclose its financial reports for the period ending September 30, 2015 on October 18, 2015. (QSE) QSE announces rights issues selling mechanism – The Qatar Stock Exchange (QSE) has announced new selling and pricing mechanism of rights issue as part of modernizing the financial framework to offer flexibility and protection to shareholders. The rightsholder will have either the option to exercise the rights by subscribing to the company’s capital increase, or sell the rights, fully or partially, in the market under the conditions and within the period specified in the Qatar Financial Market Authority (QFMA) regulations as well as in the market notice. Rights issues are securities that entitle their holder the right to subscribe to the capital increase issued by the company and dedicated to its existing shareholders. According to the new QFMA’s regulations, rights issues can be listed and sold at the stock exchange. The number of rights issues will be equal to the number of shares in the capital increase to be issued by the company to its existing shareholders through the subscription process. The selling of the rights issues shall be done independently from the original share. Unless provided for otherwise in the QFMA Rules, the rights issue selling is subject to the same trading provisions applied to shares among others. Moreover, rights selling period shall be ten working days. Also, buying investors are not allowed to sell the purchased rights during the selling period. (QSE)
- 3. Page 3 of 6 Qatar Stock Exchange Top Gainers Top Decliners Source: Qatar Stock Exchange (QSE) Source: Qatar Stock Exchange (QSE) Most Active Shares by Value (QR Million) Most Active Shares by Volume (Million) Source: Qatar Stock Exchange (QSE) Source: Qatar Stock Exchange (QSE) Investor Trading Percentage to Total Value Traded Net Traded Value by Nationality (QR Million) Source: Qatar Stock Exchange (QSE) Source: Qatar Stock Exchange (QSE) 16.6% 6.1% 5.8% 5.1% 4.7% 0.0% 6.0% 12.0% 18.0% Qatar German Co. for Medical Devices Ezdan Real Estate Medicare Group Qatari Investors Group Vodafone Qatar -4.0% -2.0% -1.9% -1.6% -1.2% -4.5% -3.0% -1.5% 0.0% Islamic Holding Group Al Ahli Bank Gulf Warehousing Milaha MannaiCorp. 183.3 120.9 115.5 108.2 103.5 0.0 70.0 140.0 210.0 Ezdan Real Estate QNB Group Gulf International Services Barwa Real Estate Industries Qatar 9.4 4.7 3.4 2.7 2.4 0.0 4.0 8.0 12.0 Ezdan Real Estate Vodafone Qatar Mazaya Qatar Qatar Gas Transport (Nakilat) Barwa Real Estate 0% 20% 40% 60% 80% 100% Buy Sell 47.20% 47.83% 9.29% 11.81% 13.44% 16.61% 30.08% 23.76% Qatari Individuals Qatari Institutions Non-Qatari Individuals Non-Qatari Institutions 796 613 840 569 (44) 44 (200) - 200 400 600 800 1,000 Qatari Non-Qatari Net Investment Total Sold Total Bought
- 4. Page 4 of 6 TECHNICAL ANALYSIS OF THE QSE INDEX Source: Bloomberg The QSE Index moved up by 2.63% on low volumes vs. the week before; volumes picked up but the Index remains under the medium term. Over the shorter term, the Index is in a range and only a breach above or below the expected support and resistance might dictate where it will be heading. These levels continue to be at 11,000 points support level and 12,000 points resistance level. DEFINITIONS OF KEY TERMS USED IN TECHNICAL ANALYSIS RSI (Relative Strength Index) indicator – RSI is a momentum oscillator that measures the speed and change of price movements. The RSI oscillates between 0 to 100. The index is deemed to be overbought once the RSI approaches the 70 level, indicating that a correction is likely. On the other hand, if the RSI approaches 30, it is an indication that the index may be getting oversold and therefore likely to bounce back. MACD (Moving Average Convergence Divergence) indicator – The indicator consists of the MACD line and a signal line. The divergence or the convergence of the MACD line with the signal line indicates the strength in the momentum during the uptrend or downtrend, as the case may be. When the MACD crosses the signal line from below and trades above it, it gives a positive indication. The reverse is the situation for a bearish trend. Candlestick chart – A candlestick chart is a price chart that displays the high, low, open, and close for a security. The ‘body’ of the chart is portion between the open and close price, while the high and low intraday movements form the ‘shadow’. The candlestick may represent any time frame. We use a one-day candlestick chart (every candlestick represents one trading day) in our analysis. Doji candlestick pattern – A Doji candlestick is formed when a security's open and close are practically equal. The pattern indicates indecisiveness, and based on preceding price actions and future confirmation, may indicate a bullish or bearish trend reversal. Shooting Star/Inverted Hammer candlestick patterns – These candlestick patterns have a small real body (open price and close price are near to each other), and a long upper shadow (large intraday movement on the upside). The Shooting Star is a bearish reversal pattern that forms after a rally. The Inverted Hammer looks exactly like a Shooting Star, but forms after a downtrend. Inverted Hammers represent a potential bullish trend reversal.
- 5. Page 5 of 6 Source: Bloomberg Company Name Price (Oct 08) % Change WTD % Change YTD Market Cap. QR Million TTM P/E P/B Div. Yield Qatar National Bank 187.90 1.29 (11.74) 131,479 11.8 2.4 4.0 Qatar Islamic Bank 117.10 1.83 14.58 27,670 15.8 1.9 3.6 Commercial Bank of Qatar 56.40 1.44 (9.43) 18,422 9.8 1.1 5.6 Doha Bank 50.30 0.70 (11.75) 12,996 9.5 1.0 8.0 Al Ahli Bank 48.50 (2.02) (2.29) 8,813 13.8 2.1 2.8 Qatar International Islamic Bank 75.10 0.54 (8.08) 11,368 13.2 2.2 5.3 Masraf Al Rayan 43.90 1.27 (0.68) 32,925 15.7 3.3 4.0 Al Khaliji Bank 21.70 3.24 (1.59) 7,812 12.8 1.4 4.6 National Leasing 18.10 2.09 (9.50) 896 N/A 0.8 4.7 Dlala Holding 20.91 4.55 (37.47) 594 N/A 2.0 N/A Qatar & Oman Investment 14.11 2.99 (8.38) 444 6.9 1.3 5.7 Islamic Holding Group 108.40 (3.99) (12.93) 434 29.8 7.0 2.8 Banking and Financial Services 253,853 Zad Holding 93.50 (0.53) 11.31 1,223 10.6 1.6 4.3 Qatar German Co. for Medical Devices 15.60 16.59 53.69 180 N/A 1.1 N/A Salam International Investment 12.68 1.52 (20.00) 1,450 18.6 0.9 4.7 Medicare Group 174.60 5.82 49.23 4,914 25.0 5.6 1.0 Qatar Cinema & Film Distribution 38.00 0.00 (5.00) 239 18.4 1.7 2.4 Qatar Fuel 152.00 (0.98) (25.60) 12,838 11.2 2.0 5.9 Widam Food Co. 54.00 (0.55) (10.60) 972 15.8 4.1 4.6 Al Meera Consumer Goods 246.50 (1.00) 23.25 4,930 23.0 3.7 3.7 Consumer Goods and Services 26,745 Qatar Industrial Manufacturing 42.90 1.90 (1.04) 2,039 12.3 1.4 7.0 Qatar National Cement 104.90 0.29 (12.58) 5,666 13.3 2.1 3.5 Industries Qatar 124.90 2.63 (25.65) 75,565 12.7 2.4 5.6 Qatari Investors Group 47.10 5.13 13.77 5,856 25.1 2.5 1.6 Qatar Electricity and Water 210.90 1.88 12.48 23,199 14.5 3.5 3.6 Mannai Corp. 100.60 (1.18) (7.71) 4,589 9.4 2.1 6.0 Aamal 13.91 2.66 (3.85) 8,763 13.8 1.2 6.8 Gulf International Services 67.30 4.34 (30.69) 12,507 8.1 3.3 8.2 Mesaieed Petrochemical Holding 21.50 1.90 -27.1 27,011 20.9 2.0 5.1 Industrials 165,194 Qatar Insurance 97.70 3.94 24.01 18,038 19.1 3.1 2.2 Doha Insurance 24.18 4.45 (16.62) 1,209 13.6 1.1 4.2 Qatar General Insurance & Reinsurance 56.00 1.08 9.15 4,455 4.7 0.8 3.1 Al Khaleej Takaful Insurance 35.00 (1.13) (20.77) 893 16.5 1.4 3.7 Qatar Islamic Insurance 74.80 0.40 (5.32) 1,122 15.0 3.6 5.3 Insurance 25,717 United Development 24.48 4.17 3.77 8,668 12.7 0.8 5.1 Barw a Real Estate 45.05 4.28 7.52 17,530 2.8 1.0 4.9 Ezdan Real Estate 19.80 6.11 32.71 52,519 36.0 1.8 2.0 Mazaya Qatar Real Estate Development 16.67 4.19 (8.60) 1,750 10.1 1.3 1.7 Real Estate 80,468 Ooredoo 78.00 1.17 (37.05) 24,985 17.5 1.2 5.1 Vodafone Qatar 14.03 4.70 (14.71) 11,861 N/A 2.2 1.5 Telecoms 36,846 Qatar Navigation (Milaha) 96.40 (1.63) (3.12) 11,040 9.3 0.8 5.7 Gulf Warehousing 68.00 (1.88) 20.57 3,234 20.2 3.6 2.2 Qatar Gas Transport (Nakilat) 23.90 4.37 3.46 13,384 14.1 3.4 5.0 Transportation 27,658 Qatar Exchange 616,481
- 6. Contacts Saugata Sarkar Sahbi Kasraoui QNB Financial Services SPC Head of Research Head of HNI Contact Center: (+974) 4476 6666 Tel: (+974) 4476 6534 Tel: (+974) 4476 6544 PO Box 24025 saugata.sarkar@qnbfs.com.qa sahbi.alkasraoui@qnbfs.com.qa Doha, Qatar Disclaimer and Copyright Notice: This publication has been prepared by QNB Financial Services SPC (“QNBFS”) a wholly-owned subsidiary of QNB SAQ (“QNB”). QNBFS is regulated by the Qatar Financial Markets Authority and the Qatar Exchange QNB SAQ is regulated by the Qatar Central Bank. This publication expresses the views and opinions of QNBFS at a given time only. It is not an offer, promotion or recommendation to buy or sell securities or other investments, nor is it intended to constitute legal, tax, accounting, or financial advice. QNBFS accepts no liability whatsoever for any direct or indirect losses arising from use of this report. Any investment decision should depend on the individual circumstances of the investor and be based on specifically engaged investment advice. We therefore strongly advise potential investors to seek independent professional advice before making any investment decision. Although the information in this report has been obtained from sources that QNBFS believes to be reliable, we have not independently verified such information and it may not be accurate or complete. QNBFS does not make any representations or warranties as to the accuracy and completeness of the information it may contain, and declines any liability in that respect. For reports dealing with Technical Analysis, expressed opinions and/or recommendations may be different or contrary to the opinions/recommendations of QNBFS Fundamental Research as a result of depending solely on the historical technical data (price and volume). QNBFS reserves the right to amend the views and opinions expressed in this publication at any time. It may also express viewpoints or make investment decisions that differ significantly from, or even contradict, the views and opinions included in this report. This report may not be reproduced in whole or in part without permission from QNBFS COPYRIGHT: No part of this document may be reproduced without the explicit written permission of QNBFS. Page 6 of 6