
Recommended
More Related Content
Similar to Sustainable Development_Unit_2.pdf
Similar to Sustainable Development_Unit_2.pdf (20)
More from RISHABHJAIN27097
More from RISHABHJAIN27097 (20)
Recently uploaded
Recently uploaded (20)
Sustainable Development_Unit_2.pdf
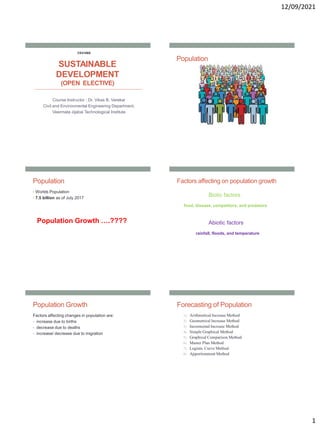
- 1. 12/09/2021 1 SUSTAINABLE DEVELOPMENT (OPEN ELECTIVE) Course Instructor : Dr. Vikas B. Varekar Civil and Environmental Engineering Department, Veermata Jijabai Technological Institute CE4106S Population Population • Worlds Population • 7.5 billion as of July 2017 Population Growth ….???? Factors affecting on population growth Biotic factors food, disease, competitors, and predators Abiotic factors rainfall, floods, and temperature Population Growth Factors affecting changes in population are: • increase due to births • decrease due to deaths • increase/ decrease due to migration Forecasting of Population 1) Arithmetical Increase Method 2) Geometrical Increase Method 3) Incremental Increase Method 4) Simple Graphical Method 5) Graphical Comparison Method 6) Master Plan Method 7) Logistic Curve Method 8) Apportionment Method
- 2. 12/09/2021 2 ARITHMETICALINCREASE METHOD 7 • It is assumed that the population is increasing at constant rate, i.e. dP/dt = C • Therefore, Population after nth decade will be Pn= P + n.C where, Pn is the population after ‘n’ decades and ‘P’ is present population, C is the average increment for the decades • Suitable for large and old city with considerable development. • If it is used for small, average or comparatively new cities, it will give lower population estimate than actual value. Arithmetical Increase Method Solution • Calculate average increment for the decades • Estimate the population for the given year Solution Solution Solution
- 3. 12/09/2021 3 Problem • The population data for a town is given below. Find out the population in the year 2051, and 2061 by arithmetical increase method GEOMETRICALINCREASE METHOD • In this method the per decade percentage increase or percentage growth rate is assumed to be constant • The increase is compounded over the existing population every dacade, this method also known as uniform increase method. • The geometric mean is defined as the nth root of the product of n numbers • should be applied for a new industrial town at the beginning of development for only few decades GEOMETRICALINCREASE METHOD • The population at the end of nth decade ‘Pn’ can be estimated as: Pn = P (1+ IG/100)n Where, IG = geometric mean of percentage increase P = Present population N = no. of decades. • IG = (r1 X r2 X r3 X….X rm)1/m • r growth rate in percentage GEOMETRICALINCREASE METHOD • Problem Solution Solution
- 4. 12/09/2021 4 Solution Solution • Calculate geometric mean • Estimation of population Solution Solution Problem • The population data for a town is given below. Find out the population in the year 2021, 2031and 2041 by geometrical increase method 327,500; 429,025; 562,023 Incremental Increase Method • In this method per decade growth rate is not assumed to be constant as in arithmetic / geometric mean method • But is progressively increasing or decreasing depending upon weather the average of the incremental increase in the past data is positive or negative • Suitable for an average size town under normal condition where the growth rate is found to be in increasing order.
- 5. 12/09/2021 5 Incremental Increase Method • Population after nth decade is can be estimated as, Pn = P+ n.X + {n (n+1)/2}.Y where, Pn = Population after nth decade X = Average increase Y = Incremental increase Incremental Increase Method Solution • Increase in population • Incremental increase in population • Estimate population for nth decade Incremental Increase Method Incremental Increase Method Incremental Increase Method
- 6. 12/09/2021 6 Incremental Increase Method SIMPLE GRAPHICAL METHOD • In this method, the populations of last few decades are correctly plotted to a suitable scale on graph. • The population curve is smoothly extended for getting future population. • This extension should be done carefully and it requires proper experience and judgment. SIMPLE GRAPHICAL METHOD Population Forecasting • First four methods based on the assumption that, • Factors and conditions which are responsible for population increase in the past will continue in future also. • But the assumption may or may not be satisfied • City may suddenly impose immigration restrictions • Compulsory family planning for eligible couples • Develop enhanced medical facilities thereby reducing death rates MASTER PLAN METHOD • The big and metropolitan cities are generally not developed in haphazard manner, but are planned and regulated by local bodies according to master plan. • The master plan is prepared for next 25 to 30 years for the city. According to the master plan the city is divided into various zones such as residence, commerce and industry. • The population densities are fixed for various zones in the master plan. • From this population density total water demand and wastewater generation for that zone can be worked out. LOGISTIC CURVE METHOD • This method is used when the growth rate of population due to births, deaths and migrations takes place under normal situation and it is not subjected to any extraordinary changes like epidemic, war, earth quake or any natural disaster, etc. • If the population of a city is plotted with respect to time, the curve so obtained under normal condition looks like S- shaped curve and is known as logistic curve.
- 7. 12/09/2021 7 LOGISTIC CURVE METHOD LOGISTIC CURVE METHOD • the curve shows an early growth JK at an increasing rate i.e. geometric growth or log growth, dP/dt ∝ P • The transitional middle curve KM follows arithmetic increase i.e. dP/dt=C • For later growth MN the rate of change of population is proportional to difference between saturation population and existing population, i.e. dP/dt ∝ (Ps - P) LOGISTIC CURVE METHOD • A mathematical solution for this logistic curve JN, which can be represented by an autocatalytic first order equation, is given by where, LOGISTIC CURVE METHOD P = Population at any time t from the origin J Ps= Saturation population P0= Population of the city at the start point J m & n = Constants t = Time in years Problem
- 8. 12/09/2021 8 Problem • In three consecutive decades the population of a town is 40,000; 100,000 and 130,000. Determine: (a) Saturation population; (b) Equation for logistic curve; (c) Expected population in next decade. Solution Q.3. (a) Saturation population: 137,500 (b) Equation for logistic curve: m = 2.437; n = -0.187; (c) Expected population in next decade: 136,283population in next decade.