Olah data bivariat
•Télécharger en tant que DOC, PDF•
0 j'aime•794 vues

semoga bermanfaat

Recommandé
Contenu connexe
En vedette
En vedette (16)
Dernier
Dernier (20)
Olah data bivariat
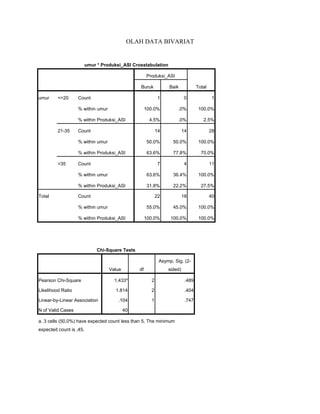
- 1. OLAH DATA BIVARIAT umur * Produksi_ASI Crosstabulation Produksi_ASI TotalBuruk Baik umur <=20 Count 1 0 1 % within umur 100.0% .0% 100.0% % within Produksi_ASI 4.5% .0% 2.5% 21-35 Count 14 14 28 % within umur 50.0% 50.0% 100.0% % within Produksi_ASI 63.6% 77.8% 70.0% >35 Count 7 4 11 % within umur 63.6% 36.4% 100.0% % within Produksi_ASI 31.8% 22.2% 27.5% Total Count 22 18 40 % within umur 55.0% 45.0% 100.0% % within Produksi_ASI 100.0% 100.0% 100.0% Chi-Square Tests Value df Asymp. Sig. (2- sided) Pearson Chi-Square 1.433a 2 .489 Likelihood Ratio 1.814 2 .404 Linear-by-Linear Association .104 1 .747 N of Valid Cases 40 a. 3 cells (50,0%) have expected count less than 5. The minimum expected count is ,45.
- 2. paritas * Produksi_ASI Crosstabulation Produksi_ASI TotalBuruk Baik paritas primipara Count 7 4 11 % within paritas 63.6% 36.4% 100.0% % within Produksi_ASI 31.8% 22.2% 27.5% multipara Count 15 14 29 % within paritas 51.7% 48.3% 100.0% % within Produksi_ASI 68.2% 77.8% 72.5% Total Count 22 18 40 % within paritas 55.0% 45.0% 100.0% % within Produksi_ASI 100.0% 100.0% 100.0% Chi-Square Tests Value df Asymp. Sig. (2- sided) Exact Sig. (2- sided) Exact Sig. (1- sided) Pearson Chi-Square .457a 1 .499 Continuity Correctionb .103 1 .749 Likelihood Ratio .462 1 .496 Fisher's Exact Test .723 .377 Linear-by-Linear Association .446 1 .504 N of Valid Cases 40 a. 1 cells (25,0%) have expected count less than 5. The minimum expected count is 4,95. b. Computed only for a 2x2 table
- 3. pekerjaan * Produksi_ASI Crosstabulation Produksi_ASI TotalBuruk Baik pekerjaan tidak bekerja Count 20 12 32 % within pekerjaan 62.5% 37.5% 100.0% % within Produksi_ASI 90.9% 66.7% 80.0% bekerja Count 2 6 8 % within pekerjaan 25.0% 75.0% 100.0% % within Produksi_ASI 9.1% 33.3% 20.0% Total Count 22 18 40 % within pekerjaan 55.0% 45.0% 100.0% % within Produksi_ASI 100.0% 100.0% 100.0% Chi-Square Tests Value df Asymp. Sig. (2- sided) Exact Sig. (2- sided) Exact Sig. (1- sided) Pearson Chi-Square 3.636a 1 .057 Continuity Correctionb 2.279 1 .131 Likelihood Ratio 3.714 1 .054 Fisher's Exact Test .110 .065 Linear-by-Linear Association 3.545 1 .060 N of Valid Cases 40 a. 2 cells (50,0%) have expected count less than 5. The minimum expected count is 3,60. b. Computed only for a 2x2 table
- 4. pendidikan * Produksi_ASI Crosstabulation Produksi_ASI TotalBuruk Baik pendidikan SD Count 6 5 11 % within pendidikan 54.5% 45.5% 100.0% % within Produksi_ASI 27.3% 27.8% 27.5% SMP Count 8 4 12 % within pendidikan 66.7% 33.3% 100.0% % within Produksi_ASI 36.4% 22.2% 30.0% SMA Count 8 6 14 % within pendidikan 57.1% 42.9% 100.0% % within Produksi_ASI 36.4% 33.3% 35.0% PT Count 0 3 3 % within pendidikan .0% 100.0% 100.0% % within Produksi_ASI .0% 16.7% 7.5% Total Count 22 18 40 % within pendidikan 55.0% 45.0% 100.0% % within Produksi_ASI 100.0% 100.0% 100.0% Chi-Square Tests Value df Asymp. Sig. (2- sided) Pearson Chi-Square 4.353a 3 .226 Likelihood Ratio 5.495 3 .139 Linear-by-Linear Association .980 1 .322 N of Valid Cases 40 a. 3 cells (37,5%) have expected count less than 5. The minimum expected count is 1,35.
- 5. Kateg_Nyeri * Produksi_ASI Crosstabulation Produksi_ASI TotalBuruk Baik Kateg_Nyeri Nyeri Ringan Count 8 13 21 % within Kateg_Nyeri 38.1% 61.9% 100.0% % within Produksi_ASI 36.4% 72.2% 52.5% Nyeri Sedang Count 12 5 17 % within Kateg_Nyeri 70.6% 29.4% 100.0% % within Produksi_ASI 54.5% 27.8% 42.5% Nyeri Berat Count 2 0 2 % within Kateg_Nyeri 100.0% .0% 100.0% % within Produksi_ASI 9.1% .0% 5.0% Total Count 22 18 40 % within Kateg_Nyeri 55.0% 45.0% 100.0% % within Produksi_ASI 100.0% 100.0% 100.0% Correlations Kateg_Nyeri Produksi_ASI Spearman's rho Kateg_Nyeri Correlation Coefficient 1.000 -.375* Sig. (2-tailed) . .017 N 40 40 Produksi_ASI Correlation Coefficient -.375* 1.000 Sig. (2-tailed) .017 . N 40 40 *. Correlation is significant at the 0.05 level (2-tailed).
- 6. Kateg_Motivasi * Produksi_ASI Crosstabulation Produksi_ASI TotalBuruk Baik Kateg_Motivasi Kurang Count 8 13 21 % within Kateg_Motivasi 38.1% 61.9% 100.0% % within Produksi_ASI 36.4% 72.2% 52.5% Tinggi Count 14 5 19 % within Kateg_Motivasi 73.7% 26.3% 100.0% % within Produksi_ASI 63.6% 27.8% 47.5% Total Count 22 18 40 % within Kateg_Motivasi 55.0% 45.0% 100.0% % within Produksi_ASI 100.0% 100.0% 100.0% Correlations Produksi_ASI Kateg_Motivasi Spearman's rho Produksi_ASI Correlation Coefficient 1.000 -.357* Sig. (2-tailed) . .024 N 40 40 Kateg_Motivasi Correlation Coefficient -.357* 1.000 Sig. (2-tailed) .024 . N 40 40 *. Correlation is significant at the 0.05 level (2-tailed).
- 7. Status_Kesehatan * Produksi_ASI Crosstabulation Produksi_ASI TotalBuruk Baik Status_Kesehatan Buruk Count 18 12 30 % within Status_Kesehatan 60.0% 40.0% 100.0% % within Produksi_ASI 81.8% 66.7% 75.0% Baik Count 4 6 10 % within Status_Kesehatan 40.0% 60.0% 100.0% % within Produksi_ASI 18.2% 33.3% 25.0% Total Count 22 18 40 % within Status_Kesehatan 55.0% 45.0% 100.0% % within Produksi_ASI 100.0% 100.0% 100.0% Correlations Produksi_ASI Status_Kesehata n Spearman's rho Produksi_ASI Correlation Coefficient 1.000 .174 Sig. (2-tailed) . .283 N 40 40 Status_Kesehatan Correlation Coefficient .174 1.000 Sig. (2-tailed) .283 . N 40 40
- 8. Dukungan_Sosial * Produksi_ASI Crosstabulation Produksi_ASI TotalBuruk Baik Dukungan_Sosial Buruk Count 9 13 22 % within Dukungan_Sosial 40.9% 59.1% 100.0% % within Produksi_ASI 40.9% 72.2% 55.0% Baik Count 13 5 18 % within Dukungan_Sosial 72.2% 27.8% 100.0% % within Produksi_ASI 59.1% 27.8% 45.0% Total Count 22 18 40 % within Dukungan_Sosial 55.0% 45.0% 100.0% % within Produksi_ASI 100.0% 100.0% 100.0% Correlations Produksi_ASI Dukungan_Sosial Spearman's rho Produksi_ASI Correlation Coefficient 1.000 -.313* Sig. (2-tailed) . .049 N 40 40 Dukungan_Sosial Correlation Coefficient -.313* 1.000 Sig. (2-tailed) .049 . N 40 40 *. Correlation is significant at the 0.05 level (2-tailed).