RR_DSM650_Final Report_4T Exploratory Study on Ithaca_ [2015-05-05]
1. DSM 650 – Creative Economies
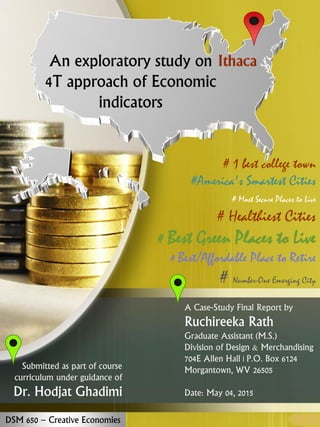
A Case-Study Final Report by
Ruchireeka Rath
Graduate Assistant (M.S.)
Division of Design & Merchandising
704E Allen Hall | P.O. Box 6124
Morgantown, WV 26505
Date: May 04, 2015
Submitted as part of course
curriculum under guidance of
Dr. Hodjat Ghadimi
An exploratory study on
4T approach of Economic
indicators
# 1 best college town
#America's Smartest Cities
# Most Secure Places to Live
# Healthiest Cities
# Best Green Places to Live
# Best/Affordable Place to Retire
# Number-One Emerging City
2. General Outline
Quick Facts … 1
Introduction … 2
Asset Profile: Ithaca
Inventor Patent … 3
Innovation Capacity … 3
High Tech Jobs … 4
Scientists and Engineers … 4
Technology Based Knowledge
Occupation- Tech-pole Index and
Employers … 5
Trade Inventories and Sales … 6
Industry Investment in R&D … 7
Non- Industry Investment in R&D… 7
Technology : Improvements … 8
Movement towards the Green
Economy … 9
Talent – Knowledge, skills, talent …10
Talent – Knowledge Jobs - Productivity
Metrics …11
Venture Capital …12
Tolerance: Supporting Industries …13
Tolerance: Race/Origin …14
Territory- Infrastructure …15
Natural Resources …16
Transportation Resources …17
Energy Resources …18
Other Amenities: Parks and Recreation
…19
Creative Profile: Ithaca
Occupation and Industry Cluster …20
Firm Dynamics & Income Distribution
…21
Change in Employment by Sector…22
Location Quotients and Trends in
Occupations …23
Legal and Regulatory Environments
…24
Predictions …25
Conclusion
Quality of Life and Growth ...26
References
i
3. Ranked by multiple publications as being one of America's Smartest Cities, Most
Secure Places to Live, Healthiest Cities, Best Green Places to Live,
Best/Affordable Place to Retire, Number-One Emerging City, Ithaca offers
something for everyone.
Ithaca ranked #1 best college town in America among the "Top 10 Best College Towns in America" by
Business Insider, January 2013
Ithaca named “ the Most Secure Place to Live“ for city with less than 150,000 residents by Farmers Insurance
Group, October 2012
Ithaca ranked “ #1 College Destination" by American Institute for Economic Research, October 2012
Ithaca ranked one of the "Best River Towns in America" by Outside Magazine, September 2012
Cornell ranked #5 in the “ Top 25 Colleges for Outside Readers" from Outside Magazine, August 2012
Ithaca ranked #5 in "The 10-Best Cities for Millennials," by Moving.com and 24/7WallSt.com, July 2012
Ithaca ranked" #1 for “Prime Workforce Growth” among 365 metro statistical areas, Area Development
Magazine, June 2012
Ithaca ranked 3rd best city for “Finding Employment Right Now,” Forbes, May, 2012
Cayuga Scenic Byway ranked “Top 10 All American Road Trip” by Yahoo Travel, May, 2012
Ithaca ranked top-10 in “Great Quirky Places to Retire,” AARP Magazine, April 2012
Ithaca/Tompkins County ranked a “Top 10 Small to Mid-sized Fourth Economy Community” by Fourth
Economy Consulting, April 2012
Ithaca ranked America’s “most secure small town ”, Farmers Insurance study, Dec. 2011
Ithaca ranked a top-seven retirement town in “Retire Here, Not There,” Smart Money, Nov. 2011
Ithaca ranked one of the “10 Best Places to Retire 2012” by US News & World Report, Oct. 2011
Ithaca ranked one of 19 “Perfect Towns” by Outside magazine, Oct. 2011
Quick Facts, Ithaca, NY
1
4. Introduction
The Town of Ithaca includes a mosaic of rural,
suburban, and urban landscapes that surrounds the
City of Ithaca. It is a college town, a farm town, a
Finger Lakes community, and a tourist destination
renowned for its scenic vistas, forested hillsides,
gorges, waterfalls and Cayuga Lake.
Ithaca’s reputation for a high quality of life and for
being one of the few expanding economies in
upstate New York draws people here. This growth
brings new businesses, new employers, and new
ideas. An expanding population means a broader
base to support the arts, culture, and our many
non-profit organizations.
New practices in planning, development, civil
engineering, and natural resource protection have
emerged– along with more effective tools that
better help communities shape the built
environment and guide their destiny. Concepts
such as Smart Growth, sustainability, new
urbanism, light imprint development, and context
sensitive design were unknown when the previous
plan was adopted 18 years ago.
The American Dream is evolving to reflect today's
lifestyles and values. There is a growing preference
among homebuyers and renters for living in
communities that are walkable, more compact, and
more socially connected–rather than single family
houses in low density suburban subdivisions. This
can be seen locally in the revitalization of many
older neighborhoods in the City of Ithaca. The
Ithaca area is also a destination for a growing
number of retirees who desire the uplifting social,
intellectual, recreational, and cultural environment
offered by college towns.
Town of Ithaca at a glance
Location in Tompkins County, NY
Settled: 1794 (Forest Home area)
Founded: 1821 (split from the Town
of Ulysses)
Area: 30.3 square miles (total), 29.1
square miles (land only)
Elevation: 382' to 1420’
Population (2013): 30,225
Median household income:
$49,457 (US Census ACS 2013)
Prosperity: $48,170
Employment: 46,558
Wages: $36,896
2
5. Technology – Inventions & Innovation
Inventor Patents
Because the New Economy places
a premium on innovation, this
wellspring of innovative activity
has become an important
foundation for many
entrepreneurial ventures.
Inventor patents can quickly turn
into real economic activity.
Thirty-nine percent of
independent inventor patent filers
reported sales from their
inventions, and 20 percent turned
profits. New York city does not
rank even in the 25th–1st
percentile.
Innovation Capacity
Its the fundamental driver of
growth because it makes existing
amounts of capital more
productive.
The innovation capacity
indicators in this section measure
seven aspects of innovation
capacity: 1) share of jobs in high-
tech industries; 2) the share of
workers that are scientists and
engineers; 3) the number of
patents issued to companies and
individuals; 4) industry R&D as a
share of worker earnings; 5) non-
industrial R&D as a share of GSP;
6) clean energy consumption; and
7) venture capital invested as a
share of worker earnings.
New York ranks 18 with a score of 10.7 in 2014.
Source: U.S Patent and Trademark Office, 2011-2012
Innovation Index
Tompkins county: Ithaca
Source: StatsAmerica.org
Asset Profile 3
6. Tompkins county: Ithaca
High-tech specialization of states varies
significantly, from a high of 9 percent of
the workforce in Massachusetts to just 2
percent in Wyoming.
While all states have high-tech jobs, the
leaders tend to be in the Northeast, the
Mountain states, and the Pacific region.
As, per the Bureau of Labor Statistics,
2012, New York is not ranked among top
5 states in High-tech industries.
Scientists and Engineers
The share of the private sector employed
as scientists or engineers
A key driver of the growth of high-
technology and research-based
companies is the availability of a high-
caliber scientific and engineering
workforce. States with the highest
rankings tend to be high-tech states such
as Washington, Virginia, Massachusetts
and Colorado; states with significant
corporate R&D laboratory facilities (such
as Delaware, Connecticut, New Jersey,
New York, and Vermont).
“The total number of scientists and
engineers is strongly correlated with both
patents granted and with industry-funded
R&D.”
High-Tech Jobs
High-Tech Employment Share
Firms requiring a highly skilled and
specialized workforce contribute to
innovation in a region by providing a
resource for workers, other firms and other
industries. (This metric measures the point
in time innovative capacity of the region as
opposed to the growth of innovative
capacity in the productivity and
employment index.)
Source: StatsAmerica.org
Tompkins county: Ithaca
Asset Profile 4
Share of employment in the electronics manufacturing, software and computer-related
services, telecommunications, and biomedical industries
7. Tompkins county: Ithaca
Technology-Based Knowledge Occupations
Rank Score
2 4.70%
High-Wage Traded
Services
6 14.5
Migration of U.S.
Knowledge Workers
8 $66,377
Export Focus of
Manufacturing and Services
10 0.8%
Workforce Education
11 32.8%
Managerial, Professional, and
Technical Jobs Source: 2014 State Economy Index
EMPLOYERS
Source: Tompkins County Area Development
URL:http://www.tcad.org/businessInfo/factsandfigur
es.php#employ, accessed 8/1/11
New York State
Asset Profile
Source: StatsAmerica.org
5
8. Trade Inventories and Sales report
Trade has become an integral part of the
U.S. and world economies. The combined
total of U.S. exports and imports has
increased from just 11 percent of GDP in
1970 to 20 percent in 1990, reaching 30
percent in 2013. Services exports have been
growing in importance over the past three
decades, having increased from 18 percent of
exports in 1980 to over 30 percent in 2013.
Moreover, service exports were impacted less
by the economic recession than goods
exports.
Manufacturing strength has been a driving
force in the U.S. recovery, adding almost
500,000 jobs from 2000 to 2012.
The Rankings: The leading states are
generally those that have high-value-added,
technologically advanced manufacturing
sectors.43 Nevada, the clear winner, has seen
the emergence of a thriving primary metals
manufacturing sector that boosted its
adjusted export value per worker by over
$30,000 since 2010. Louisiana and Texas owe
high ranks to petroleum production.
New York ranks 5th among the top
seven movers.
Source: StatsAmerica.org
Asset Profile 6
Trade Inventory and Sales
9. Industry Investment in R&D
The amount of industry-performed research and development as a percentage of worker
earnings, adjusted for industry composition
Research and development yields
product and process innovations, adds to
the knowledge base of industry, and is a
key driver of economic growth. In 2011,
business performed 69 percent of all U.S.
R&D, with companies funding 81% of
that research.
Non-Industry
Investment in R&D
The amount of research and
development performed outside of
industry as a share of gross state product
Of the top five, only in Massachusetts
does a majority. of non-industrial R&D
come from sources other than federal
labs, with university R&D making up the
lion’s share of R&D preformed. Other
states with large federal facilities, such as
Alabama, Rhode Island, and Virginia also
score well.
Asset Profile 7
Source: National Science Foundation, 2011.
10. methods, real-time bus tracking, online
carpooling services, and other
information technology based services
can help give people the confidence to
try different methods of transportation
The dynamism and competition
indicators in this section measure five
aspects of economic dynamism: 1) the
degree of job churning; 2) the number
fast growing firms; 3) the number and
value of companies’ IPOs; 4) the
number of entrepreneurs starting new
businesses; and 5) the number of
individual inventor patents granted.
Along with jobs and income, it is
frequently these entrepreneurial
businesses — including new
manufacturers — that bring fresh new
ideas and innovations to the
marketplace, replacing those of less
innovative incumbents, and thus raising
living standards. While such turbulence
increases the economic risk faced by
workers, companies, and even regions,
in the New Economy it is a
fundamental driver of innovation and
economic growth.
Technology: Improvements
The County’s Workforce Strategy, updated in
2010 by Tompkins Workforce NY and TCAD
and approved by the County’s Workforce
Investment Board, provides direction for
workforce development activities, and calls for
a coordinated response to rapid economic
globalization, integration of technology into all
occupations, and dramatic demographic
changes. A system where both jobs and
workforce programs support the individual’s
skill and career development, including for
people with disabilities, requires a collaborative
approach among schools, employers, training
entities, and Tompkins Workforce NY.
Applying communication technologies to make
alternatives more convenient for people is
another area to pursue. Creating easy payment.
Asset Profile 8
11. Movement towards a Green Economy
Increasing energy efficiency can lead to
lower costs for businesses, governments,
and residents, making a state a more
attractive place to live and do business.
Ithaca uses 158 metric tons in CO2
emissions (2013), which ranks 9th in
comparison to other states in U.S.
“Between 2008 and 2013, total energy
consumption in the United States fell by 2
percent, while the share of renewable and nuclear
energy increased from 15.7 percent to 17.9
percent.”
The City of Ithaca, with its 2006 Local
Action Plan, has been striving to reduce
greenhouse gas emissions from its
operations. The Plan includes a green fleet
and purchasing and building policies for
city operations, including building
deconstruction (disassembling and
reuse/recycle) and energy efficiency. As
part of the Plan, each department has been
developing its own energy strategy.
Sustainability training is being provided for
City employees, and funding to pay for a
sustainability coordinator comes from the
Mayor’s budget. Cornell’s Climate Action
Plan was also briefly mentioned.
Discussion of the Town’s municipal energy
usage was brief. The Town’s building audits
were mentioned, as was the need to reduce
energy loss from the large windows in
Town Hall.
Source: The Wastewater Treatment facility, which is an inter-
municipal system, entered into a 20‐year energy performance
contract in 2010 and will undergo significant improvements
starting in 2011 to lower energy costs, and emissions over the
long‐term.
Surface transportation is by far the largest
single sector energy user in the
community. Transportation accounted for
42 percent of the energy consumed in
Tompkins County in 2008, and contributes
roughly a third of all community
emissions*.
The Tompkins County Area Development
(TCAD), was trying to incorporate more
green jobs in their structure.
* Building Vibrant Communities in Tompkins County a Development Focus Areas Strategy. 2012.
Asset Profile 9
A weighted measure of the change in energy consumption per capita and the clean energy
share of total energy consumption
12. Tompkins county: Ithaca
Source: StatsAmerica.org
Talent
Knowledge
Jobs
Technology
Innovation
Skills
Knowledge
Tompkins County has a fairly healthy economy, reflected
in continued moderate job growth and slow but steady
population growth. Family income has continued to
improve with the percent of low-income families
dropping from 1980 to 1990 and again from 1990 to 2000.
The distribution of family income remains above the
nation’s. However, there are individuals and families
living in poverty including 30% of all female headed
families with children under 18 years old. And, while the
county has a low unemployment rate, the higher regional
levels of unemployment and limited job opportunities
affect the ability of some residents to find full
employment.
Asset Profile 10
13. Talent – Knowledge, skills, talent
Source: StatsAmerica.org
The “knowledge jobs” indicators measure
seven aspects of knowledge-based
employment:
1) Employment in IT occupations in non-IT
sectors.
2) The share of the workforce employed in
managerial, professional, and technical
occupations
3) The education level of the workforce
4) The average educational attainment of
recent immigrants
5)The average educational attainment of
recent U.S. inter-state migrants
6) Worker productivity in the manufacturing
sector
7) Employment in high-wage traded services.
Workers who were skilled with their hands
and who could reliably work in repetitive
and sometimes physically demanding jobs
were the engine of the old economy. In
today’s New Economy, knowledge-based
jobs are driving prosperity. These jobs tend
to be managerial, professional and technical
positions held by individuals with at least
two years of college education. Such skilled
and educated workers are the backbone of
states’ most important industries, from high-
value-added manufacturing to high-wage
traded services.
Knowledge Jobs
Asset Profile 11
14. In effect, venture capitalists identify
promising innovations and help bring them
to the marketplace. Venture capital funding
peaked in 2000 at $105 billion, in the midst
of the tech boom, and then dropped
precipitously after the tech bubble burst, to
just $20 billion in 2003.
In 2013, 60 percent of venture capital was
located in California and Massachusetts.
strong university engineering and science
programs and an existing base of high-tech
companies, both of which can be the source
of entrepreneurial startups or spinoffs that
receive venture capital funding. Although
there is a -7.64% decline in growth,
Tompkins county is ranked 98th (2012)
among the other states in U.S.
Venture Capital
Source: StatsAmerica.org
Asset Profile
The amount of venture capital invested as a percentage of worker earnings
12
15. Immigration—particularly from Latin
America and Asia—has had a key impact
on the U.S. population’s composition at the
dawn of the 21st century. For example,
more than three-fourths of the country’s
31.1 million foreign-born residents were
born in either Latin America or Asia, with
more than half born in Latin America alone.
(Natives of those two world regions were
nearly 9 percent of the total U.S.
population in 2000.)
Asset Profile 13
Source: U.S. Census Bureau, American Community Surrey, latest 5-Year Estimates
Tolerance: Race & Origin
16. Tolerance: Supporting Industries
According to the Census, the race/ethnicity
breakdown in the Town has historically been
similar to that of Tompkins County and the
Southern Tier region. The Town has lower
racial and ethnic diversity (with the exception
of the Asian population) than New York
State and the United States as a whole.
Tompkins County, N.Y. have sizeable (2,500
or more) Asian American populations and is
home to major universities. The 2010 Census
showed that nearly 80% of people reporting
one race alone in the Town of Ithaca were
White/Caucasian, whereas 11% were Asian,
4% were Hispanic, 4% were Black/African
American, 1% were Some Other Race, and
.1% were American Indian, Alaska Native,
Native Hawaiian, or Other Pacific Islander.
Asset Profile 14
Source: StatsAmerica.org
Ithaca have a solid “innovation
infrastructure” that fosters and supports
technological innovation. Many attract high
levels of domestic and foreign immigration
of highly mobile, highly skilled knowledge
workers seeking good employment
opportunities and a high quality of life.
17. Territory: Infrastructure
The Town of Ithaca exhibits the patterns of
sprawl described by many planners and
educators throughout the United States.
Expensive investments in physical
infrastructure, such as water and sewer
mains, treatment plants, roads, roadside
ditches, bridges, and government offices
should all include climate change projections
in the design, maintenance, and decision-
making process.
Lower density residential development and
commercial strip development outside of the
urban, village and hamlet centers in
Tompkins County has resulted in sprawl
patterns, contributing to fragmentation and
loss of farmland, forests, wildlife habitats, and
other open space resources. Sprawl has also
added to traffic congestion on our streets,
increasing the cost to provide of public
services and infrastructure.
The cumulative effects of development on
steep slopes include loss of scenic amenities,
decreased water quality, increased
downstream runoff and flooding problems,
loss of sensitive habitats, high utility costs,
access challenges (especially for emergency
vehicles) and high maintenance costs of
public infrastructure.
Tompkins County’s existing housing supply
consists largely of older buildings, with a high
proportion oriented towards renters and
students. Of the county’s 41,662 housing
units, 17,114 are renter-occupied and 21,431
are owner-occupied. Approximately 70
percent of all units are located in structures
with one to four units. According to the
Tompkins County Department of
Assessment, 36 percent of the residential
housing stock was built before 1940, another
14 percent was built between 1940 and 1959,
and approximately seven percent of the
housing stock shows definite signs of deferred
maintenance. The large percentage of renters
and students pursuing higher education,
combined with relatively strong employment
and higher wages, differentiates Tompkins
County’s housing market from that of its
neighbors. The results are lower vacancy
rates and higher costs for housing than are
typically found in this region.
Residential energy efficiency is critical both
to the affordability of housing units and
efforts to reduce fossil fuel consumption and
greenhouse gas emissions. The residential
sector is the second highest energy consumer
and greenhouse gas emitter in Tompkins
County, after transportation.
Asset Profile 15
18. Natural Resources
Although energy sources experience
fluctuations in cost over the short term,
overall global demand is anticipated
to drive up prices at the same time extreme
heat and cold weather events become more
frequent and costly in terms of utility bills.
Agriculture is a relatively small local sector of
the economy, but makes up about 30 percent
of the local land base and contributes in
important ways to quality of life. There are
approximately 3,412 acres of agricultural land
in the Town of Ithaca (including Cornell
University agricultural lands):2,832 actively
farmed acres and 580 fallow acres.
Approximately 2,533 acres receive an
agricultural property-tax assessment. Of the
2,533 acres receiving agricultural
assessment, 1,058 acres (42%) are rented to
farmers.
Farmland--and the farmers who work the
land--contribute to the well-being of all Town
residents. In addition to the direct
contribution to the local economy through
production and employment, local farmers
also make significant indirect contributions to
the local economy through the purchase of
equipment and supplies and through their
relatively low demands on costly public
infrastructure. The rural character of the
Town--enjoyed by Town residents and
essential to the local tourist industry—is
provided largely by local farmers and State
Parks.
Perhaps most importantly, farmers in the
Town of Ithaca have established a tradition
of stewardship of the land and its resources.
The quality of life in the Town of Ithaca is
inextricably linked to its natural environment.
These rich physical, biological, ecological,
geological, and scenic resources have long
been recognized as assets that the Town
needs to protect. Mineral resource
excavation in the Town includes sand and
gravel operations. These are usually
processed through screens and crushers and
used in road fill and construction projects.
Extensive mining for salt also occurs under
Cayuga Lake, outside and north of the Town
of Ithaca municipal boundary. Natural gas is
another important local resource. Early
production of natural gas began in western
NYS in the early 1800s, and originated from
seeps and reservoirs in the Devonian-aged
sandstones.
Asset Profile 16
19. Transportation Resources
Transportation infrastructure, including
highways and public transit, represents a
huge and ongoing public investment.
New York State, Tompkins County, and local
municipalities struggle to maintain the
existing network of roads, bridges, and public
transit, even though annual transportation
expenditures (including engineering,
equipment, staff, construction projects,
operations, etc.) by all levels of government
within Tompkins County
total about $65 million, with the bulk of that
coming from the County and local
municipalities. According to the National
Personal Transportation Survey (1995) and
the National Household Travel Survey (2001),
the highest percentage of trips made by
Ithaca area residents are for family or
personal business, social or recreational
business, and work--in that order.
Nearly one in four people employed in
Tompkins County live outside the county;
14,901 workers, or 24% of the county
workforce. This means that Tompkins
County imports workers or commuters, and
exports income, as workers spend their
income in their county of residence. The
Town of Ithaca is home to many major
employers including Cornell University, the
largest employer in the County. Tompkins
County is a regional job center that attracts
employees from throughout the region.
People commuting into Tompkins County for
work increased by 11 percent between 2000
and 2010.
Although many in-commuters certainly
prefer to live in other counties due to family
ties or lifestyle choices, a survey of in-
commuters found Tompkins County’s high
housing prices to be the primary reason for
living outside of the county. In-commuting
impacts the wider community through added
traffic congestion, greater wear and tear on
roads and bridges, increased vehicle
emissions, and increased costs to maintain
the road network.
The Ithaca Tompkins County Transportation
Council (ITCTC) is designated as the
Metropolitan Planning
Organization (MPO) for the Town of Ithaca
and Tompkins County as a whole. All
urbanized areas with a population of greater
than 50,000 people are required by the
federal government to be represented by an
MPO. The ITCTC is charged with facilitating
county-wide transportation planning and
works jointly and cooperatively with all
transportation-related agencies in Tompkins
County*.
*ITCTC website. http://www.tompkins‐co.org/itctc/about.html.
Asset Profile 17
20. Tompkins County can draw on local
renewable energy sources that include solar,
wind, biomass, water, geothermal, and
methane from animal waste. While each of
these sources have significant potential in the
county, each faces its own obstacles to full
deployment, ranging from shading limiting
sitting of roof-mounted solar to local
regulations limiting wind turbines to air
quality concerns limiting biomass stoves.
Protecting and sustainably managing these
natural resources is vital to reducing levels of
greenhouse gases in the atmosphere, and
Tompkins County is fortunate to have
abundant natural resources to help reduce
community emissions.
Energy infrastructure has a dual role with
regard to economic development. Adequate
energy infrastructure is necessary for certain
job-creating projects and investment in
efficiency and renewable energy systems can
be a major driver in creating local jobs.
There is a need in the community to better
understand the sometimes complex energy
demands of local businesses, as well as the
advances made in new energy technologies
that could allow for the development of
homes and businesses without the need for
expansion of existing fossil fuel infrastructure.
Many people assume that Tompkins
County’s electricity is provided primarily by
the Cayuga Power Plant, a 306 megawatt
(MW) coal-fired power plant located in
Lansing, but the county’s electricity is
actually generated from a diverse group of
sources, most of which are located outside of
the local area. According to New York State
Electric and Gas (NYSEG), a mix of fuel
sources is used to generate electricity for our
region, with 47 percent from natural gas, 28
% from nuclear, 13 % from hydroelectric,
five % from wind, four % from coal, and
three % from other sources.
Energy Resources
NYSEG Electricity Grid Fuel Sources (2012)
Source: New York State Electric and Gas
Source: Tompkins County Planning Department
Asset Profile 18
21. Other Amenities: Parks and Recreation
SystemThe Town of Ithaca’s park needs are served
by a variety of both private and public
facilities. These facilities include many
neighborhood parks, one developed
community park, four nature preserves,
several multi-use trails, and numerous
walkways. The existing Town parks provide a
range of recreational facilities including play
structures, ball fields, playfields, sledding hills,
picnic areas, gazebos, pavilion (rentable),
nature trails, and a community garden in one
undeveloped Town park. The multi-use trails
and walkways provide off-street alternatives
for joggers, bikers, and walkers, as well as
commuting paths to work, school or
shopping.
The Ithaca area is also fortunate in having
two large City parks, four State parks, Village
parks, and the open areas of Cornell and
Ithaca College, Finger Lakes Land Trust lands
and other public and private recreational
facilities in the Town or nearby. Two of the
State parks, Buttermilk Falls State Park and
Robert H. Treman State Park, are located
within the Town of Ithaca.
The Town of Ithaca Public Works
Department maintains a system of “close-to-
home space”* consisting of eleven
neighborhood parks, three multi-use trails,
and several undeveloped park sites. These
neighborhood parks provide a range of
recreational facilities including play
structures, ball fields, playfields, grills, picnic
tables, park benches, and walking trails.
Among its many duties, the Town of Ithaca
Public Works Department is responsible for
building and maintaining parks and trails. The
Public Works Department also maintains the
playfield at the private Coddington Road
Community Center, which is open to the
public.
In addition to athletic facilities, Cornell
University maintains large amounts of open
space that is utilized for informal recreational
pursuits like walking, hiking, biking, sledding,
and skiing.
19
Town of Ithaca Parks
Name…………………………... Acreage
Coddington Road Community Center
Playfield ……………………………..12.86
Compton Park (undeveloped) ………..1.49
East Shore Park……………………… 0.29
Eastern Heights Park………………... 15.24
Grandview Park……………………... 2.65
Hungerford Heights Park……………. 1.2
Northview Park……………………… 1.12
Park (undeveloped) @ E. King Road and
Saunders Road………………………. 2.32
Park (undeveloped) @ Perry Lane…… 1.98
Salem Park…………………………... 3.06
Saponi Park (undeveloped)…………... 7.87
Tareyton Park……………………….. 3.35
Troy Park……………………………..4.87
Tudor Park…………………………... 2.22
Tutelo Park……………………………8.1
Vincenzo Iacovelli Park……………… 3.51
West Hill Park (undeveloped) ………..21.71
Woolf Park (undeveloped)…………… 2.06
Total Acreage:……………………… 95.9
* The National Recreation and Park Association (NRPA) classifies “close‐to‐home space” as parks within easy walking
distance of one’s home (one‐half mile or less) that serve parts or all of a neighborhood, including mini‐parks,
neighborhood parks, and community or park areas. Source: Town of Ithaca Park, Recreation and Open Space Plan, 1997.
22. Occupation and Industry Clusters
Occupation and Industry Clusters:
Tompkins County, NY 2010
Description
Occupation
Cluster
Employment
Occ.
Cluster
Share of
Total Emp.
Occ.
Cluster
Employment
LQ
Skilled Production Workers 3,365 5.3% 0.77
Health Care and Medical Science
(Aggregate)
2,888 4.6% 0.81
Health Care and Medical Science (Medical
Practitioners and Scientists)
578 0.9% 0.83
Health Care and Medical Science (Medical
Technicians)
396 0.6% 0.52
Health Care and Medical Science (Therapy,
Counseling and Rehabilitation )
1,915 3.0% 0.91
Mathematics, Statistics, Data and
Accounting
1,409 2.2% 0.91
Legal and Financial Services, and Real
Estate (L & FIRE)
3,690 5.9% 0.75
Information Technology (IT) 1,016 1.6% 0.80
Natural Sciences and Environmental
Management
145 0.2% 0.85
Agribusiness and Food Technology 1,171 1.9% 1.23
Primary/Secondary and Vocational
Education, Remediation & Social Services
6,340 10.1% 1.92
Building, Landscape and Construction
Design
280 0.4% 1.00
Engineering and Related Sciences 764 1.2% 1.35
Personal Services Occupations 1,540 2.4% 1.01
Arts, Entertainment, Publishing and
Broadcasting
2,042 3.2% 1.39
Public Safety and Domestic Security 426 0.7% 0.57
Postsecondary Education and Knowledge
Creation
6,860 10.9% 9.61
Technology-Based Knowledge Clusters 10,772 17.1% 2.17
Source: Economic Modeling Specialists, Inc. Complete Employment Statistics
Tompkins County has a highly-skilled workforce. Many students choose to stay in the region
after graduation--resulting in a high percentage of residents with college and graduate degrees.
This creates opportunities for industries requiring highly educated workers and entrepreneurial
activities. However, the skills embodied in the residents do not necessarily match the skills
demanded by firms in the region.
Immigration of knowledge workers; migration of domestic knowledge workers; worker
productivity in the manufacturing sector; and employment in high-wage traded services is
covered in knowledge jobs indicators.
Occupation
Cluster
Employment
Occ. Cluster
Share of total
Employment
Occ. Cluster
Employment
L.Q
Creative Profile
Source: Economic Modeling Specialists, INC. Complete Employment Statistics
Occupation and Industry Clusters:
Tompkins, NY 2010
20
23. Comparison of US and Tompkins Family Income Distribution 2000
Source: StatsAmerica.org
Firm Dynamics & Income Distribution
Creative Profile 21
Source: U.S Census 2000
24. The Tompkins County economy has grown
steadily from about 17,000 private sector jobs
in 1960 to about 53,300 in 2005. In the same
period, the local economy has experienced
significant restructuring. In 1962,
m a n u f a c t u r in g p e a k e d p r o v id in g
6,200 jobs, which was 36% of all private
sector jobs. In 2005, there were 3,900
manufacturing jobs, less than 8% of all
private sector jobs. Service-providing jobs
now account for 90%, or 48,200 private
sector jobs in Tompkins County in 2005.
Change in Tompkins County Employment by Sector
Source: StatsAmerica.org
Source: NYS Department of Labor
Creative Profile 22
25. Source: bls.gov
Location Quotients and Trends in Occupations
Education, training, and library-related
occupations are the largest occupation group
in Tompkins County.
Almost 9,500 jobs in Tompkins County were
so-categorized in 2007 while office and
administrative support occupations
accounted for more than 8,600 jobsa. Total
employment during the period was 50,341
(according to the Bureau of Labor Statistics).
The occupation profile specific for Town of
Ithaca residents (as provided by the U.S.
Census Bureau- American Community
a The Tompkins County Labor Market Region Study, prepared by Chmura Economic & Analytics
for Tompkins County Area Development (4/21/2008)
b American Community Survey, U.S. Census Bureau.
Survey for 2005-2009), indicates the most
common occupations as: educational
services, healthcare, and social assistance
(56%), followed by arts, entertainment,
recreation, accommodation, and food-service
occupations (9%), professional, scientific,
management, administrative, and waste-
management service (8%), and retail trade
(7%). Eighty-four percent of the people
employed were private wage and salary
workers, 11% Federal, State, or local
government workers, and 5% self-employed
workersb.
Creative Profile 23
26. Legal and Regulatory Environments
Creative Profile
Tompkins County, municipal government,
and school district operations are funded
through four general sources of funds: local
property tax, sales tax, Federal and State aid,
and other sources, including fees and grants.
Whatever the source, nearly all fiscal
resources ultimately come from taxpayers –
and Tompkins County takes seriously its role
in using these taxpayer dollars judiciously.
The County constantly works to maintain a
financially sound government for future
generations without placing an undue
hardship on its taxpayers. As part of this role,
the County maintains funding to deal with
emergency situations that may arise
unexpectedly.
HOUSING ECONOMY - Attracting and
retaining jobs that pay living wages reduces
the need for public assistance to bridge the
gap between individuals’ incomes and their
basic life needs. A strong economy provides
the tax base necessary to support public
services. The provision of stable housing,
including supportive services for those that
need them, yields significant public cost
savings, particularly in terms of emergency
medical and criminal justice services.
THE ENVIRONMENT - Protecting
important natural resources makes fiscal
sense. The cost of treating water for public
consumption is lower when the water
entering the system is fairly clean to begin
with. Avoiding the adverse impacts
associated with storm water runoff using
natural systems, like wetlands, is less
expensive than using engineered systems, like
detention basins. And exposure to a polluted
environment can lead to increased public
health costs.
CLIMATE CHANGE - The anticipated
impacts of climate change are expected to
dramatically increase government
expenditures. Post-disaster recovery costs are
often paid with local, state, and federal
government funds. The increasingly intense
storms will also strain local storm water
infrastructure. Anticipating impacts and
planning to reduce their severity is fiscally
prudent. It is often much cheaper to avoid
the problems associated with severe weather
than it is to pay for recovery after the fact.
NEIGHBORHOODS & COMMUNITIES –
Compact development lowers costs of
government services by utilizing and
reinvesting in existing infrastructure and
broadening the base that bears the cost of
maintaining that infrastructure into the
future.
MAINTAINING INFRASTRUCTURE -
Inter-governmental cooperation reduces
costs by ensuring the infrastructure
developed and maintained by the State,
County, and local municipalities functions as
an interconnected system. Cooperative
agreements between governmental units can
also reduce costs by allowing for equipment
sharing and joint infrastructure investments,
and by reducing duplication of effort.
24
27. Predictions
Tompkins County Labor Market and Job Growth
Projections 2014 to 2024
Source: TCAD analysis of Woods and Poole demographic
projections, Cornell PAD labor market participation, Jobs EQ employment projections
Job creation and economic development
have recently been elevated in importance
for a wide variety of state programs. New
York State has recently supported two
economic development
initiatives, in partnership with local
institutions of higher education, whose goals
are to promote technology transfer,
commercialization, and entrepreneurship.
START-UP NY (SUNY Tax-free Areas to
Revitalize and Transform Upstate NY)
provides tax-free status for ten years for
businesses locating in pre-designated
university zones, including one at Cornell
that could be an important means of High-
tech business in Tompkins County.
The County’s Workforce Strategy is the
system where both jobs and workforce
programs support the individual’s skill and
career development, including for people
with disabilities, requires a collaborative
approach among schools, employers, training
entities, and Tompkins Workforce NY.
Creative Profile 25
28. With vibrant arts, cultural, educational, and
culinary offerings; beautiful parks, natural
areas, and working rural landscapes;
abundant recreational opportunities; good
schools; low crime rates; and a strong sense
of community engagement, residents in
Tompkins County enjoy a very high quality
of life. The community regularly makes “top
ten” lists for great places to live. This high
quality of life plays an important role in
attracting and retaining employees and
businesses in knowledge industries, while
benefiting from those same jobs to supply
wealth in the community.
The relationship between quality of life and
economic development is at once mutually
supportive and divergent, and
should be considered carefully and nurtured.
Too much development, too quickly, in
industries that detract from the community’s
vision for itself can threaten the quality of
life upon which long-term prosperity
depends. Growth that supports the
community’s vision enhances local quality of
life. The challenge is to focus on
development that enhances and does not
degrade the natural landscape, sense of
place, and community character, but that
does provide competitive job opportunities
across a variety of educational and skill levels
and brings more living wage jobs to local
residents. In certain cases, enhanced
incentives might be offered for projects that
support key community objectives such as
Conclusion
paying a living wage or reducing greenhouse
gas emissions.
Tompkins Consolidated Area Transit,
inside the Bus.
26
29. References
Florida, R. (2004). The rise of the creative class and how it’s transforming work, leisure, community and
everyday life (Paperback Ed.).
Billings, K., Clerk, T., Noteboom, F., Walker, D., Qamar, R., Kolhatkar, G., and Suk, H. Regular Meeting of
the Ithaca Town Board Monday, May 12, 2008 at 5: 30 pm 215 North Tioga Street, Ithaca, NY 14850.
Tompkins County Legislature (2015), Tompkins County 2015 Comprehensive Plan Report, March 2015,
Retrieved from http://www.tompkinscountyny.gov/compplan (last accessed: April, 2015).
Tompkins County Area Development (2006). Tompkins County’s 2006 Economic Development Strategy,
September 2006, Retrieved from http://www.tcad.org (last accessed: April 2015).
Tompkins County Area Development (2010), Tompkins County Workforce Strategy, January 2010,
Retrieved from http://www.tompkinscountyny.gov/wfny (last accessed: April 2015).
Atkinson, R. D., & Andes, S. (2014). The 2014 State New Economy Index: Benchmarking Economic
Transformation in the States. Ewing Marion Kauffman Foundation.
U.S. Bureau of Labor Statistics (2015). Retrieved from
http://data.bls.gov/location_quotient/ControllerServlet (last accessed: April, 2015).
U.S. Energy Information Administration (2015), Retrieved from http://www.eia.gov (last accessed, April
2015).
StatsAmerica, Indiana Business Research Center, U.S. Commerce Department, Economic Development
Administration (2015), http://www.statsamerica.org/ (last accessed: April, 2015).
Ezell, S. (2010). Explaining international it application leadership: Intelligent transportation systems. The
Information Technology and Innovation Foundation (ITIF). Washington DC.
TCAD analysis of Woods and Poole demographic projections (2014), Cornell PAD labor market
participation, Jobs EQ employment projections.
The Tompkins County Labor Market Region Study, prepared by Chmura Economic & Analytics for
Tompkins County Area Development (4/21/2008).
American Community Survey, U.S. Census Bureau, http://www.census.gov (last accessed: April 2015)
NYS Department of Labor Data Report (2013).
Economic Modeling Specialists, INC (2012). Complete Employment Statistics.
New York State Electric and Gas Data Report (2012).
Tompkins County Area Development (2012). Building Vibrant Communities in Tompkins County: A
Development Focus Areas Strategy, Retrieved from http://www.tompkinscountyny.gov (last accessed:
April 2015).
27