SBI Dynamic Asset Allocation Fund: An Open-ended Dynamic Asset Allocation Scheme - Sep 16
•
1 j'aime•496 vues

SBI Dynamic Asset Allocation Fund is an open-ended dynamic asset allocation scheme which aims to provide investors an opportunity to invest in a portfolio of a mix of equity and equity-related securities and fixed-income instruments which will be managed dynamically so as to provide investors with long-term capital appreciation.To know more about this mutual fund check SBI Mutual Fund page https://www.sbimf.com/Products/HybridSchemes.aspx

Recommandé
Recommandé
Contenu connexe
Tendances
Tendances (20)
Similaire à SBI Dynamic Asset Allocation Fund: An Open-ended Dynamic Asset Allocation Scheme - Sep 16
Similaire à SBI Dynamic Asset Allocation Fund: An Open-ended Dynamic Asset Allocation Scheme - Sep 16 (20)
Plus de SBI Mutual Fund
Plus de SBI Mutual Fund (20)
Dernier
Dernier (20)
SBI Dynamic Asset Allocation Fund: An Open-ended Dynamic Asset Allocation Scheme - Sep 16
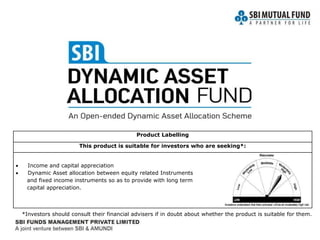
- 1. Product Labelling This product is suitable for investors who are seeking*: Income and capital appreciation Dynamic Asset allocation between equity related Instruments and fixed income instruments so as to provide with long term capital appreciation. *Investors should consult their financial advisers if in doubt about whether the product is suitable for them.
- 2. Index • The Asset Allocation Puzzle • Need for Asset Allocation • Why have a Dynamic Asset Allocation Strategy? • SBI Dynamic Asset Allocation Fund • Key Features • Why Invest? • Investment Team
- 3. The Asset Allocation Puzzle
- 4. The Asset Race: Winners change frequently Past performance may or may not be sustained in future. Source: Bloomberg, CRISIL Fund Analyzer. Equity refers to S&P BSE Sensex, Debt refers to Crisil Composite Bond Fund Index, Cash refers to Crisil Liquid Fund Index The top & bottom performing asset class changes from year to year! Equity Cash Equity Cash Equity Equity Debt Winner Debt -52% 81% 17% -25% 26% 9% 30% -5% 9% 4% 5% 7% 9% 4% 14% 9% 8% 5% 5% 8% 9% 9% 9% 8% 2008 2009 2010 2011 2012 2013 2014 2015 Cash Debt Equity
- 5. The Asset Allocation Puzzle! What do I do?
- 6. Need for Asset Allocation
- 7. Every asset has its place in the puzzle Equity Debt Cash Long term Wealth Generator Higher potential for gain Potential Hedge against Inflation Regular Income Lower risk Potential to preserve capital in times of downturn High Liquidity Safe avenue for parking extra cash High Risk Higher Volatility Conservative Investments Possibility of lower than inflation returns Very low inflation adjusted potential returns
- 8. In times of crisis, correlation comes to the forefront Past performance may or may not be sustained in future. Source: Bloomberg, CRISIL Fund Analyzer. Equity refers to S&P BSE Sensex, Debt refers to Crisil Composite Bond Fund Index, Cash refers to Crisil Liquid Fund Index. Correlation above has been calculated on daily returns. Equity Debt Long Term Correlation (Mar 2002 to September 2016) Debt 0.14 Cash 0.04 0.31 Correlation in times of Equity Market Crash Sep 2008 (Lehman Crisis) Debt -0.23 Cash -0.11 0.52 Aug – Sep 2011 (Sovereign Debt Crisis) Debt -0.29 Cash -0.04 0.57 In the long term, equity, debt & cash have low correlation with each other However, when markets crash, equity has a negative correlation with debt & cash
- 9. Maximum Return 62.30% Average Return 17.91% Minimum Return (8.27%) Maximum Return 30.68% Average Return 12.66% Minimum Return 0.53% Maximum Return 12.65% Average Return 6.38% Minimum Return 2.27% Maximum Return 8.95% Average Return 6.86% Minimum Return 4.40% -20% 0% 20% 40% 60% 80% 100% Equity Simulated Portfolio Debt Cash Diversifying the portfolio leads to stability Past performance may or may not be sustained in future. Source: Bloomberg, CRISIL Fund Analyzer. Equity refers to S&P BSE Sensex, Debt refers to Crisil Composite Bond Fund Index, Cash refers to Crisil Liquid Fund Index Simulated Portfolio refers to 50% S&P BSE Sensex + 25% Crisil Composite Bond Fund Index + 25% Crisil Liquid Fund Index rebalanced on a daily basis. The above chart depicts the high-average-low 3 year return (CAGR) of the specified asset classes/ simulated portfolio.*Launch of Crisil Composite Bond Fund Index & Crisil Liquid Fund Index. Combining equity with debt stabilizes the portfolio without compromising on growth Higher Return – Higher Risk Lower Return – Lower Risk Rolling 3 year return (Mar 2002* – September 2016)
- 10. Simulated Portfolio Diversification solves the Asset Allocation puzzle Past performance may or may not be sustained in future. Source: Bloomberg, CRISIL Fund Analyzer. Equity refers to S&P BSE Sensex, Debt refers to Crisil Composite Bond Fund Index. Simulated Portfolio refers to 50% S&P BSE Sensex + 25% Crisil Composite Bond Fund Index + 25% Crisil Liquid Fund Index rebalanced on a daily basis. Risk above refers to standard deviation. Standard deviation has been calculated on daily returns. Returns above are CAGR returns for the specified period. Diversifying across asset classes helps generate superior risk adjusted returns under different market cycles Equity Simulated Portfolio Debt Cash -8% -6% -4% -2% 0% 2% 4% 6% 8% 0% 10% 20% 30% 40% 50% Return Risk Falling Equity markets Risk Return for the period: Dec 07 (Sensex at 20286) to Dec 09 (Sensex at 17465) Equity Debt Cash 0% 2% 4% 6% 8% 10% 12% 14% 16% 18% 20% 0% 5% 10% 15% 20% 25% 30% Return Risk Rising Equity markets Risk Return for the period Dec 12 (Sensex at 19427) to Mar 15 (Sensex at 27957)
- 11. Why have a Dynamic Asset Allocation Strategy?
- 12. Dilemma faced by Investors How do I control my bias while taking investment decisions? How do I time the markets? How do I allocate assets & rebalance my portfolio in a cost effective manner? Asset Allocation is important. But how do I manage my portfolio?
- 13. Traditionally past performance drives flows Past performance may or may not be sustained in future. Source: Bloomberg, AMFI. Equity refers to S&P BSE Sensex. Returns refers to absolute returns. Investors typically make the mistake of buying at peaks & selling at lows An asset allocation model which dynamically allocates will remove the bias of investors Equity returns (Mar 07 – Mar 08): 19.7% Equity Fund Inflows in Mar 07 – Mar 08: +ve Rs. 46,933 crs Equity returns (Mar 08 – Mar 09): -37.9% What happened Equity returns (Mar 11 – Mar 13): -3.1% Equity Fund Outflows in Mar 12 – Mar 13: -ve Rs. -14,587 crs Equity returns (Mar 13 – Jan 15): 54.9% What happened AfterBefore
- 14. Dynamic Asset Allocation: The Solution Model driven asset allocation which decides the appropriate allocation to equity, debt & cash No Emotional Bias No need for timing the market Operationally Effective – both from cost & tax perspective & reduces transactional hassles
- 15. SBI Dynamic Asset Allocation Fund
- 16. SBI Dynamic Asset Allocation Fund at work Equity: 0 to 100% Debt & Money Market Instruments: 0 to 100% Momentum Exhaustion of Momentum Rate of Change in Momentum Market Weakness Market Strengths Objective: To dynamically allocate across asset classes in order to generate superior risk adjusted returns
- 17. Parameters driving the model Momentum Rate of Change in Momentum Exhaustion of Momentum Indicates trends & change in the psychology of market participants Mitigates the effect of sharp movements in markets Attempts to pinpoint market peaks or bottoms Identifies likely momentum exhaustion points Purpose Under normal market conditions Under normal market conditions At market inflection points When does it come into play Model works on exhaustive checklists & filters to generate buy or sell signals
- 18. Model dynamically allocates between assets Past performance may or may not be sustained in future. Source: Internal, Bloomberg. Average is the daily average for the month. Above chart shows movement of the equity allocation along with the S&P BSE Sensex level movement. The chart above is provided purely to explain the concept of SBI Dynamic Asset Allocation Fund (SDAAF) proprietary model & does not in any manner indicate the future results or asset allocation.
- 19. Model dynamically allocates between assets Past performance may or may not be sustained in future. Source: Internal, Bloomberg. Average is the daily average for the month. Above chart shows movement of the cash & money market allocation along with the 91 day Tbill yield movement. The chart above is provided purely to explain the concept of SBI Dynamic Asset Allocation Fund (SDAAF) proprietary model & does not in any manner indicate the future results or asset allocation.
- 20. Model dynamically allocates between assets Past performance may or may not be sustained in future. Source: Internal, Bloomberg. Average is the daily average for the month. Above chart shows movement of the debt allocation along with the 10 year Gsec yield movement. The chart above is provided purely to explain the concept of SBI Dynamic Asset Allocation Fund (SDAAF) proprietary model & does not in any manner indicate the future results or asset allocation.
- 21. Performance Past performance may or may not be sustained in future. Returns (in %) other than since inception are absolute, calculated for growth option and in INR are point-to-point (PTP) returns calculated on a standard investment of 10,000/-. Inception date of the scheme is 26/03/2015. NAV (Regular plan Growth option) 30-Sep-2015: INR 9.7938, 30-Sep-2016: INR 10.7775. Additional benchmark as prescribed by SEBI for equity schemes is used for comparison purposes. Data as on 30/09/2016. 30-Sep-2015 To 30-Sep-2016 30-Sep-2014 To 30-Sep-2015 28-Sep-2013 To 30-Sep-2014 Since Inception Absolute Returns (%) CAGR Returns (%) PTP Returns (INR) SBI Dynamic Asset Allocation Fund 10.04 N.A. N.A. 5.06 10,777.50 50% Crisil 1 year CD Index + 50% S&P BSE Sensex (Scheme Benchmark) 7.47 N.A. N.A. 5.06 10,777.78 S&P BSE Sensex (Additional Benchmark) 6.54 N.A. N.A. 0.98 10,148.73
- 22. Fund Philosophy & Asset Allocation • Aims to provide investors with an opportunity to invest in a portfolio of a mix of equity and equity related securities and fixed income instruments which will be managed dynamically so as to provide investors with long term capital appreciation • Invests across equity, debt & cash • Aims to generate appreciation through asset allocation • Suitable for investors looking for superior risk adjusted returns over the long term • Indicative Asset Allocation * Exposure to securitized debt may be to the extent of 20% of the net assets. Exposure in derivatives will not exceed 50% of the net asset of the Scheme. The cumulative gross exposure through Equity & Equity related instruments, Debt & Money Market Securities including derivatives positions will not exceed 100% of the net asset of the Scheme. The Scheme shall not invest in repo in corporate debt. The Scheme may engage in securities lending and short selling in accordance with SEBI (MF) Regulations. #Investments in foreign securities /ADR/GDR/ would comply with the Guidelines and overall limits laid down for Mutual funds by SEBI for investments in foreign securities. Instruments Indicative allocations (% of total assets)* Risk Profile Minimum Maximum Equity and equity related instruments including foreign securities# 0 100 High Debt and Money Market instruments* 0 100 Low to Medium
- 23. Key Features Plans/ Options The Scheme has two plans viz. Regular plan & Direct plan. Both plans would offer Growth & Dividend options. Dividend option will have the facility of Reinvestment, Payout & Transfer Benchmark 50% Crisil 1 year CD Index + 50% BSE S&P Sensex Fund Manager For Equity & Equity related, Debt & Money Market Instruments: Mr. Dinesh Balachandran For Foreign Securities: Ms. Nidhi Chawla Load Structure Entry Load: Not Applicable Exit Load: For exit within 12 months from the date of allotment -1% For exit after 12 months from the date of allotment - Nil Minimum Application Amount Rs. 5,000/- and in multiples of Re. 1 thereafter Additional Purchase Amount Rs. 1,000/- and in multiples of Re. 1 thereafter
- 24. Clarifications on Tax Query Clarification What will be the category of the fund? Can be both Equity Oriented Scheme or Non-equity Oriented scheme How will the category of the scheme be defined? Based on the equity shareholding of the fund of last 12 months What is the % of equity shareholding required for the fund to be defined as an equity fund? More than 65% How is the % of equity shareholding calculated? Percentage of equity shareholding will be computed with reference to the annual average of the monthly averages of the opening and closing figures What is the relevant date for tax status purpose? For redemption – Date of redemption For dividend – Record date of the dividend What is the relevance of investment date? It is used for calculating the long term or short term capital gains. However, taxation status (Equity or Debt) is defined on the basis of status of the scheme on the day of redemption. How can the investor know about the status of the scheme on the date of their redemption? On monthly basis, monthly average (average of opening & closing) of equity & debt holdings will be disclosed on the website of SBI Mutual Fund (www.sbimf.com). A history of past 5 years of these averages will be available on website. Investor can use this data to calculate the status of the scheme on the date of their redemption. The above table has been given for general information only. Investors are advised to consult their Tax/ Financial Advisor before taking decision of Investment.
- 25. Tax Illustration Date of Investment Date of Sale/ Redemption Tenure of holding in days Average of the monthly averages of percentage equity shareholding Asset class classification for taxation (equity oriented/other than equity oriented) (A) Term classificatio n for taxation (short term /long term) (B) Current applicable tax rates* Scenario 1 05-Nov-15 03-Feb-16 90 49.98% Other than Equity Short Marginal tax rate of investor Scenario 2 13-Mar-15 13-Mar-16 366 56.81% Other than Equity Short Marginal tax rate of investor Scenario 3 1-Dec-12 26-Mar-16 1211 62.60% Other than Equity Long 20% with indexation Scenario 4 06-Feb-15 07-May-15 90 68.27% Equity Short 15% Scenario 5 04-Jun-14 05-Jun-15 366 73.45% Equity Long Nil Scenario 6 16-Jul-12 18-Jul-15 1097 78.84% Equity Long Nil Current tax rates are given on slide no.30 * Plus applicable surcharge & cess The above table has been given for general information only. Investors are advised to consult their Tax/ Financial Advisor before taking decision of Investment. The tax rates shown above are as per the IT slab applicable to Individual/ HUF assesse for FY 2015-16 exclusive of cess & surcharge. Based upon the classification in column A and B in the above table, investor can determine their applicable taxes
- 26. Why Invest? Model driven dynamic asset allocation Dynamically allocates between equity, debt & cash based on prevailing market & economic conditions; solves the dilemma of selecting the correct asset class No Emotional bias The allocation and rebalancing decisions in this fund are based on well defined and tested processes that removes the short term biases of analysts and fund managers 1 2 Operationally convenient Allows investment into multiple asset classes without the operational hassles3 Tax Efficiency Movement across asset classes does not lead to tax liability in the hands of the investor 4 Fund for every market cycle Suitable for investors looking for stable risk-adjusted returns irrespective of market conditions 5
- 27. SBI Funds Management Private Limited 63% 37% India’s premier and largest bank with over 200 years experience (Estd: 1806) Asset base of USD 423 bn* Pan-India network of ~23,010 branches and 56,930 ATM’s as at end of September 2015 Servicing over 290 million customers Global leader in asset management Backed by Credit Agricole and listed in Euronext Paris More than 2,000 institutional clients and distributors in 30 countries Over 100 million retail clients via its partner networks €985 bn AuM as at end of December 2015 *Source: SBI Analyst Presentation as on end September 2015. USD 1 = INR 65.74 # Source : Amundi website as on end December 2015
- 28. SBI FM: Strengths Transforms To Experience Established in 1987: A leading asset manager in India 28 Broad Investor Base AUM INR 1,31,554 Cr Wide Distribution Network Experienced Investment Team Extensive Product Range INR 1,31,554 Crores* AAUM in mutual funds Asset management across mutual funds, segregated managed accounts, domestic advisory & offshore advisory business Multiple asset classes ranging from equities and debt, money market to ETFs and structured funds Investment team of 32 professionals with strong track record Broad customer base with over 40 lakh folios of individual, corporate and institutional investors * Quarterly average September, 2016
- 29. Annexure
- 30. Investment Team Navneet joined SBIFM as Chief Investment Officer in 2008. Navneet is responsible for overseeing investments across asset classes worth over $10 billion. His prior stint was with Morgan Stanley Investment Management as Executive Director and head- multi strategy boutique. Prior to that, Navneet was the Chief Investment Officer - Fixed Income and Hybrid Funds at Birla Sun Life Asset Management Company Ltd. Navneet had been associated with the financial services business of the Birla group for 14 years and worked in various areas such as fixed income, equities and foreign exchange. Navneet holds masters in accountancy and business statistics from the University of Ajmer and is a Chartered Accountant from ICAI. He is a charter holder of the CFA Institute USA and CAIA Institute USA. He is also an FRM charter holder of Global Association of Risk professionals (GARP) Navneet Munot CFA – Chief Investment Officer Dinesh has over 13 years of industry experience. Dinesh joined SBIFM in 2012 as a senior credit analyst. He is also the Head of Research. Dinesh started his career with Fidelity USA in 2001 where he covered all major facets of the US fixed income market over 10 years. Dinesh holds a B.Tech degree from IIT, Mumbai and M.S degree from Massachusetts Institute of Technology (MIT). He is also a Charter holder of the CFA Institute, USA. Dinesh Balachandran CFA - Portfolio Manager
- 31. SBIFM: A Complete Framework
- 32. Current Tax Rates Above tax rates will further increase by applicable surcharge & cess. * For investments held for more than 12 months. ^ For investments held for more than 36 months. The above table has been given for general information only. Investors are advised to consult their Tax/ Financial Advisor before taking decision of Investment. The tax rates shown above are as per the IT slab applicable to Individual/ HUF assesse for FY 2016-17 exclusive of cess & surcharge. MF Taxation Equity Schemes Dividend Distribution Tax Nil Capital Gains Short Term Capital Gains – 15% Long Term Capital Gains* - Nil Debt & Liquid Schemes and FOF Dividend Distribution Tax Individual/ HNI – 25% Others – 30% Capital Gains Short Term Capital Gains – At marginal tax rate Long Term Capital Gains^ – 20% with indexation
- 33. Disclaimer Mutual Fund investments are subject to market risks, read all scheme related documents carefully. This presentation is for information purposes only and is not an offer to sell or a solicitation to buy any mutual fund units/securities. The views expressed herein are based on the basis of internal data, publicly available information & other sources believed to be reliable. Any calculations made are approximations meant as guidelines only, which need to be confirmed before relying on them. These views alone are not sufficient and should not be used for the development or implementation of an investment strategy. It should not be construed as investment advice to any party. All opinions and estimates included here constitute our view as of this date and are subject to change without notice. Neither SBI Funds Management Private Limited, SBI Mutual Fund nor any person connected with it, accepts any liability arising from the use of this information. The recipient of this material should rely on their investigations and take their own professional advice