1. Acknowledgements
Discussion
Conclusion
Buzzword Influence on restaurant
sales at jasmin Mediterranean bistro
Kristen
Bochicchio,
Allison
Clonch,
Sam
Cho,
Kayla
Hale,
Dana
Said
Methods
Introduc7on
• Our
research
group
partnered
with
Jasmin
Mediterranean
Bistro,
a
casual
dining
establishment,
to
analyze
the
impact
on
sales
of
items
aBer
the
introducCon
of
poster
adverCsements
featuring
nutriConal
buzzwords.
Results
We
collected
data
by
prinCng
daily
summary
receipts
without
administering
our
intervenCon.
This
gave
us
a
baseline
to
compare
our
data
from
Week
2.
Week
1:
Control
Period
We
released
an
online
survey
that
asked
customers
to
indicate
the
extent
to
which
the
buzzwords
would
influence
them
to
purchase
the
chosen
items.
We
adverCsed
the
survey
using
table
toppers
and
signs
posted
around
the
restaurant.
Customers
required
a
valid
email
address
to
enter
the
survey,
and
upon
compleCon,
received
a
10%
off
Jasmin’s
coupon
as
compensaCon.
We
compared
these
results
to
the
data
generated
from
our
intervenCon.
Week
3:
Survey
AdministraCon
• The
U.S.
has
seen
a
rapid
increase
in
rates
of
obesity
and
meals
eaten
away
from
home.
Diets
where
meals
are
consumed
outside
the
home
at
restaurants
or
fast
food
establishments
have
been
shown
to
be
of
poor
nutriConal
quality.1
• NutriCon
labeling
and
its
impacts
on
consumer
preference
is
an
acCve
area
of
research.
Much
of
this
research
revolves
around
the
use
of
calorie
counts,
but
the
effecCveness
of
such
intervenCons
has
been
mixed.2,3,4
• Words
like
“organic”
and
“local”
have
also
gained
in
popularity,
but
no
research
has
explored
effects
of
these
buzzwords
on
consumer
preference
in
a
restaurant
seZng.5
y
=
0.6182x
+
20.6
10
15
20
25
30
35
3/16
3/17
3/18
3/19
3/20
3/23
3/24
3/25
3/26
3/27
Number
of
sales
per
day
Figure
3.
The
trend
of
sales
for
Chicken
Shawarma
from
Week
1
and
Week
2.
The
posiCve
slope
(m=0.6182)
on
the
trendline
represents
an
increase
in
sales
from
Week
1
to
Week
2.
Chicken
Shwarma
y
=
0.2485x
-‐
0.6667
0
1
2
3
4
3/16
3/17
3/18
3/19
3/20
3/23
3/24
3/25
3/26
3/27
Number
of
sales
per
day
Figure
4.
The
trend
of
sales
for
whole
wheat
wraps
from
Week
1
and
Week
2.
The
posiCve
slope
(m=0.2485)
on
the
trendline
represents
an
increase
in
sales
from
Week
1
to
Week
2.
Whole
Wheat
Wraps
y
=
0.6909x
+
7.2
0
2
4
6
8
10
12
14
16
18
20
3/16
3/17
3/18
3/19
3/20
3/23
3/24
3/25
3/26
3/27
Number
of
sales
per
day
Figure
1.
The
trend
of
sales
for
Spinach
Zaki
from
Week
1
and
Week
2.
The
posiCve
slope
(m=0.6909)
on
the
trendline
represents
an
increase
in
from
Week
1
to
Week
2.
Spinach
Zaki
y
=
-‐0.0061x
+
5.3333
0
1
2
3
4
5
6
7
8
3/16
3/17
3/18
3/19
3/20
3/23
3/24
3/25
3/26
3/27
Number
of
sales
per
day
Figure
2.
The
trend
of
sales
for
Eggplant
Zaki
from
Week
1
and
Week
2.
The
negaCve
slope
(m=-‐0.0061)
on
the
trendline
represents
a
slight
decrease
in
sales
from
Week
1
to
Week
2.
Eggplant
Zaki
Special
Thanks
to:
Jasmin
Mediterrean
Bistro
Suzie
Goodell,
PhD,
RD
Survey
ParCcipants
InterventionIntervention
InterventionIntervention
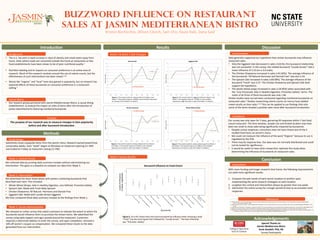
Figure
5.
At
n=49,
shows
how
much
each
buzzword
has
influence
when
choosing
a
meal.
“Fresh”
has
the
most
impact
then
followed
by
“Locally
Grown”.
The
least
influenCal
was
“Promotes
SaCety”.
Buzzword
Influence
on
Food
Choice
Jasmin
Bistro
Background
SelecCvely
chose
unpopular
items
from
the
Jasmin
menu.
Research
period
lasted
three
consecuCve
weeks.
Each
“week”
began
on
Mondays
at
restaurant
opening
(11
AM)
and
ended
on
Fridays
at
restaurant
closing
(11
PM).
Study
Design
We
adverCsed
the
items
listed
above
with
posters
containing
buzzwords
that
described
each
item.
This
included:
• Whole
Wheat
Wraps:
Aids
in
Healthy
DigesCon,
Less
Refined,
Promotes
SaCety
• Spinach
Zaki:
Made
with
Fresh
Baby
Spinach
• Chicken
Shawarma:
All
Natural-‐
Hormone
and
Steroid-‐Free
• Eggplant
Zaki:
Made
with
Locally-‐Grown
Eggplant
We
then
compared
these
daily
summary
receipts
to
the
findings
from
Week
1.
Week
2:
IntervenCon
Our
survey
was
only
open
for
5
days,
garnering
49
responses
within
1
fast
food,
casual
restaurant.
The
Cme
window,
sample
size
and
limited
locaCon
may
have
been
too
small
to
show
sales
being
significantly
impacted
by
buzzwords.
• Despite
survey
responses,
consumers
may
not
have
chosen
any
of
the
4
studied
food
items
on
Jasmin's
menu.
• We
could
not
measure
the
influence
of
the
word
“Organic”
because
its
use
is
regulated
by
the
FDA.
• There
may
be
response
bias.
Our
data
was
not
normally
distributed
and
could
not
be
tested
for
significance.
• It
would
be
useful
to
have
other
researchers
replicate
this
study
when
determining
the
influence
of
buzzwords
on
restaurant
sales.
LimitaCons
With
more
funding
and
longer
research
Cme
frame,
the
following
improvements
can
yield
more
significant
results:
1. Compare
the
sale
trends
of
each
Jasmin
locaCon
to
another
upon
implemenCng
the
same
research
strategies
on
each
locaCon.
2. Lengthen
the
control
and
intervenCon
phases
by
greater
than
one
week.
3. Administer
the
online
survey
for
a
longer
period
of
Cme
to
accumulate
more
responses.
ImplicaCons
Data
generally
supported
our
hypothesis
that
certain
buzzwords
may
influence
restaurant
sales.
• Only
the
Eggplant
Zaki
decreased
in
sales
(-‐0.61%);
this
buzzword
relaConship
was
not
successful.
In
the
survey,
the
related
buzzword
“Locally
Grown”
had
a
mean
influence
of
2.33
(on
a
3.0
scale).
• The
Chicken
Shawarma
increased
in
sales
(+61.82%).
The
average
influence
of
the
buzzwords
“All
Natural-‐Hormone
and
Steroid
Free”
was
also
2.33.
• The
Spinach
Zaki
increased
in
sales
(+69.09%).
The
average
influence
of
the
buzzword
“Fresh”
was
2.57.
The
Chicken
Shawarma
and
Spinach
Zaki
both
support
the
hypothesis.
• The
whole
wheat
wraps
increased
in
sales
(+24.85%)
when
associated
with
the
“Less
Processed,
Aids
in
Healthy
DigesCon,
Promotes
SaCety”
terms.
The
mean
of
all
three
of
these
buzzwords
was
only
1.86.
Similar
studies
have
not
yet
been
conducted
regarding
nutriConal
buzzwords
on
restaurant
sales.5
Studies
researching
calorie
counts
on
menus
have
yielded
mixed
results
on
item
sales.2,3,4
This
can
be
applied
to
our
findings
that
only
some
of
the
items
showed
a
posiCve
sales
trend
aBer
buzzword
introducCon.
InterpretaCon
Week
1
&
Week
2
Sale
Changes
Week
3
Survey
Results
The
purpose
of
our
research
was
to
measure
changes
in
item
popularity
before
and
aSer
buzzword
introduc7on.
Purpose
1.
Todd
JE,
Mancino
L,
Lin
B.
The
Impact
Away
From
Home
on
Adult
Diet
Quality.
US
Dept
of
Ag.
Economic
Research
Report
no.
90.
hrp://www.ers.usda.gov/media/136609/
err90_1_.pdf
Accessed
January
27,
2015.
2.
Elbel
B,
Kersh
R,
Brescoll
V,
Dixon
L.
Calorie
Labeling
And
Food
Choices:
A
First
Look
At
The
Effects
On
Low-‐Income
People
In
New
York
City.
Health
Aff
(Millwd).
2009:28(6):
w1110-‐
w1121
3.
Krukowski
RA,
Harvey-‐Berino
J,
Kolodinsky
J,
Narsana
RT,
DeSisto
TP.
Consumers
May
Not
Use
or
Understand
Calorie
Labeling
in
Restaurants.
J
Am
Diet
Assoc.
2006:106(6):917-‐920
4.
Roberto
CA,
Larsen
PD,
Agnew
H,
Baik
J,
Brownell
KD.
EvaluaCng
the
Impact
of
Menu
Labeling
on
Food
Choices
and
Intake.
Am
J
Public
Health.
2010;
100(2):
312-‐318.
5.
Haas
R,
Sterns
J,
Meixner
O,
Nyob
D,
Traar
V.
Do
US
consumers
perceive
local
and
organic
food
differently?
An
analysis
based
on
means-‐end
chain
analysis
and
word
associaCon.
Int.
J.
Food
System
Dynamics.
2013;
4(3):
214-‐226.
hrp://ageconsearch.umn.edu/bitstream/164800/2/3%20Haas-‐ok.pdf
References