Roc curve, analytics
•
0 likes•1,505 views

Data Analytics and ROC curve

Recommended
Recommended
More Related Content
What's hot
What's hot (7)
Viewers also liked
Viewers also liked (8)
Similar to Roc curve, analytics
Similar to Roc curve, analytics (20)
More from Sandeep Sharma IIMK Smart City,IoT,Bigdata,Cloud,BI,DW
More from Sandeep Sharma IIMK Smart City,IoT,Bigdata,Cloud,BI,DW (20)
Recently uploaded
Recently uploaded (20)
Roc curve, analytics
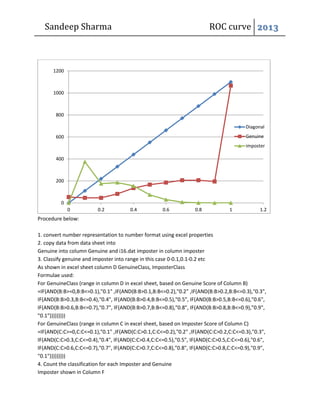
- 1. Sandeep Sharma ROC curve 2013 Procedure below: 1. convert number representation to number format using excel properties 2. copy data from data sheet into Genuine into column Genuine and i16.dat imposter in column imposter 3. Classify genuine and imposter into range in this case 0-0.1,0.1-0.2 etc As shown in excel sheet column D GenuineClass, ImposterClass Formulae used: For GenuineClass (range in column D in excel sheet, based on Genuine Score of Column B) =IF(AND(B:B>=0,B:B<=0.1),"0.1" ,IF(AND(B:B>0.1,B:B<=0.2),"0.2" ,IF(AND(B:B>0.2,B:B<=0.3),"0.3", IF(AND(B:B>0.3,B:B<=0.4),"0.4", IF(AND(B:B>0.4,B:B<=0.5),"0.5", IF(AND(B:B>0.5,B:B<=0.6),"0.6", IF(AND(B:B>0.6,B:B<=0.7),"0.7", IF(AND(B:B>0.7,B:B<=0.8),"0.8", IF(AND(B:B>0.8,B:B<=0.9),"0.9", "0.1"))))))))) For GenuineClass (range in column C in excel sheet, based on Imposter Score of Column C) =IF(AND(C:C>=0,C:C<=0.1),"0.1" ,IF(AND(C:C>0.1,C:C<=0.2),"0.2" ,IF(AND(C:C>0.2,C:C<=0.3),"0.3", IF(AND(C:C>0.3,C:C<=0.4),"0.4", IF(AND(C:C>0.4,C:C<=0.5),"0.5", IF(AND(C:C>0.5,C:C<=0.6),"0.6", IF(AND(C:C>0.6,C:C<=0.7),"0.7", IF(AND(C:C>0.7,C:C<=0.8),"0.8", IF(AND(C:C>0.8,C:C<=0.9),"0.9", "0.1"))))))))) 4. Count the classification for each Imposter and Genuine Imposter shown in Column F 0 200 400 600 800 1000 1200 0 0.2 0.4 0.6 0.8 1 1.2 Diagonal Genuine imposter
- 2. Sandeep Sharma ROC curve 2013 For 0.0 =COUNTIF(E:E,"0.0") , For 0.1 =COUNTIF(E:E,"0.1")…… Genuine: For 0.1 =COUNTIF(D:D,"0.1"), for 0.2 =COUNTIF(D:D,"0.2") , and so on.. Draw Scatter curve : Series Diagonal, plot values (Scale X,ScaleY) as below scaleX scaleY 0 0 0.1 110 0.2 220 0.3 330 0.4 440 0.5 550 0.6 660 0.7 770 0.8 880 0.9 990 1 1100 Similary draw values of imposter and Genuine as counted : So Add 2 more series by name Imposter, Genuine X - Axis Y-axis imposter scaleX scaleY genuine 0 0 0 0 374 0.1 110 53 175 0.2 220 46 185 0.3 330 65 155 0.4 440 82 73 0.5 550 135 30 0.6 660 166 7 0.7 770 185 1 0.8 880 206 0 0.9 990 195 0 1 1100 1067 Sum:1000 5.5 6050 2200 We get following curve:
- 3. Sandeep Sharma ROC curve 2013 Question 2: FP Rate = count(interval FP)/Total FP TP Rate= count(interval TP count)/Total TP We get this table Using this score we calculate accumulated FP, TP rate scaleX scaleY FPRate TPRate imposter genuine Acc FP Acc TP 0 0 0 0 0 0 0 0 0.1 0.1 0.374 0.02409 374 53 0.374 0.024091 0.2 0.2 0.175 0.02091 175 46 0.549 0.045 0.3 0.3 0.185 0.02955 185 65 0.734 0.074545 0.4 0.4 0.155 0.03727 155 82 0.889 0.111818 0.5 0.5 0.073 0.06136 73 135 0.962 0.173182 0.6 0.6 0.03 0.07545 30 166 0.992 0.248636 0.7 0.7 0.007 0.08409 7 185 0.999 0.332727 0.8 0.8 0.001 0.09364 1 206 1 0.426364 0.9 0.9 0 0.08864 0 195 1 0.515 1 1 0 0.485 0 1067 1 1 1000 2200 1 1 We get curve: 0 200 400 600 800 1000 1200 0 0.2 0.4 0.6 0.8 1 1.2 Diagonal Genuine imposter
- 4. Sandeep Sharma ROC curve 2013 ROC Curve Question 2 Acc FP Acc TP 0 0 0.374 0.024091 0.549 0.045 0.734 0.074545 0.889 0.111818 0.962 0.173182 0.992 0.248636 0.999 0.332727 1 0.426364 1 0.515 1 1 1 1 0 0.2 0.4 0.6 0.8 1 1.2 0 0.2 0.4 0.6 0.8 1 1.2 Diagonal FP Rate TP Rate
- 5. Sandeep Sharma ROC curve 2013 3. Determine the EER EER = nm/PN The point where the FMR curve and FNMR curve intersect is known as the equal errorrate (EER). It is called this because at this threshold, the FMR and FNMR are equal.With respect to the score distributions, the EER occurs at the threshold where thearea under (i.e. the integration of) the genuine distribution<t equals the area under theimpostor distribution≥t. Point (0.1,0.9) y scaleX scaleY FP Rate TP Rate 1 0 0 0 0 0 0.2 0.4 0.6 0.8 1 1.2 0 0.2 0.4 0.6 0.8 1 1.2 Acc TP diagonal 0 0.2 0.4 0.6 0.8 1 1.2 0 0.2 0.4 0.6 0.8 1 1.2 ROC curve diagonal rev
- 6. Sandeep Sharma ROC curve 2013 0.9 0.1 0.1 0.374 0.0240909 0.8 0.2 0.2 0.549 0.045 0.7 0.3 0.3 0.734 0.0745455 0.6 0.4 0.4 0.889 0.1118182 0.5 0.5 0.5 0.962 0.1731818 0.4 0.6 0.6 0.992 0.2486364 0.3 0.7 0.7 0.999 0.3327273 0.2 0.8 0.8 1 0.4263636 0.1 0.9 0.9 1 0.515 0 1 1 1 1 4. If the cost of a false accept is 10 euro and a false reject is 30 euro, estimate a suitable operating point on the ROC curve that minimises the overall cost. Assume equal apriori probabilities. scaleX scaleY FPRate TPRate imposter genuine Acc FP Acc TP 0 0 0 0 0 0 0 0 0.1 0.1 0.374 0.02409 374 53 0.374 0.024091 0.2 0.2 0.175 0.02091 175 46 0.549 0.045 0.3 0.3 0.185 0.02955 185 65 0.734 0.074545 0.4 0.4 0.155 0.03727 155 82 0.889 0.111818 0.5 0.5 0.073 0.06136 73 135 0.962 0.173182 0.6 0.6 0.03 0.07545 30 166 0.992 0.248636 0.7 0.7 0.007 0.08409 7 185 0.999 0.332727 0.8 0.8 0.001 0.09364 1 206 1 0.426364 0.9 0.9 0 0.08864 0 195 1 0.515 1 1 0 0.485 0 1067 1 1 1000 2200 1 1
- 7. Sandeep Sharma ROC curve 2013 = Consider a scenario in which negatives outnumber positives by 10 to 1, but false positives and false negatives have equal cost. By Eq. (1) m = 10, and the most northwest line of slope m = 10 is a, tangent to classifier A, which would be the best performing classifier for these conditions. Consider another scenario in which the positive and negative example populations are evenly balanced but a false negative is 10 times as expensive as a false positive. By Eq. (1) m = 1/10. The most northwest line of slope 1/ 10 would be line b, tangent to classifier C. C is the optimal classifier for these conditions. 0 0.2 0.4 0.6 0.8 1 1.2 0 0.2 0.4 0.6 0.8 1 1.2 FRR FAR