
Recommandé
Contenu connexe
Tendances
Tendances (15)
Similaire à Hul balance sheet
Similaire à Hul balance sheet (20)
Plus de Santosh Sridharan
Hul balance sheet
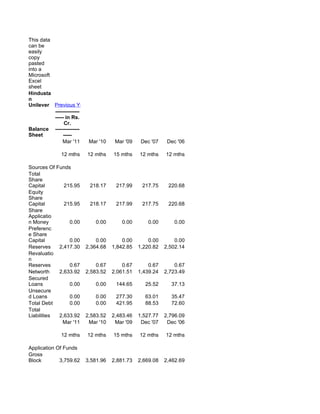
- 1. This data can be easily copy pasted into a Microsoft Excel sheet Hindusta n Unilever Previous Years » -------------- ----- in Rs. Cr. Balance -------------- Sheet ----- Mar '11 Mar '10 Mar '09 Dec '07 Dec '06 12 mths 12 mths 15 mths 12 mths 12 mths Sources Of Funds Total Share Capital 215.95 218.17 217.99 217.75 220.68 Equity Share Capital 215.95 218.17 217.99 217.75 220.68 Share Applicatio n Money 0.00 0.00 0.00 0.00 0.00 Preferenc e Share Capital 0.00 0.00 0.00 0.00 0.00 Reserves 2,417.30 2,364.68 1,842.85 1,220.82 2,502.14 Revaluatio n Reserves 0.67 0.67 0.67 0.67 0.67 Networth 2,633.92 2,583.52 2,061.51 1,439.24 2,723.49 Secured Loans 0.00 0.00 144.65 25.52 37.13 Unsecure d Loans 0.00 0.00 277.30 63.01 35.47 Total Debt 0.00 0.00 421.95 88.53 72.60 Total Liabilities 2,633.92 2,583.52 2,483.46 1,527.77 2,796.09 Mar '11 Mar '10 Mar '09 Dec '07 Dec '06 12 mths 12 mths 15 mths 12 mths 12 mths Application Of Funds Gross Block 3,759.62 3,581.96 2,881.73 2,669.08 2,462.69
- 2. Less: Accum. Depreciati on 1,590.46 1,419.85 1,274.95 1,146.57 1,061.94 Net Block 2,169.16 2,162.11 1,606.78 1,522.51 1,400.75 Capital Work in Progress 299.08 273.96 472.07 185.64 110.26 Investmen ts 1,260.68 1,264.08 332.62 1,440.81 2,522.22 Inventorie s 2,811.26 2,179.93 2,528.86 1,953.60 1,547.71 Sundry Debtors 943.20 678.44 536.89 443.37 440.37 Cash and Bank Balance 281.91 231.37 190.59 200.11 170.80 Total Current Assets 4,036.37 3,089.74 3,256.34 2,597.08 2,158.88 Loans and Advances 1,099.72 1,068.31 1,196.95 1,083.28 1,150.06 Fixed Deposits 1,358.10 1,660.84 1,586.76 0.75 246.15 Total CA, Loans & Advances 6,494.19 5,818.89 6,040.05 3,681.11 3,555.09 Deffered Credit 0.00 0.00 0.00 0.00 0.00 Current Liabilities 6,264.21 5,493.97 4,440.08 4,028.41 3,362.52 Provisions 1,324.98 1,441.55 1,527.98 1,273.90 1,429.71 Total CL & Provisions 7,589.19 6,935.52 5,968.06 5,302.31 4,792.23 Net Current Assets -1,095.00 -1,116.63 71.99 -1,621.20 -1,237.14 Miscellane ous Expenses 0.00 0.00 0.00 0.00 0.00 Total Assets 2,633.92 2,583.52 2,483.46 1,527.76 2,796.09 Contingen t Liabilities 663.00 468.49 417.26 494.46 476.40 Book Value (Rs) 12.19 11.84 9.45 6.61 12.34
- 3. Source : Dion Global Solutions Limited This data can be easily copy pasted into a Microsoft Excel sheet « Next Hindusta Years n Previous Unilever Years » -------------- ----- in Rs. Cr. Balance -------------- Sheet ----- Dec '05 Dec '04 Dec '03 Dec '02 Dec '01 12 mths 12 mths 12 mths 12 mths 12 mths Sources Of Funds Total Share Capital 220.12 220.12 220.12 220.12 220.12 Equity Share Capital 220.12 220.12 220.12 220.12 220.12 Share Applicatio n Money 0.00 0.00 0.00 0.00 0.00 Preferenc e Share Capital 0.00 0.00 0.00 0.00 0.00 Reserves 2,084.84 1,871.92 1,917.94 3,438.09 2,822.90 Revaluatio n Reserves 0.67 0.67 0.67 0.67 0.67 Networth 2,305.63 2,092.71 2,138.73 3,658.88 3,043.69 Secured Loans 24.50 1,453.06 1,603.70 19.62 43.04 Unsecure d Loans 32.44 18.06 100.61 38.68 40.69 Total Debt 56.94 1,471.12 1,704.31 58.30 83.73 Total Liabilities 2,362.57 3,563.83 3,843.04 3,717.18 3,127.42 Dec '05 Dec '04 Dec '03 Dec '02 Dec '01
- 4. 12 mths 12 mths 12 mths 12 mths 12 mths Application Of Funds Gross Block 2,375.11 2,314.22 2,141.72 1,994.36 1,935.88 Less: Accum. Depreciati on 989.61 891.08 846.09 778.90 726.34 Net Block 1,385.50 1,423.14 1,295.63 1,215.46 1,209.54 Capital Work in Progress 98.03 94.42 73.84 106.87 110.53 Investmen ts 2,148.72 2,229.56 2,574.93 2,364.74 1,635.93 Inventorie s 1,321.77 1,470.44 1,392.63 1,278.74 1,240.04 Sundry Debtors 522.83 489.27 470.85 367.85 424.78 Cash and Bank Balance 103.77 102.98 195.95 253.10 223.71 Total Current Assets 1,948.37 2,062.69 2,059.43 1,899.69 1,888.53 Loans and Advances 902.04 1,013.04 1,208.92 1,229.16 1,198.41 Fixed Deposits 251.26 595.07 610.53 689.52 689.45 Total CA, Loans & Advances 3,101.67 3,670.80 3,878.88 3,818.37 3,776.39 Deffered Credit 0.00 0.00 0.00 0.00 0.00 Current Liabilities 3,077.97 2,730.64 2,669.14 2,582.73 2,513.55 Provisions 1,293.39 1,123.46 1,311.11 1,205.55 1,091.40 Total CL & Provisions 4,371.36 3,854.10 3,980.25 3,788.28 3,604.95 Net Current Assets -1,269.69 -183.30 -101.37 30.09 171.44 Miscellane ous Expenses 0.00 0.00 0.00 0.00 0.00 Total Assets 2,362.56 3,563.82 3,843.03 3,717.16 3,127.44 Contingen t Liabilities 468.33 476.41 478.34 483.20 425.00
- 5. Book Value (Rs) 10.47 9.50 9.71 16.62 13.82 Source : Dion Global Solutions Limited