Saral Gyan - 15% @ 90 Days - Oct 2016
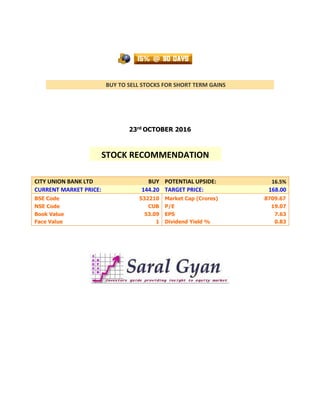
- 1. BUY TO SELL STOCKS FOR SHORT TERM GAINS 23rd OCTOBER 2016 CITY UNION BANK LTD BUY POTENTIAL UPSIDE: 16.5% CURRENT MARKET PRICE: 144.20 TARGET PRICE: 168.00 BSE Code 532210 Market Cap (Crores) 8709.67 NSE Code CUB P/E 19.07 Book Value 53.09 EPS 7.63 Face Value 1 Dividend Yield % 0.83 STOCK RECOMMENDATION
- 2. 15% @ 90 DAYS – OCTOBER 2016 - 2 - SARAL GYAN CAPITAL SERVICES Comparative Chart (Last 1 Year) Returns: City Union Bank & Nifty: Nifty: 4.8% City Union Bank: 62.2% Stock Resistance and Support: 1st Resistance – 150 1st Support – 135 2nd Resistance – 162 2nd Support – 127
- 3. 15% @ 90 DAYS – OCTOBER 2016 - 3 - SARAL GYAN CAPITAL SERVICES Financials at a Glance: Quarterly Results of City Union Bank (Rs. In Crores) Particulars Jun 2016 Mar 2016 Dec 2015 Sep 2015 Audited / UnAudited UnAudited UnAudited UnAudited UnAudited Int. / Disc. On Adv / Bills 633.9 613.8 598.22 582.95 Income on Investment 129.65 133.6 140.46 143.26 Int. on balances With RBI 4.53 4.05 2.75 2.59 Others 4.12 4.81 5.54 6.12 Other Income 111.11 107.26 103.31 94.52 Total Interest Earned / Income 883.31 863.52 850.28 829.44 Interest Expended 492.18 491.81 494.12 494.83 Employees Cost 63.11 52.73 63.25 48.93 Other Expenses 92.24 94.93 86.03 80.49 Depreciation -- -- -- -- Op. Profit before Provisions & Cont 235.78 224.04 206.89 205.2 Provisions And Contingencies 70.75 70.81 64.83 49.85 Exceptional Items -- -- -- -- P/L Before Tax 165.03 153.23 142.06 155.35 Tax 41.5 41 29 47.5 P/L After Tax from Ord. Activities 123.53 112.23 113.06 107.85 Prior Year Adjustments -- -- -- -- Extra Ordinary Items -- -- -- -- Net Profit/ (Loss) 123.53 112.23 113.06 107.85 Equity Share Capital 59.82 59.82 59.82 59.82 Reserves excl Revaluatn Reserves -- -- 2,635.87 -- Basic EPS 2.07 1.88 1.89 1.81 Diluted EPS 2.01 1.83 1.79 1.71 No Of Shares (Crores) -- -- -- 59.82 Share Holding (%) -- -- -- 100
- 4. 15% @ 90 DAYS – OCTOBER 2016 - 4 - SARAL GYAN CAPITAL SERVICES Basis of Recommendation: i) Technical Analysis Disclaimer: Important Notice: Saral Gyan Capital Services is an Independent Equity Research Company. © SARAL GYAN CAPITAL SERVICES This Service is provided on an "As Is" basis by Saral Gyan Capital Services. Saral Gyan Capital Services and its affiliates disclaim any warranty of any kind, imputed by the laws of any jurisdiction, whether express or implied, as to any matter whatsoever relating to the Service, including without limitation the implied warranties of merchantability, fitness for a particular purpose. Neither Saral Gyan Capital Services nor its affiliates will be responsible for any loss or liability incurred to the user as a consequence of his or any other person on his behalf taking any investment decisions based on the above recommendation. Use of the Service is at any persons, including a Customer's, own risk. The investments discussed or recommended through this service may not be suitable for all investors. Investors must make their own investment decisions based on their specific investment objectives and financial position and using such independent advisors as they believe necessary. Information herein is believed to be reliable but Saral Gyan Capital Services and its affiliates do not warrant its completeness or accuracy. The service should not be construed to be an advertisement for solicitation for buying or selling of any securities.