Contenu connexe
Similaire à Objective_Assessment_of_Strength_Training.26-1
Similaire à Objective_Assessment_of_Strength_Training.26-1 (20)
Objective_Assessment_of_Strength_Training.26-1
- 1. Objective Assessment of Strength Training
Exercises using a Wrist-Worn Accelerometer
SCOTT A. CONGER1
, JUN GUO2
, SCOTT M. FULKERSON1
, LAUREN PEDIGO1
, HAO CHEN2
,
and DAVID R. BASSETT, JR.3
1
Department of Kinesiology, Boise State University, Boise, ID; 2
Department of Electrical and Computer Engineering, Boise
State University, Boise, ID; 3
Department of Kinesiology, Recreation, and Sport Studies, University of Tennessee, Knoxville, TN
ABSTRACT
CONGER, S. A., J. GUO, S. M. FULKERSON, L. PEDIGO, H. CHEN, and D. R. BASSETT, Jr. Objective Assessment of Strength
Training Exercises using a Wrist-Worn Accelerometer. Med. Sci. Sports Exerc., Vol. 48, No. 9, pp. 1847–1855, 2016. The 2008 Physical
Activity Guidelines for Americans recommend that all adults perform muscle-strengthening exercises to work all of the major muscle
groups of the body on at least 2 dIwkj1
, in addition to aerobic activity. Studies using objective methods of monitoring physical activity
have focused primarily on the assessment of aerobic activity. To date, a method for assessing resistance training (RT) exercises has not
been developed using a wrist-worn activity monitor. Purpose: The purpose of this study was to examine the use of a wrist-worn triaxial
accelerometer-based activity monitor for classifying upper- and lower-body dumbbell RT exercises. Methods: Sixty participants
performed 10 repetitions each of 12 different upper- and lower-body dynamic dumbbell exercises. Algorithms for classifying the
exercises were developed using two different methods: support vector machine and cosine similarity. Confusion matrices were developed
for each method, and intermethod reliabilities were assessed using Cohen_s kappa. A repeated-measures ANOVA was used to compare
the predicted repetitions, identified from the largest acceleration peaks, with the actual repetitions. Results: The results indicated that
support vector machine and cosine similarity accurately classified the 12 different RT exercises 78% and 85% of the time, respectively.
Both methods struggled to correctly differentiate bench press versus shoulder press and squat versus walking lunges. Repetition estimates
were not significantly different for 8 of the 12 exercises. For the four exercises that were significantly different, the differences amount to
less than 10%. Conclusion: This study demonstrated that RT exercises can be accurately classified using a single activity monitor worn
on the wrist. Key Words: ACTIVITY MONITOR, WEIGHT LIFTING, MEASUREMENT, CLASSIFICATION
R
esistance training (RT) has important health and fit-
ness benefits, including increased muscular strength
and endurance, increased bone density, improvements
in insulin sensitivity, blood pressure reduction in those with
stage 1 hypertension, and improvements in cardiometabolic
biomarkers (7,17,20). The 2008 Physical Activity Guidelines
for Americans (17) recommend that all United States adults
perform RT exercises on at least 2 dIwkj1
, in addition to
performing 150 minIwkj1
of moderate- to vigorous-intensity
aerobic exercise. Although physical activity monitors such as
pedometers, accelerometers, and heart rate monitors have
been shown to be valid for tracking aerobic activity (18),
there is still a need for objective monitoring methods to track
RT exercises.
Important components of RT exercises include the type
of exercise that is completed, the intensity (i.e., the amount
of weight lifted or force generated), and the number of
repetitions (17). There are weight machines that allow a
client in a fitness center to enter a personalized pin number
or swipe a card, place a pin in a weight stack, and track the
amount of weight lifted and number of repetitions electron-
ically. For instance, FitLinxx (Westborough, MA) manu-
factures RT machines for health clubs that allow clients to
track their workouts. However, the cost of this technology is
high, and not all individuals can afford the expense of a
fitness center membership. An alternative approach that is
feasible for many adults is to complete RT exercises at home
using dumbbells. The ability to objectively measure com-
pliance to a prescribed dumbbell RT exercise program at
home does not currently exist. The objective measurement
of intensity during RT exercises is particularly difficult.
However, if the resistance lifted is known, accelerometer-
based physical activity monitors may be useful in measuring
other components of RT exercises. Assessing compliance
during RT exercises using objective monitors is a twofold
process: 1) the identification of the activity category of RT
exercises 2) and the classification of the individual RT exer-
cises. Although objective methods to identify and classify
aerobic exercise have been established, an objective method
to identify and classify home-based dumbbell RT exercises
is needed. Before attempting to address if the category of
RT exercise can be identified, it would be useful to determine
whether individual RT exercises can be classified using a
single accelerometer-based physical activity monitor.
Address for Correspondence: Scott A. Conger, Ph.D., Department of Ki-
nesiology, Boise State University, 1910 University Drive, Boise, ID 83725-
1710; E-mail: scottconger@boisestate.edu.
Submitted for publication November 2015.
Accepted for publication March 2016.
0195-9131/16/4809-1847/0
MEDICINE & SCIENCE IN SPORTS & EXERCISEÒ
Copyright Ó 2016 by the American College of Sports Medicine
DOI: 10.1249/MSS.0000000000000949
1847
APPLIEDSCIENCES
Copyright © 2016 by the American College of Sports Medicine. Unauthorized reproduction of this article is prohibited.
- 2. Previous research has attempted to classify various types
of physical activity based on accelerometer data from ac-
tivity monitors. These studies have focused on classifying
physical activity into intensity categories or activity types by
using pattern recognition techniques (12,16,22). There are a
very limited number of studies that have investigated the
classification of either the general category of RT or the type
RT exercises based on accelerometer data worn on the hand
or wrist. Dong et al. (5) included two RT exercises in their
study on activity classification. However, these exercises
were classified as a broad category of ‘‘exercise-related ac-
tivities,’’ and the ability of the models used to classify the
individual RT exercises was not presented (5). Margarito et al.
(12) attempted to classify squatting exercises and the broad
class of ‘‘weight lifting’’ using a wrist-worn triaxial accel-
erometer with mixed results. Chang et al. (3) used an ac-
celerometer attached to a glove along with a waist-worn
accelerometer to classify individual RT exercises. Their re-
sults were promising for the classification of the type of RT
exercises (3); however, the addition of data from the waist-
worn activity monitor in the prediction algorithm and the
location of the accelerometer on the glove limit the feasi-
bility of this method. On the basis of the retrospective visual
inspection of the graphical representation of the acceleration
patterns from a triaxial accelerometer placed on the wrist
during various dumbbell RT exercises, it appears that they
could be identified using the unique characteristics of each
movement. Therefore, the purposes of this study were to
develop a prediction method to classify individual dumb-
bell RT exercises and to develop a method for counting
repetitions using a wrist-worn activity monitor. Secondary
purposes included a) the comparison of two different pre-
diction methods used for classification and b) the assessment
of the repetition counting method.
METHODS
Participants
Healthy men and women between the ages of 18 and
55 yr were recruited for this study. Each participant was
informed of the potential risks and benefits and signed an
informed consent document that was approved by the
university_s institutional review board. Before beginning
the study, each participant completed a health history ques-
tionnaire and a questionnaire on their RT history. Participants
were excluded if they had any physical disability that would
limit their ability to complete upper- or lower-body RT
exercises, a known history of chronic disease, or a recent
musculoskeletal injury. Body weight was measured, and body
composition was estimated using bioelectrical impedance
analysis (InBody 720; Biospace Co., Seoul, Korea) (6).
Procedures
Each participant wore an ActiGraph GT3X+ (Pensacola,
FL) activity monitor on the nondominant wrist. The ActiGraph
GT3X+ is a small (4.6 Â 3.3 Â 1.5 cm, 19 g) triaxial
accelerometer-based physical activity monitor that is capable
of recording accelerations with a range of T 6g. It should
be noted that ActiGraph now uses accelerometers that are
capable of detecting accelerations with a higher range of
gravitational forces. However, pilot testing indicated that
dumbbell RT exercises typically are G2g. Thus, the use of an
activity monitor with a lower range would likely not affect
the results. Before the arrival of the participant, the monitor
was initialized to collect at 80 Hz. After the monitor was
affixed to the participant_s wrist, each participant was asked
to complete one set of 10 repetitions each of 12 different
RT exercises. The participants were instructed on the proper
form and range of motion to be completed during the exer-
cises by a trained study investigator. The RT exercises were
completed in the following order: bench press, shoulder press,
bicep curls, upright rows, lateral raises, overhead triceps ex-
tensions, kneeling triceps kickbacks, standing bent-over rows,
kneeling bent-over rows, squats, forward walking lunges, and
calf raises. The exercises were completed using a pair of
cast-iron dumbbells of a self-selected weight between 2.3
and 6.8 kg, and participants were given 1 to 3 min of rest
between each exercise. The lower-body exercises were com-
pleted with the dumbbells in a low carry position with a neu-
tral grip. Each repetition was completed at a self-selected
rate, with most participants choosing a rate of one complete
repetition every 2 to 4 s. Immediately before and after each
exercise set, participants were asked to pause in the starting
position for 5 s to allow for the easier identification of the
beginning and end point of each set during data reduction.
Data Reduction and Modeling
After the completion of the exercise trial, data were down-
loaded, and the raw acceleration data from the three axes were
stored as a .csv file. An investigator then labeled the beginning
and the end point of each exercise in the .csv file. The begin-
ning and the end point of each exercise were verified by vi-
sually inspecting a graph of each exercise.
Two different methods were used to classify the 12 ex-
ercises: support vector machine (SVM) (4) and cosine sim-
ilarity (13). The two methods each have their own merits:
SVM is the optimal classifier (if the data can be classified),
whereas cosine similarity is very simple by using the cor-
relations between the data. These two methods were each
applied to the data, and a comparison of the two algorithms
was completed.
SVM. SVM is one of the most widely used supervised
learning algorithms (8). It is known as the maximum margin
classifier: if the data are separable, SVM should find the
largest separation between different classes. Because SVM
is a supervised learning algorithm, the data needed to be
separated into training and testing sets. Because of a limited
number of complete data sets (n = 57) and 12 different
classes, the leave-one-out cross-validation method was used
to maximize the efficiency of the available data (9).
http://www.acsm-msse.org1848 Official Journal of the American College of Sports Medicine
APPLIEDSCIENCES
Copyright © 2016 by the American College of Sports Medicine. Unauthorized reproduction of this article is prohibited.
- 3. Data were organized into training and testing data. Be-
cause the raw ActiGraph data were used for analysis, a filter
was needed to reduce the signal noise. A low-pass filter was
applied to reduce the interference of noise using a convo-
lution window in time domain (14). The Hanning window
function (equation 1) was chosen to convolve with the raw
data, where 0 e n e N, in which N represents the length of
the data (i.e., window size). To reduce high-frequency noise,
a window size of 51 was determined heuristically. Equation 2
was the convolution function, where f(n) is the low-pass
filtered data, and g(n) is the raw data where its length was
M, jM e m e M. Therefore, the low-pass filtered data were
computed using equation 3. Although the length of the fil-
tered data should be N + M j 1, the data were truncated to
the same length of the raw data M. The key features of the
exercises (i.e., classes) were extracted using the method of
moments (2). Then SVM classified the feature data into
different classes. In the next loop, different sets of training
and testing were chosen, and the same procedures were ap-
plied. This process was repeated until all the data sets were
cross validated. Equations 1–3 are presented as follows:
w nð Þ ¼ 0:5 1 j cos
2Pn
N j 1
; ½1Š
f nð Þ ¼ w nð Þg nð Þ ¼ ~
M
m¼jM
w n j m½ Šg m½ Š; ½2Š
f nð Þ ¼ w nð Þg nð Þ ¼ ~
M
m¼jM
0:5 1 j cos
2P n j mð Þ
N j 1
g m½ Š: ½3Š
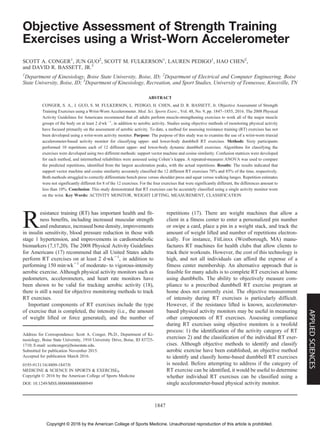
Pre- and postfiltered data can be seen in Figures 1 and 2.
A method of moments was used to determine the popu-
lation parameters of each exercise. For feature extraction,
the normalized method of moments was selected as features
of the training and testing data. The four normalized mo-
ments (i.e., features) that were used were mean (equation 4),
normalized variance (equation 5), normalized skewness
(equation 6), and normalized kurtosis (Equation 7), calcu-
lated as follows:
K1 ¼
1
n
~n
i¼1xi; ½4Š
K2 ¼
ffiffiffiffiffiffiffiffiffiffiffiffiffiffiffiffiffiffiffiffiffiffiffiffiffiffiffiffiffiffiffiffiffiffi
1
n
~n
i¼1 xi j K1ð Þ2
;
r
½5Š
K3 ¼
ffiffiffiffiffiffiffiffiffiffiffiffiffiffiffiffiffiffiffiffiffiffiffiffiffiffiffiffiffiffiffiffiffiffi
1
n
~n
i¼1 xi j K1ð Þ3
;
3
r
½6Š
K4 ¼
ffiffiffiffiffiffiffiffiffiffiffiffiffiffiffiffiffiffiffiffiffiffiffiffiffiffiffiffiffiffiffiffiffiffi
1
n
~n
i¼1 xi j K1ð Þ4
:
4
r
½7Š
For each equation, xi represents an individual data point
and n represents the total number of data points. Because
each data set contains three axes along with the four mo-
ments, a 3 Â 4 matrix was used for each exercise. These
moments were selected based on the unique features of the
FIGURE 1—Representative triaxial acceleration plots for bench press (A), shoulder press (B), bicep curls (C), upright rows (D), lateral raises (E), and
overhead triceps extensions (F). Plots are presented with raw and filtered accelerometer data. Stars indicate a predicted repetition.
OBJECTIVE ASSESSMENT OF STRENGTH TRAINING Medicine Science in Sports Exercised 1849
APPLIEDSCIENCES
Copyright © 2016 by the American College of Sports Medicine. Unauthorized reproduction of this article is prohibited.
- 4. data. The normalization was applied to reduce the effect of
different velocities of movement by the participants. Once
the features were extracted, they were fed into a multiclass
SVM with a radial-basis function kernel (8).
Cosine similarity. By plotting and observing the col-
lected data, one can see that there are unique characteristics
of each of the three accelerometer axis for each exercise
(Figs. 1 and 2). Therefore, we decided to test a simpler super-
vised learning algorithm called cosine similarity. Cosine simi-
larity measures the similarity between two vectors of an inner
product space (15). Unlike SVM with a leave-one-out cross
validation, cosine similarity only needs one or two training data
sets; therefore, the classification is finished in one round.
We choose the training data heuristically by observing the
plot of the collected data sets for the data from the first two
study participants with the criterion that the periodic infor-
mation (i.e., upper/lower limits of the acceleration curve and
data between the upper limit peaks, i.e., periods) are clear.
These two data sets were then used as the ‘‘model’’ to de-
velop the algorithm. Feature extractions using the afore-
mentioned algorithms were used. The cosine similarity was
used to compute the similarity score (cos(S) Z [j1,1]) of
the features using equation 8, where X and Y are the feature
vectors of one class in the training data and the testing data,
respectively, whereas kXk2 and kYk2 denote the L2 norm
(15) of the features_ vectors for one class in the training and
the testing, respectively:
cosðSÞ ¼
X I Y
¬X¬2 I ¬Y¬2
: ½8Š
For each class in the training data, 12 cosine similarities
were computed for the corresponding 12 classes (i.e., exer-
cises) in the testing data. The corresponding X and Y of
the highest correlations among the 12 were considered as the
most likely similar pair. Therefore, Y was classified as the
label of X.
Repetition counting. In addition to exercise classifi-
cation, a prediction algorithm was also developed to count
the repetitions completed during each exercise. After a low-
pass filter was applied to the data, a digital signal processing
technique called peak detection was used to count the rep-
etitions. Peak detection was used to identify and count the
largest acceleration peaks during each exercise set. The
accelerometer axes with the largest variance were identified
mathematically by comparing the minimum and the maxi-
mum values during each period for each axes. Each peak
was identified (as indicated by the stars in Figs. 1 and 2) and
summed for each exercise. The source codes used in this study
are available at https://github.com/matrivian/Resistance-
Exercise-Classification.
Statistical Analysis
Confusion matrices were created to compare the classifi-
cation accuracy between the prediction methods and the di-
rect observation for each prediction method (SVM and
cosine similarity). The intermethod reliability analysis using
Cohen_s kappa was performed independently for each pre-
diction method to determine consistency. Reference points
for Cohen_s kappa developed by Landis and Koch (11) were
FIGURE 2—Representative triaxial acceleration plots for kneeling triceps kickbacks (A), standing bent-over rows (B), kneeling bent-over rows (C), squats
(D), forward walking lunges (E), and calf raises (F). Plots are presented with raw and filtered accelerometer data. Stars indicate a predicted repetition.
http://www.acsm-msse.org1850 Official Journal of the American College of Sports Medicine
APPLIEDSCIENCES
Copyright © 2016 by the American College of Sports Medicine. Unauthorized reproduction of this article is prohibited.
- 5. used for interpretation with 0.41–0.60, 0.61–0.80, and 0.81–
1.00 corresponding with ‘‘moderate,’’ ‘‘substantial,’’ and
‘‘almost perfect’’ agreement. A comparison of the methods
was completed using the z-score. A 2 Â 12 repeated-
measures ANOVA was used to compare the actual repeti-
tions completed during direct observation with the predicted
repetitions. When appropriate, post hoc comparisons using a
Bonferroni adjustment were completed. All statistical anal-
ysis was performed using SPSS software (version 22; SPSS
Inc., Chicago, IL), with statistical significance set at an alpha
level of 0.05.
RESULTS
A total of 60 volunteers participated in the study (Table 1).
Three of the participants elected not to complete one or more of
the exercises because of limitations in their range of motion.
Thus, the analysis was conducted on the 57 complete data sets.
On average, the participants had 6.9 T 5.9 yr of RT experience
(range 0–25 yr). The participants were asked to complete each
exercise at a self-selected pace. On average, each exercise was
completed at an average rate of 2.34 T 0.54 s per repetition.
The SVM method demonstrated ‘‘substantial’’ agreement,
as described by Landis and Koch (11), in the correct clas-
sification of the 12 exercises, with correct classification oc-
curring 77.9% (533/684) of the time (Table 2). The kappa
statistic was 0.759, indicating a statistically significant level
of agreement between the predicted and the direct obser-
vations (P G 0.001). The correct classification for the in-
dividual exercises ranged from 46% to 98%, with 11 of 12
exercises being correctly classified at least 65% of the time.
Overall, the SVM prediction model accurately classified
upper-body exercises 76.8% of the time (394/513). The
highest classification accuracy of the upper-body exercises
was bicep curls, with misclassification occurring only once
(98% correct classification). The upper-body exercise that
had the lowest classification accuracy was shoulder press,
with correct classification occurring only 46% of the time.
Shoulder press was most often misclassified as bench press,
forward walking lunge, or kneeling bent-over rows. The SVM
model correctly classified 139 of 171 lower-body exercises
(81.3%). The highest classification accuracy occurred during
calf raises, with correct classification occurring in 98% of the
cases. The lowest classification accuracy occurred during
forward walking lunges (67%). Forward walking lunges were
most often misclassified as squats or calf raises.
TABLE 1. Participant demographics.
Men (n = 41) Women (n = 19) Total (N = 60)
Age (yr) 26.9 T 7.4 24.2 T 5.0 26.1 T 6.8
Height (m) 1.78 T 0.07 1.65 T 0.07 1.74 T 0.10
Weight (kg) 84.1 T 16.1 67.0 T 12.2 78.7 T 16.9
BMI (kg.
mj2
) 26.4 T 4.2 24.6 T 4.2 25.8 T 4.3
Body fat (%) 17.1 T 5.8 26.0 T 8.4 19.9 T 7.9
RT experience (yr) 7.6 T 6.1 5.3 T 5.3 6.9 T 5.9
Data are presented as mean T SD.
TABLE2.ConfusionmatrixusingSVMmethod.
Predicted(PredictionAlgorithmfromAccelerationData)
Bench
PressPress
Bicep
Curls
Upright
Rows
Lateral
Raises
Overhead
Triceps
Extensions
Kneeling
Triceps
Kickbacks
Standing
Bent-OverRows
Kneeling
Bent-OverRowsSquats
Forward
WalkingLungesCalfRaisesTotal
Correct
Classification(%)
Actual(directobservation)
Benchpress37530010040705765
Shoulderpress112610010353705746
Bicepcurls00560100000005798
Uprightrows02051120010005789
Lateralraises001014420000005777
Overheadtricepsextensions00431481000005784
Kneelingtricepskickbacks00500448000005784
Standingbent-overrows25110014510105779
Kneelingbent-overrows32240003391215768
Squats40100001045425779
Forwardwalkinglunges21100100453855767
Calfraises00000000010565798
Total59418460475950525455536468478
OBJECTIVE ASSESSMENT OF STRENGTH TRAINING Medicine Science in Sports Exercised 1851
APPLIEDSCIENCES
Copyright © 2016 by the American College of Sports Medicine. Unauthorized reproduction of this article is prohibited.
- 6. The cosine similarity method demonstrated ‘‘almost
perfect’’ (11) agreement between predicted and direct ob-
servation methods with the correct classification of exercise
occurring 84.7% (559/660) of the time (Table 3). The
kappa statistic of 0.833 was statistically different from zero
(P G 0.001). Eight of the 12 individual exercises were cor-
rectly classified at least 85% of the time. This model correctly
classified upper-body exercises 87.9% of the cases. The lat-
eral raises and overhead triceps extensions had the highest
correct classification (96%). Of the lower-body exercises,
correct classification occurred in 124 of 165 events (75.2%).
Calf raises had the highest correct classification at 98%,
whereas squats had the lowest (60%). Squats were most often
misclassified as either calf raises or forward walking lunges.
The SVM and the cosine similarity methods were com-
pared using z-score. The z-score (zSVM, cosine similarity = 0.41)
was less than the zcritical (1.96), indicating that there was no
statistical difference between SVM and cosine similarity for
classifying the 12 RT exercises (P 9 0.05).
Figure 3 presents the actual and predicted repetitions for
each exercise using peak detection. In the analysis of the
ability of the algorithm to count the repetitions, a repeated-
measures ANOVA indicated a significant main effect
(F(12, 43) = 16.37, P G 0.001). Post hoc analysis indicated
that upright rows, lateral raises, overhead triceps exten-
sions, and forward walking lunges were significantly dif-
ferent than the actual repetitions (P G 0.05). There were no
significant differences for repetition counting for any of the
other eight exercises.
DISCUSSION
The results of this study demonstrated that algorithms
using data from a wrist-worn ActiGraph GT3X+ triaxial
accelerometer-based activity monitor can accurately classify
various types of upper- and lower-body RT exercises. Both
FIGURE 3—Actual vs predicted repetitions during 12 different
dumbbell exercises. Values are presented as mean T SD. *Significantly
different than actual (P G 0.05).
TABLE3.Confusionmatrixusingcosinesimilaritymethod.
Predicted(PredictionAlgorithmfromAccelerationData)
Bench
Press
Shoulder
Press
Bicep
Curls
Upright
Rows
Lateral
Raises
Overhead
Triceps
extensions
Kneeling
Triceps
Kickbacks
Standing
Bent-OverRows
Kneeling
Bent-OverRowsSquats
Forward
WalkingLungesCalfRaisesTotal
Correct
Classification(%)
Actual(directobservation)
Benchpress401500000000005573
Shoulderpress144100000000005575
Bicepcurls00520021000005595
Uprightrows00047500030005585
Lateralraises00005300020005596
Overheadtricepsextensions00101530000005596
Kneelingtricepskickbacks00000052010205595
Standingbent-overrows00000034830105587
Kneelingbent-overrows00000002491215589
Squats000000000338145560
Forwardwalkinglunges000000001113765567
Calfraises00000000001545598
Total54565347595556505945517566085
Boldfaceindicatesexercisesthatwerecorrectlyclassified.
http://www.acsm-msse.org1852 Official Journal of the American College of Sports Medicine
APPLIEDSCIENCES
Copyright © 2016 by the American College of Sports Medicine. Unauthorized reproduction of this article is prohibited.
- 7. SVM and cosine similarity methods demonstrated the ability
to identify the 12 different RT exercises at least 78% of the
time. The precision using the cosine similarity method was
slightly higher (although not statistically different) than the
SVM method. The cosine similarity method is much sim-
pler, and its precision was highly dependent on the data that
were selected to serve as the ‘‘model’’ data. In this study, we
selected the data from the first two subjects to serve as the
model. The applicability of using this model on a larger
scale may be limited. Therefore, the more robust SVM
method would be a more appropriate choice to use for a
different sample of data.
As mentioned previously, SVM is only an optimal clas-
sifier when the data are distinguishable. However, in the
data presented in this study, two pairs of data were very
difficult to be separated: bench press/shoulder press and
squats/forward walking lunges. For bench press and shoul-
der press, the difficulty in classifying the exercises was not
surprising considering the fact that the plane of motion for
bench press and shoulder press are identical with the only
difference being the position of the body. With the location
of the monitor on the wrist, the misclassifications of the
lower-body exercises were also expected. For cosine simi-
larity, if one data set is chosen as the training set and the
remaining 56 data sets as the testing set, 79.5% precision
was achieved (data not shown), and if two data sets were
chosen as the training set and 55 were chosen as the testing
set, 84.7% precision was achieved (Table 3). The misclassified
pairs using this method were bench press/shoulder press and
squats/forward walking lunges, which was consistent with the
result obtained by SVM classifier. Future studies may be able
to improve on the classification of these exercises by adding
more data channels (such as gyroscope data) to allow for the
data sets to be classified based on more information or by using
more sophisticated machine learning methods.
Overall, the prediction algorithm for repetitions across all
exercises was, on average, within 2% of the actual repeti-
tions (Fig. 3). There were four exercises that yielded sta-
tistically different estimates: upright rows, lateral raises,
overhead triceps extensions, and forward walking lunges.
The percent error for these four exercises ranged from 3.3%
to 8.9%. When taken in context to the exercise protocol that
participants were asked to complete one set of 10 repeti-
tions per exercise, this amounted to an average error of less
than one repetition. The reason for the slight error in counting
repetitions during some exercises appeared to be related to the
one of two different factors. In some cases, some of the pe-
riods associated with a repetition were inconsistent across
repetitions or were difficult to discern because of excessive
‘‘noise’’ in the data. In other cases, the initial position of the
activity monitor in a position that was similar to the peak ac-
celeration identified by the prediction algorithm caused a
complete repetition to be counted at the beginning of the ex-
ercise before the complete range of motion had been com-
pleted leading to an additional repetition to be ‘‘counted.’’ The
speed of movement also appears to have played a role with
repetitions that were completed in less than 1.5 s commonly
miscounted. The methods that were used in the repetition
counting algorithm were relatively simplistic. Future methods
using more sophisticated machine learning techniques may be
able to reduce these types of errors.
Previously, Chang et al. (3) reported on the use of a
three-axis accelerometer built into a workout glove to track
hand movements during free-weight exercises, along with
an accelerometer on the waist to track body posture. They
examined two methods of classifying exercises: the naBve
Bayes classifier and the hidden Markov models. Their results
indicated greater than 90% accuracy for classifying activ-
ity type. These authors also used a method to count repeti-
tions using a peak counting algorithm and another method
involving a Hidden Markov model. Their results indicated
a miscounting rate of approximately 5%. Although the
present study did not report the accuracy of counting rep-
etitions, similar methods could presumably be applied in
future studies.
The notion of identifying a signature back-and-forth
movements of the hand, called ‘‘atoms’’ by Benbasat et al.
(1), is very applicable to structured strength training routines
using dumbbells. The present study demonstrated slightly
lower accuracy than those presented by Chang et al. (3).
However, Chang et al. (3) used a waist-mounted acceler-
ometer in addition to the accelerometer that was located in
the glove. The addition of a second accelerometer on the
waist was able to identify the body position of the user.
This added information would likely have improved on the
accuracy of our methods to differentiate between shoulder
press and chest press. However, an additional waist-mounted
accelerometer would be less feasible and more burdensome
for participants and would likely only provide marginal im-
provements on the accuracy for RT exercise determination
over the methods presented in the present article.
Emerging evidence indicates that new techniques, such
as machine learning, will lead to improvements in physical
activity monitoring. Zhang et al. (21) used a GENEA wrist
accelerometer and examined the classification accuracy of
machine learning algorithms to predict activity type. They
had 60 adults perform structured activities (e.g., lying,
standing, seated computer work, walking at 4 kph, walking
at 5 kph, walking at 6 kph, going up- and downstairs, window
washing, washing up, shelf stacking, sweeping, running at
8 kph, running at 10 kph, and running at 12 kph). Mathe-
matical features from fast Fourier transform and wavelet
decomposition were extracted, and machine learning algo-
rithms were used to classify four general types of daily activities
(sedentary, household, walking, and running activities). They
found that the wrist-borne GENEA had high classification ac-
curacy for determining the general type of activity (r =
0.96–0.97), which was comparable to the classification
accuracy found for a GENEA on the waist. However, these
authors did not test the ability of a wrist accelerometer to
detect specific types of arm activities, such as the RT ex-
ercises performed in the present study.
OBJECTIVE ASSESSMENT OF STRENGTH TRAINING Medicine Science in Sports Exercised 1853
APPLIEDSCIENCES
Copyright © 2016 by the American College of Sports Medicine. Unauthorized reproduction of this article is prohibited.
- 8. The StepWatch 3 (Orthocare Innovations, Oklahoma
City, OK) is an example of an ankle-borne device that has
been constructed to recognize a ‘‘signature movement’’ in
walking (i.e., a forward step) with a high degree of accuracy.
The StepWatch can detect steps in lean or obese, young or
old, fast walkers or slow walkers, with 98% accuracy. Ma-
chine learning algorithms could be developed to detect other
types of leg activities such as bicycling (where the ankle
moves in a circle) or ice skating, and this would improve the
specificity of the device. It is important to note that, in ad-
dition to counting steps, a foot or ankle-mounted acceler-
ometer can be used to obtain information about each step.
For example, Weyand et al. (19) showed that placing an
accelerometer on the shoe allows detection of the amount
of time that the foot is in contact with the ground. Because
foot contact time decreases as speed of locomotion increases,
this information can be used to compute speed and energy
expenditure. The Nike+ in-shoe device and shoe pods sold by
Fitsense, Adidas, Polar, and Garmin appear to use this prin-
ciple. The Nike+ was tested at walking speeds of 2, 3, and
4 mph and running speeds of 5, 6, and 7 mph (10) and found
to be extremely accurate for speed, although not quite as ac-
curate for energy expenditure. Thus, measuring the specific
characteristics of the acceleration waveform in signature
movements (e.g., a step or a dumbbell curl) may provide in-
formation on the intensity of the movement, which can lead
to improved accuracy for estimating energy expenditure.
The objective monitoring of weight lifting programs has
applications in the field of exercise science. For instance,
if the dumbbell weight is known, it would allow researchers
to document aspects related to RT programs, including com-
pliance with RT guidelines, the amount of work performed,
and the caloric expenditure of those exercises. It is even pos-
sible that the acceleration versus time graphs could be used to
provide biofeedback to users and prompt them on maintaining
proper form during lifting. This information may also be used
to count the number of repetitions during an RT exercise set.
Speed of movement and range of motion could also be mon-
itored by the device, and a video game–like avatar could
mimic the movements.
There are several strengths to this study. This study is one of
the first studies to use acceleration data to identify dumbbell
RT exercises using a wrist-worn activity monitor. It also
provides a valuable proof of concept that could be used to
objectively monitor home-based dumbbell RT exercises.
Although this study does provide new information about the
use of objective methods to identify dumbbell RT exercises,
there are also several limitations. The results of the study are
limited to the selected 12 dumbbell exercises. The selected
exercises include a limited number of lower-body exercises
and no exercises that focus on developing core strength.
Another limitation is the inability to identify the resistance
used during the exercises. It should also be noted that this
study was completed in a controlled laboratory setting and
does not assess the ability of the model to differentiate be-
tween RT and non-RT activities. Future work using these
methods in a free-living setting that included other exercises
and activities of daily living is needed. Despite these limi-
tations, this study provides valuable new information about
the ability of researchers to objectively identify RT exer-
cises using accelerometer-based activity monitors.
CONCLUSION
In conclusion, the current study demonstrated that a wrist-
worn triaxial accelerometer-based activity monitor was capable
of accurately classifying 12 different dumbbell RT exercises.
Both SVM and cosine similarity methods demonstrated ac-
curacy of 78% and 85%, respectively, in classifying RT
exercises. This study demonstrated that it is possible to
identify different dumbbell RT exercises and count the num-
ber of repetitions performed, using a single activity monitor
worn on the wrist.
The authors thank the study volunteers for their participation in
this research project. In addition, they thank Dr. Brian Rider for his
assistance with the study design and Rees Odhiambo and Mitchell
Clemens for their assistance during data collection.
The authors declare no conflicts of interest or funding sources for
this study. The results of this study do not constitute endorsement
by the American College of Sports Medicine.
REFERENCES
1. Benbasat AY, Paradiso JA. An inertial measurement framework
for gesture recognition and applications. GW 2001 LNCS (LNAI).
2002;2298:9–20.
2. Casella G, Berger RL. Statistical Inference. 2nd ed. Dexbury: Pa-
cific Grove (CA); 2002.
3. Chang K-h, Chen MY, Canny J. Tracking free-weight exercises.
In: Krumm J, Abowd GD, Seneviratne A, Strang T, editors. UbiComp
2007: Ubiquitous Computing LNCS. Heidelberg: Springer-Verlag;
2007. pp. 19–37.
4. Cortes C, Vapnik V. Support-vector networks. Machine Learning.
1995;20:273–97.
5. Dong B, Montoye A, Moore R, Pfeiffer K, Biswas S. Energy-
aware activity classification using wearable sensor networks. Proc
SPIE Int Soc Opt Eng. 2013;8723:87230Y.
6. Esco MR, Snarr RL, Leatherwood MD, et al. Comparison of total
and segmental body composition using DXA and multifrequency
bioimpedance in collegiate female athletes. J Strength Cond Res.
2015;29(4):918–25.
7. Garber CE, Blissmer B, Deschenes MR, et al. American College
of Sports Medicine Position Stand: quantity and quality of ex-
ercise for developing and maintaining cardiorespiratory, muscu-
loskeletal, and neuromotor fitness in apparently healthy adults:
guidance for prescribing exercise. Med Sci Sports Exerc. 2011;
43(7):1334–59.
8. Hastie T, Tibshirani R, Friedman J. The Elements of Statistical
Learning: Data Mining, Inference, and Prediction. 2nd ed. New
York: Springer; 2003.
9. Hawkins DM, Basak SC, Mills D. Assessing model fit by cross-
validation. J Chem Inf Comput Sci. 2003;43(2):579–86.
10. Kane NA, Simmons MC, John D, Thompson DL, Bassett DR.
Validity of the Nike+ device during walking and running. Int J
Sports Med. 2010;31(2):101–5.
http://www.acsm-msse.org1854 Official Journal of the American College of Sports Medicine
APPLIEDSCIENCES
Copyright © 2016 by the American College of Sports Medicine. Unauthorized reproduction of this article is prohibited.
- 9. 11. Landis JR, Koch GG. The measurement of observer agreement for
categorical data. Biometrics. 1977;33:159–74.
12. Margarito J, Helaoui R, Bianchi AM, Sartor F, Bonomi AG. User-
independent recognition of sports activities from a single wrist-
worn accelerometer: a template-matching-based approach. IEEE
Trans Biomed Eng. 2016;63:788–96.
13. Sidorov G, Gelbukh A, Go´mez-Adorno H, Pinto D. Soft similarity
and soft cosine measure: similarity of features in vector space
model. Computacio´n y Sistemas. 2014;18(3):491–504.
14. Smith SW. The Scientist and Engineer_s Guide to Digital Signal
Processing. San Diego (CA): California Technical Publishing; 1997.
15. Strang G. Introduction to Linear Algebra. 3rd ed. Wellesley (MA):
Wellesley-Cambridge Press; 2003.
16. Trost SG, Zheng Y, Wong WK. Machine learning for activity rec-
ognition: hip versus wrist data. Physiol Meas. 2014;35(11):2183–9.
17. U.S. Department of Health and Human Services. 2008 Physical
Activity Guidelines for Americans. 2008.
18. Welk GJ. Physical Activity Assessments for Health-Related Re-
search. Champaign (IL): Human Kinetics; 2002.
19. Weyand PG, Kelly M, Blackadar T, et al. Ambulatory estimates of
maximal aerobic power from foot-ground contact times and heart
rates in running humans. J Appl Physiol (1985). 2001;91:451–8.
20. Williams MA, Haskell WL, Ades PA, et al. Resistance exercise
in individuals with and without cardiovascular disease: 2007
update: a scientific statement from the American Heart Associ-
ation Council on Clinical Cardiology and Council on Nutrition,
Physical Activity, and Metabolism. Circulation. 2007;116(5):
572–84.
21. Zhang S, Rowlands AV, Murray P, Hurst TL. Physical activity
classification using the GENEA wrist-worn accelerometer. Med
Sci Sports Exerc. 2012;44(4):742–8.
22. Zhao W, Adolph AL, Puyau MR, Vohra FA, Butte NF, Zakeri IF.
Support vector machines classifiers of physical activities in pre-
schoolers. Physiol Rep. 2013;1(1):e00006.
OBJECTIVE ASSESSMENT OF STRENGTH TRAINING Medicine Science in Sports Exercised 1855
APPLIEDSCIENCES
Copyright © 2016 by the American College of Sports Medicine. Unauthorized reproduction of this article is prohibited.