
Recommandé
Recommandé
Contenu connexe
Similaire à vaccine_checklist_of_statistical_analytical_reporting_2012b.doc
Similaire à vaccine_checklist_of_statistical_analytical_reporting_2012b.doc (20)
Plus de ShahriarHabib4
Plus de ShahriarHabib4 (13)
Dernier
Dernier (20)
vaccine_checklist_of_statistical_analytical_reporting_2012b.doc
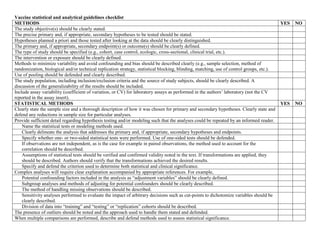
- 1. Vaccine statistical and analytical guidelines checklist METHODS YES NO The study objective(s) should be clearly stated. The precise primary and, if appropriate, secondary hypotheses to be tested should be stated. Hypotheses planned a priori and those tested after looking at the data should be clearly distinguished. The primary and, if appropriate, secondary endpoint(s) or outcome(s) should be clearly defined. The type of study should be specified (e.g., cohort, case control, ecologic, cross-sectional, clinical trial, etc.). The intervention or exposure should be clearly defined. Methods to minimize variability and avoid confounding and bias should be described clearly (e.g., sample selection, method of randomization, biological and/or technical replication strategy, statistical blocking, blinding, matching, use of control groups, etc.). Use of pooling should be defended and clearly described. The study population, including inclusion/exclusion criteria and the source of study subjects, should be clearly described. A discussion of the generalizability of the results should be included. Include assay variability (coefficient of variation, or CV) for laboratory assays as performed in the authors’ laboratory (not the CV reported in the assay insert). STATISTICAL METHODS YES NO Clearly state the sample size and a thorough description of how it was chosen for primary and secondary hypotheses. Clearly state and defend any reductions in sample size for particular analyses. Provide sufficient detail regarding hypothesis testing and/or modeling such that the analyses could be repeated by an informed reader. Name the statistical tests or modeling methods used. Clearly delineate the analysis that addresses the primary and, if appropriate, secondary hypotheses and endpoints. Specify whether one- or two-sided statistical tests were performed. Use of one-sided tests should be defended. If observations are not independent, as is the case for example in paired observations, the method used to account for the correlation should be described. Assumptions of statistical tests should be verified and confirmed validity noted in the text. If transformations are applied, they should be described. Authors should verify that the transformations achieved the desired results. Specify and defend the criterion used to determine both statistical and clinical significance. Complex analyses will require clear explanation accompanied by appropriate references. For example, Potential confounding factors included in the analysis as “adjustment variables” should be clearly defined. Subgroup analyses and methods of adjusting for potential confounders should be clearly described. The method of handling missing observations should be described. Sensitivity analyses performed to evaluate the impact of arbitrary decisions such as cut-points to dichotomize variables should be clearly described. Division of data into “training” and “testing” or “replication” cohorts should be described. The presence of outliers should be noted and the approach used to handle them stated and defended. When multiple comparisons are performed, describe and defend methods used to assess statistical significance.
- 2. State and reference the analytical software used. REPORTING OF RESULTS YES NO A table describing baseline characteristics and demographics of the study sample should be included. Details of the numbers of study subjects should be presented, and reasons for loss of study subjects described. Hypothesis testing When more than one statistical test is performed in a manuscript, the test used for each result reported should be clear. Exact p-values should be reported. Reporting of less than or greater than a given threshold should be avoided. When the analysis involves adjustment for potential confounding factors, both unadjusted and adjusted results should be presented. Descriptive statistics Measures of center should be reported and defined (e.g., proportion or odds ratios, mean for symmetric data distributions or median for skewed data distributions). Appropriate measures of variability should be reported and clearly defined. Standard deviation should be used for variability of individual data points while standard errors should be used for the variability of the mean. Interquartile range (IQR) is most appropriate for skewed data. Measures of uncertainty such as confidence intervals should be reported in addition to p-values in order to indicate the precision of the estimate. Reporting of the measures of center and variation in the format of mean ± standard deviation or standard error should be avoided as it misleads the reader into thinking an estimate is more precise than it really is. Appropriate significant digits should be used that reflect the precision of the measurement process. Units of measurement should be stated. INTERPRETATION AND DISCUSSION YES NO A discussion of clinical versus statistical significance is useful. Statistical association should not be implied or confused with a causal relationship. Lack of statistical significance should not be automatically interpreted as “no effect.” It should be interpreted in light of the study design, sample size and other strengths and weaknesses. Address weaknesses in study design and implementation of the study design and discuss the possible impact on the interpretation of the results. FIGURES AND TABLES YES NO Figures and tables should clearly display the data while the text describes the data. Figures and tables should be able to stand alone. That is, all information necessary for interpretation should be included within the figure and legend. Figures displaying actual data points are preferred over bar charts. These allow the reader to visually assess sample size, variability and skewness present in the data. Pie charts, three-dimensional bar charts, and stacked bar charts should be avoided as they have been demonstrated to be very difficult to read and interpret accurately. Note: Implementation of these guidelines is effective June 1, 2012 and is discussed in Vaccine 30 (2012) 2915– 2917.