
Recommandé
Contenu connexe
Tendances
Tendances (20)
Similaire à Lane Detection
Similaire à Lane Detection (20)
Dernier
Dernier (20)
Lane Detection
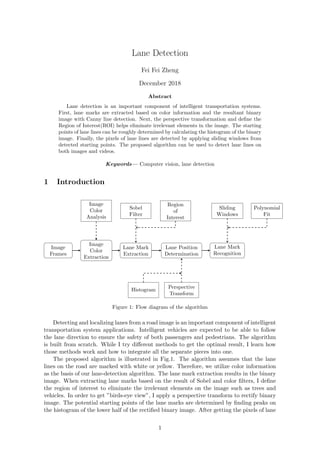
- 1. Lane Detection Fei Fei Zheng December 2018 Abstract Lane detection is an important component of intelligent transportation systems. First, lane marks are extracted based on color information and the resultant binary image with Canny line detection. Next, the perspective transformation and define the Region of Interest(ROI) helps eliminate irrelevant elements in the image. The starting points of lane lines can be roughly determined by calculating the histogram of the binary image. Finally, the pixels of lane lines are detected by applying sliding windows from detected starting points. The proposed algorithm can be used to detect lane lines on both images and videos. Keywords— Computer vision, lane detection 1 Introduction Image Frames Image Color Extraction Image Color Analysis Lane Mark Extraction Sobel Filter Region of Interest Lane Position Determination Perspective Transform Histogram Lane Mark Recognition Sliding Windows Polynomial Fit Figure 1: Flow diagram of the algorithm Detecting and localizing lanes from a road image is an important component of intelligent transportation system applications. Intelligent vehicles are expected to be able to follow the lane direction to ensure the safety of both passengers and pedestrians. The algorithm is built from scratch. While I try different methods to get the optimal result, I learn how those methods work and how to integrate all the separate pieces into one. The proposed algorithm is illustrated in Fig.1. The algorithm assumes that the lane lines on the road are marked with white or yellow. Therefore, we utilize color information as the basis of our lane-detection algorithm. The lane mark extraction results in the binary image. When extracting lane marks based on the result of Sobel and color filters, I define the region of interest to eliminate the irrelevant elements on the image such as trees and vehicles. In order to get ”birds-eye view”, I apply a perspective transform to rectify binary image. The potential starting points of the lane marks are determined by finding peaks on the histogram of the lower half of the rectified binary image. After getting the pixels of lane 1
- 2. marks with sliding windows moving upward from starting points, I can fit a polynomial line to those points to find the direction of the lane. After all, I can pass back an overlay to the original frame of the area between the curves to visualize the result. 2 Datasets It’s a 4-hour road trip video from YouTube. The video is converted into thousands of frames. I randomly select one thousand continuous frames and divided them into four groups. Each frame is 1920 by 1080 pixels. The frames are used to test the accuracy of the algorithm. 3 Algorithm 3.1 Lane Mark Extraction Given an image in RGB color space, it first converts to LAB color space Fig.2. It will apply Sobel filter in both x-axis and y-axis to the L channel image, then use the combination of color and gradient thresholds to obtain a magnitude-based and direction-based binary image where the lane lines are clearly visible Fig.3. 0 250 500 750 1000 1250 1500 1750 0 200 400 600 800 1000 Original Image 0 250 500 750 1000 1250 1500 1750 0 200 400 600 800 1000 L Channel 0 250 500 750 1000 1250 1500 1750 0 200 400 600 800 1000 A Channel 0 250 500 750 1000 1250 1500 1750 0 200 400 600 800 1000 B Channel Figure 2: Original Image and LAB color space 3.2 Lane Position Determination Pick four points in a trapezoidal shape lying along the lines that would represent a rectangle when looking down on the road from above. Apply perspective transform by using the warpPerspective function in OpenCV to generate the rectified binary image with ”birds- eye view”. The white pixels on the image potentially belong to the lane marks. Peak detection function takes the lower half of the warped binary image, the highest points of 2
- 3. 0 250 500 750 1000 1250 1500 1750 0 200 400 600 800 1000 Binary Image with Sobel Filter and color threshold 0 250 500 750 1000 1250 1500 1750 0 200 400 600 800 1000 Binary Image with ROI mask Figure 3: Binary Images the accumulated values in each side are potential starting points to detect lane marks Fig.4. When the car deviates from the center of the lane, if the histogram is simply divided into left and right half, the peaks detection result will be incorrect. To solve this problem, an assertion loop is implemented in the function. Assume the lane width is not less than 500 pixels compare to the image size, if the distance between two detected peak is less than the lane width, it will adjust the center of histogram based on the location of current peaks and re-detect the peaks. 0 250 500 750 1000 1250 1500 1750 0 200 400 600 800 1000 Warped Binary Image (Perspective Transformation) 0 250 500 750 1000 1250 1500 1750 2000 x axis 0 100 200 300 400 500 pixelcount Histogram of Binary Warped Image Left peak Right peak Figure 4: Peak Detection 3.3 Lane Mark Recognition 0 250 500 750 1000 1250 1500 1750 0 200 400 600 800 1000 Sliding Windows Lane Detection 0 250 500 750 1000 1250 1500 1750 0 200 400 600 800 1000 Lane Region Figure 5: Peak Detection 3
- 4. The sliding window detection function begins tracing lanes in the binary images with series of left and right ”windows” moving upwards, show in Fig.5. The search windows start from the peaks detected in the histogram. If the pixels in a search window is beyond the threshold value, the window will be re-centered to the mean position. When the lane marked is dashed, it is possible no activated pixels in a search window. In this case, the window will make a guess based on the other lane lines and a lane mark width. Since the frames are continuous, the previous lane position can be used as a reference to improve the efficiency of the sliding windows detection. After the window sliding search, a list of left and right pixel locations are collected. Fit a quadratic equation to all the pixels by using polyfit function in NumPy. Detected lane can overlay on the original image by using the inverse matrix of the perspective transform to visualize the algorithm result Fig. 6. 0 250 500 750 1000 1250 1500 1750 0 200 400 600 800 1000 Original Image 0 250 500 750 1000 1250 1500 1750 0 200 400 600 800 1000 Original Image with Detected Lane Overlay Figure 6: Lane Detection 4 Results 0 250 500 750 1000 1250 1500 1750 0 200 400 600 800 1000 Original Image 0 250 500 750 1000 1250 1500 1750 0 200 400 600 800 1000 Original Image with Detected Lane Overlay 0 250 500 750 1000 1250 1500 1750 0 200 400 600 800 1000 Original Image 0 250 500 750 1000 1250 1500 1750 0 200 400 600 800 1000 Original Image with Detected Lane Overlay 0 250 500 750 1000 1250 1500 1750 0 200 400 600 800 1000 Original Image 0 250 500 750 1000 1250 1500 1750 0 200 400 600 800 1000 Original Image with Detected Lane Overlay 0 250 500 750 1000 1250 1500 1750 0 200 400 600 800 1000 Original Image 0 250 500 750 1000 1250 1500 1750 0 200 400 600 800 1000 Original Image with Detected Lane Overlay 0 250 500 750 1000 1250 1500 1750 0 200 400 600 800 1000 Original Image 0 250 500 750 1000 1250 1500 1750 0 200 400 600 800 1000 Original Image with Detected Lane Overlay 0 250 500 750 1000 1250 1500 1750 0 200 400 600 800 1000 Original Image 0 250 500 750 1000 1250 1500 1750 0 200 400 600 800 1000 Original Image with Detected Lane Overlay Figure 7: Lane Detection Results The test results of the algorithm are shown in Fig. 7. The run time of processing single frame is 1.24 seconds. 4
- 5. 5 Conclusion This project covers the color and gradient threshold, perspective transform and sliding win- dows to identify lane marks. The data set is chosen randomly with no camera specification. For the binary image of perspective transformation Fig.3, the lane marks are not exactly parallel. Generally, we calibrate the camera before applying the algorithm. This algorithm is surprisingly robust to detect the lane marks accurately without camera parameters. There are many improvements could be made to this project. In practice, the lane width may be changing over time where the lane marks may not appear on the bottom of the frame. Auto increasing search window width may help in this situation. Develop more flexible lane mark extraction method to produce better binary image under various lighting conditions. Apply other relevant computer vision techniques to reinforce the algorithm when noisy in the image increases. 5