SlideShare a Scribd company logo
1 of 18
Download to read offline
Nine-month report 2015 (1 Dec 2014 – 31 Aug 2015)
Q3
H & M Hennes & Mauritz AB
Nine-month report
Nine months (1 December 2014 — 31 August 2015)
 Well-received collections for all brands in the H&M group resulted in good sales
and increased market share. The H&M group’s sales excluding VAT increased by
22 percent to SEK 132,167 m (108,775) during the first nine months of the financial
year. In local currencies the increase was 12 percent.
 Profit after financial items amounted to SEK 20,094 m (18,096), an increase of
11 percent. The group’s profit after tax increased to SEK 15,372 m (13,754),
corresponding to SEK 9.29 (8.31) per share, an increase of 12 percent.
Third quarter (1 June 2015 — 31 August 2015)
 The H&M group’s sales in SEK excluding VAT increased by 19 percent to
SEK 46,024 m (38,805) during the third quarter. In local currencies the increase
was 11 percent.
 Gross profit amounted to SEK 25,712 m (22,627), an increase of 14 percent.
This corresponds to a gross margin of 55.9 percent (58.3).
 Profit after financial items was at the same level as last year and amounted to
SEK 6,936 m (6,967). The group’s profit after tax amounted to SEK 5,306 m (5,296),
corresponding to SEK 3.21 (3.20) per share.
 H&M’s first stores in Macau were very well received on its openings in the quarter.
 A very good start for H&M Beauty since its launch in July. H&M Beauty can today
be found in around 700 stores in 28 markets and also at hm.com.
 Sales including VAT in the period 1 September – 22 September 2015 increased
by 12 percent in local currencies compared to the same period last year.
 Continued strong expansion: approximately 400 new stores net are planned to
open in 2015. India and South Africa will be new H&M markets in October 2015.
Eight new H&M online markets have opened so far in 2015, all of which have had a
very good reception. Switzerland and Russia will become new online markets
during autumn 2015.
 In the 2015/2016 financial year, H&M plans to offer e-commerce in a further nine
existing H&M markets and also to open stores in three new markets: New Zealand,
Cyprus and Puerto Rico.
SEK m
Q3
2015
Q3
2014
Nine months
2015
Nine months
2014
Net sales 46,024 38,805 132,167 108,775
Gross profit 25,712 22,627 75,170 63,278
gross margin, % 55.9 58.3 56.9 58.2
Operating profit 6,869 6,886 19,858 17,852
operating margin, % 14.9 17.7 15.0 16.4
Net financial items 67 81 236 244
Profit after financial items 6,936 6,967 20,094 18,096
Tax -1,630 -1,671 -4,722 -4,342
Profit for the period 5,306 5,296 15,372 13,754
Earnings per share, SEK 3.21 3.20 9.29 8.31
Nine months
Sales +22 %
Profits +12 %
H&M Beauty
Nine-month report 2015 (1 Dec 2014 - 31 Aug 2015)
2
Comments by Karl-Johan Persson, CEO
“So far this year our sales have exceeded SEK 153 billion including VAT, an increase of
more than 20 percent – an acknowledgement that our collections are well appreciated
worldwide. Sales were also good in the third quarter even though sales in August were
negatively affected by the unseasonably warm weather in many of our large European
markets. When the weather became more normal in September, sales took off again
and we are looking forward to an exciting fashion autumn.
Profits have developed well during the first nine months of the year, although profits in
the third quarter were negatively affected by increased purchasing costs due to the
strong US dollar. As always, we are reviewing our customer offering in each market and
we are monitoring the market closely to ensure that we offer the best combination of
fashion, quality, price and sustainability.
We are also strengthening our offering by continuously developing and improving our
range even further. For example, our new concept H&M Beauty was launched during
the summer. H&M Beauty has enjoyed a very good start in around 700 stores in 28
markets as well as online. We are now continuing the roll-out to a further 14 markets
during the autumn. We are also looking into launching other new concepts and brands;
we will come back to this at a later date.
Our online roll-out to new countries is continuing according to plan. We will open our
H&M online store in both Switzerland and Russia during this autumn, giving us 23
H&M online markets at the end of the financial year. In 2016 we plan to offer
e-commerce in a further nine existing H&M markets. These countries will be Ireland,
Japan, Greece, Croatia, Slovenia, Estonia, Latvia, Lithuania and Luxembourg.
In parallel with our rapid online expansion we are also opening stores at a fast pace.
In the fourth quarter we will open approximately 240 new stores net – which is almost
three new stores per day. India and South Africa will become two new and exciting
H&M countries this autumn, when we open our first store in New Delhi next week and in
Cape Town later on in October. Next year, we plan to open stores in three new markets:
New Zealand, Cyprus and Puerto Rico.
Our other brands are performing well and are continuing to reach out to more and more
customers. For example, COS now has around 130 stores across 27 markets, Monki
more than 90 stores in 13 markets, & Other Stories 25 stores in 10 markets and
Weekday 20 stores in five markets.
There is also much going on within our sustainability work. Our strategy for Fair Living
Wages, which we are working on together with other big buyers in our purchasing
countries, is showing good progress and now more and more of our suppliers will start
using the Fair Wage method to achieve fairer wage setting for their employees. In
addition, thanks to the commitment of our customers we have now collected almost
20,000 tonnes of garments for re-use and recycling since 2013. Some of these have
been turned into brand new clothing, most recently into some great denim pieces
currently in our stores. Through the H&M Conscious Foundation, which works on issues
of concern, we contribute humanitarian support in countries where H&M operates.
Alongside this the foundation has established a new prize, the Global Change Award,
which encourages innovation in the textile industry. The aim is to develop new
processes that enable used garments to be recycled on a larger scale, which we hope
will lead our industry towards a more circular economy.”
Global Change Award
“We are very proud that our
customers have so far handed
in almost 20,000 tonnes of
garments to our stores. In
order to find the best ideas for
how to close the loop for
textiles the H&M Conscious
Foundation has established a
prize, the Global Change
Award, to create a real game
changer for the industry.”
Nine-month report 2015 (1 Dec 2014 - 31 Aug 2015)
3
Sales
Well-received collections for all brands and continued strong expansion led to increased
sales and continued market share gains for the H&M group in a fashion retail market
that in many countries was still characterised by a challenging macroeconomic situation.
Sales in the third quarter were strong in June and July, but in August sales were
negatively affected by the unseasonably warm weather in many of the H&M group’s
large European markets.
Sales including VAT converted into SEK increased by 18 percent to SEK 53,420 m
(45,259) in the third quarter. Sales including VAT in the nine-month period increased by
21 percent and amounted to SEK 153,444 m (126,964).
Sales excluding VAT increased by 19 percent to SEK 46,024 m (38,805) in the third
quarter and by 22 percent to SEK 132,167 m (108,775) in the nine-month period.
In local currencies sales including VAT increased by 11 percent in the third quarter and
by 12 percent in the nine-month period.
The substantial difference between the sales increase in SEK and in local currencies is
due to the weakness of the Swedish krona against most sales currencies in the group
compared to the same period last year.
Currency translation effects arise when sales in local currencies are translated into the
company’s reporting currency, SEK. A positive currency translation effect arises when
the Swedish krona weakens and a negative currency translation effect arises if the
Swedish krona strengthens.
Sales in top ten markets, nine months
45,259
126,964
53,420
153,444
+ 18%
+ 21%
0
50,000
100,000
150,000
200,000
Q3 Nine months
SEK m incl VAT
2014
2015
2015 2014 31 Aug - 15 2015
SEK m
Inc. VAT
SEK m
Inc. VAT
SEK Local
currency
Number of
stores
New stores
(net)
Germany 27,204 25,557 6 2 447 7
USA 18,358 11,975 53 22 381 25
United Kingdom 11,595 9,180 26 9 254 1
France 10,043 8,952 12 8 213 8
China 7,732 5,117 51 21 299 29
Sweden 6,974 6,597 6 6 172 -4
Italy 6,193 4,994 24 19 138 6
Spain 5,711 4,917 16 12 161 2
Netherlands 5,484 5,344 3 -1 136 1
Switzerland 5,118 4,336 18 0 96 3
Others* 49,032 39,995 23 17 1,378 86
Total 153,444 126,964 21 12 3,675 164
* Whereof franchise 3,287 2,140 54 28 141 11
Change in %
H&M Ladies
Nine-month report 2015 (1 Dec 2014 - 31 Aug 2015)
4
Gross profit and gross margin
H&M’s gross profit and gross margin are a result of many different factors, internal as
well as external, and are also affected by the decisions that H&M takes in line with its
strategy to always have the best customer offering in each individual market – based on
the combination of fashion, quality, price and sustainability.
Gross profit increased by 14 percent to SEK 25,712 m (22,627) in the third quarter,
corresponding to a gross margin of 55.9 percent (58.3). For the nine-month period,
gross profit increased by 19 percent to SEK 75,170 m (63,278), corresponding to a gross
margin of 56.9 percent (58.2).
Markdowns in relation to sales increased by 0.3 percentage points in the third quarter
2015 compared to the corresponding quarter in 2014, mostly due to increased price
activities in August.
Overall, the market situation as regards external factors such as raw material prices,
cost inflation, capacity at suppliers, purchasing currencies and transportation costs has
continued to be negative during the purchasing period for the third quarter compared
to the corresponding purchasing period the previous year, mostly due to the stronger
US dollar.
Since the US dollar strengthened further during the purchasing period for the fourth
quarter, the purchasing costs for the fourth quarter have continued to be negatively
affected.
22,627
25,712
63,278
75,170
58.3%
55.9%
58.2%
56.9%
30%
35%
40%
45%
50%
55%
60%
0
10,000
20,000
30,000
40,000
50,000
60,000
70,000
80,000
Gross profit SEK m
Q3 Nine months
Gross profit SEK m
Q3 Nine months
2014
2015
H&M Sport
Nine-month report 2015 (1 Dec 2014 - 31 Aug 2015)
5
Selling and administration expenses
Cost control in the group remains good. For the third quarter in 2015, the selling and
administrative expenses increased by 20 percent in SEK and 12 percent in local
currencies compared to the third quarter last year. The increase is mainly due to the
expansion and the long-term investments within IT and online, and to the broadening of
the product range.
Profit after financial items
Profit after financial items amounted to SEK 20,094 m (18,096), in the nine-month
period which is an increase of 11 percent. Profit after financial items in the third quarter
was at the same level as last year and amounted to SEK 6,936 m (6,967).
Profits in the third quarter were negatively affected mostly by the effect of the strong
US dollar on purchasing costs and by the unseasonably warm weather in August in
many European markets, which led to weaker sales and increased markdowns. Costs
for long-term investments were also higher than in the corresponding period last year.
These long-term investments aim to further strengthen the H&M group’s market
position and secure future expansion. The investments continue and will be at a higher
level in 2015 than in 2014, and the costs of these investments may be divided unequally
between the quarters.
15,741
45,426
18,843
55,312
+ 20%
+ 22%
0
10,000
20,000
30,000
40,000
50,000
60,000
Q3 Nine months
SEK m
2014
2015
6,967
18,096
6,936
20,094
0%
+ 11%
0
5,000
10,000
15,000
20,000
25,000
Q3 Nine months
SEK m
2014
2015
H&M Man
Nine-month report 2015 (1 Dec 2014 - 31 Aug 2015)
6
Stock-in-trade
Stock-in-trade amounted to SEK 25,205 m (17,940), an increase of 40 percent in SEK
and 38 percent in local currencies compared to the same time the previous year.
Although the reported increase in the stock-in-trade is high, both the level and the
composition of the stock-in-trade are considered to be good with a higher proportion of
new garments compared to the same time last year.
The increase in the stock-in-trade is mostly due to the strengthening of the US dollar,
which affected purchasing costs and thus the value of the stock, but also to the store
and online expansion. The increase is also due to the previously communicated change
in the administrative process surrounding invoice management for goods purchasing as
part of the work to streamline and simplify this process.
In the new process invoices for goods purchases are posted earlier, which means that
the size of the reported stock-in-trade and accounts payable will increase with effect
from the third quarter 2015. This bookkeeping effect has led to an increase of the
reported stock-in-trade by approximately SEK 1,200 m as of 31 August 2015 compared
to the same time last year. For the same reason, accounts payable have increased by
the same amount.
The stock-in-trade amounted to 14.4 percent (12.3) of sales excluding VAT, rolling
12 months and 31.1 percent (26.5) of total assets.
Expansion
H&M remains positive as regards future expansion and the group’s business
opportunities. The strong expansion continues both through stores and online.
H&M’s growth target remains intact. The aim is to increase the number of stores by
10–15 percent per year with continued high profitability.
For the full-year 2015 a net addition of around 400 new stores is planned. China and
USA will be the largest expansion markets for H&M in 2015. There are also still great
opportunities for expansion in other existing markets as well as in new markets.
Five new H&M markets are being added in 2015. The first H&M stores in Taipei, Taiwan
in February, in Lima, Peru in May and in Macau in June have all been very successful. The
other new H&M markets, India and South Africa, are planned to open in October 2015.
The first H&M store in India will open in New Delhi and the first in South Africa will open
in Cape Town. H&M plans to open stores in three new markets during the 2015/2016
financial year: New Zealand, Cyprus and Puerto Rico.
The global rollout of H&M’s online store continues. So far in 2015 H&M has opened eight
new online markets: Portugal, Poland, the Czech Republic, Romania, Slovakia, Hungary,
Bulgaria and Belgium. Switzerland and Russia will become new online markets during
autumn 2015.
17,940
25,205
+ 40%
0
5,000
10,000
15,000
20,000
25,000
30,000
31 Aug
SEK m
2014
2015
& Other Stories in Aarhus in Denmark
Nine-month report 2015 (1 Dec 2014 - 31 Aug 2015)
7
During 2016 H&M plans to offer e-commerce in a further nine of H&M’s existing
markets. These countries are Ireland, Japan, Greece, Croatia, Slovenia, Estonia, Latvia,
Lithuania and Luxembourg.
Expansion continues for the group’s other brands: COS, Monki, Weekday, Cheap
Monday and & Other Stories. The main focus of this expansion is on COS and & Other
Stories, which will open more stores in 2015 than in 2014. COS will open in four new
markets this year. In February a COS franchise store opened in Bahrain. This autumn will
see the opening of the first COS stores in Luxembourg, in Budapest in Hungary and in
Toronto and Montreal in Canada. The first COS store in the Czech Republic is planned
to open in Prague in spring 2016.
H&M Home is also continuing its rapid expansion, with around a hundred new H&M
Home departments and 10 new H&M Home markets in 2015.
Examples of ongoing long-term investments in broadening H&M’s product range
include H&M Sport, H&M Beauty and the extended shoe range.
H&M Beauty has got off to a very good start since its launch began in July. H&M Beauty
is now available in around 700 stores in 28 H&M markets, as well as online. H&M Beauty
is a new and broad concept for make-up, body care and hair care, which offers high
quality value-for-money products in a specially produced design. The launch of H&M
Beauty – which will replace H&M’s current cosmetics – will continue during autumn
2015. By the end of the financial year H&M Beauty will be available in a total of around
900 H&M stores in 42 markets, as well as online at hm.com.
Store count by brand
In the nine-month period, the group opened 206 (245) stores and closed 42 (36) stores,
i.e. a net increase of 164 (209) new stores. The group had 3,675 (3,341) stores as of 31
August 2015, of which 141 were franchise stores.
Store count by region
Current quarter
Sales including VAT in the period 1 September – 22 September 2015 increased by
12 percent in local currencies compared to the same period last year.
Brand Q3 Nine months 2015 2014
H&M 33 142 3,403 3,118
COS 5 14 128 97
Monki -2 2 94 90
Weekday -1 -2 20 21
& Other Stories 1 8 25 10
Cheap Monday 0 0 5 5
Total 36 164 3,675 3,341
New Stores 2015
(Net)
Total No of stores
(31 Aug)
Region Q3 Nine months 2015 2014
Europe 5 69 2,617 2,468
Asia & Oceania 16 58 586 468
North & South America 15 37 472 405
Total 36 164 3,675 3,341
New Stores 2015
(Net)
Total No of stores
(31 Aug)
H&M Beauty
Nine-month report 2015 (1 Dec 2014 - 31 Aug 2015)
8
Tax
The H&M group’s tax rate is expected to be approximately 22.5 – 23.5 percent for the
financial year of 2014/2015. In the first, second and third quarters an estimated tax rate
of 23.5 percent has been used. The final outcome of the tax rate for the year depends
on the results of the group’s various companies and the corporate tax rates in each
country.
Accounting principles
The group applies International Financial Reporting Standards (IFRS) as adopted
by the EU. This report has been prepared according to IAS 34 Interim Financial
Reporting as well as the Swedish Annual Accounts Act.
The accounting principles and calculation methods applied in this report are unchanged
from those used in the preparation of the annual report and consolidated financial
statements for 2013/2014 which are described in Note 1 – Accounting principles.
H & M Hennes & Mauritz AB’s financial instruments consist of accounts receivable, other
receivables, cash and cash equivalents, accounts payable, accrued trade payables,
interest-bearing securities and currency derivatives. Currency derivatives are measured
at fair value based on input data corresponding to level 2 of IFRS 13. Other financial
assets and liabilities have short terms. It is therefore judged that the fair values of these
financial instruments are approximately equal to their book values.
The parent company applies the Swedish Annual Accounts Act and the Swedish
Financial Reporting Board’s recommendation RFR 2 Accounting for Legal Entities, which
essentially involves applying IFRS. In accordance with RFR 2, the parent company does
not apply IAS 39 to the measurement of financial instruments; nor does it capitalise
development expenditure.
For definitions see the Annual Report.
Risks and uncertainties
A number of factors may affect H&M’s results and business. Many of these can be dealt
with through internal routines, while certain others are affected more by external
influences. There are risks and uncertainties related to fashion, weather conditions,
negative macro-economic changes, sustainability and external factors in production
countries, trade interventions, foreign currency and tax but also in connection with
expansion into new markets, the launch of new concepts, changes in consumer
behaviour and how the brand is managed. There are also some risks related to the
group’s reputation, so called “reputational risks”.
For a more detailed description of risks and uncertainties, refer to the administration
report and to note 2 in the annual report and consolidated accounts for 2014.
Calendar
28 January 2016 Full-year report, 1 Dec 2014 – 30 November 2015
6 April 2016 Three-month report, 1 Dec 2015 – 29 February 2016
3 May 2016 Annual General Meeting 2016, Victoriahallen,
Stockholm International Fairs at 3 p.m.
Stockholm, 23 September 2015
Board of Directors
Nine-month report 2015 (1 Dec 2014 - 31 Aug 2015)
9
Review report
H & M Hennes & Mauritz AB (publ), corporate identity number 556042-7220
Introduction
We have reviewed the interim report for H & M Hennes & Mauritz AB (publ) as of 31
August 2015 and for the nine-month period which ended on this date. It is the
responsibility of the Board of Directors and the Chief Executive Officer to prepare and
present this interim report in accordance with IAS 34 and the Swedish Annual Accounts
Act. Our responsibility is to express an opinion on this interim report based on our
review.
Focus and scope of review
We conducted our review in accordance with the International Standard on Review
Engagements (ISRE 2410), Review of Interim Financial Information Performed by the
Independent Auditor of the Entity.
A review consists of making inquiries, primarily of persons responsible for financial and
accounting matters, and applying analytical and other review procedures. A review has
a different focus and is substantially less in scope compared with the focus and scope
of an audit conducted in accordance with the International Standards on Auditing and
the generally accepted auditing practices.
The procedures performed in a review do not enable us to obtain a level of assurance
that would make us aware of all significant matters that might be identified in an audit.
Therefore, the opinion expressed based on a review does not provide the same level of
assurance as an opinion expressed on the basis of an audit.
Conclusion
On the basis of our review, nothing has come to our attention that causes us to believe
that the interim report, in all material aspects, was not prepared in accordance with IAS
34 and the Swedish Annual Accounts Act in the case of the group and in accordance
with the Annual Accounts Act in the case of the parent company.
Stockholm, 23 September 2015
Ernst & Young AB
Åsa Lundvall
Authorised Public Accountant
The information in this interim report is that which H & M Hennes & Mauritz AB (publ) is required to disclose under Sweden’s
Securities Market Act. It will be released for publication at 8.00 (CET) on 24 September 2015. This interim report, and other
information about H&M, is available at www.hm.com
Contact persons
Nils Vinge, IR +46-8-796 52 50
Karl-Johan Persson, CEO +46-8-796 55 00 (switchboard)
Jyrki Tervonen, CFO +46-8-796 55 00 (switchboard)
H & M Hennes & Mauritz AB (publ)
SE-106 38 Stockholm
Phone: +46-8-796 55 00, Fax: +46-8-24 80 78, E-mail: info@hm.com
Registered office: Stockholm, Reg. No. 556042-7220
H & M Hennes & Mauritz AB (publ) was founded in Sweden in 1947 and is quoted on Nasdaq Stockholm. H&M’s business idea is to offer fashion and quality at the best
price in a sustainable way. In addition to H&M, the group includes the brands COS, Monki, Weekday, Cheap Monday, & Other Stories as well as H&M Home. The H&M
group has more than 3,600 stores in 59 markets including franchise markets. In 2014, sales including VAT amounted to SEK 177 billion and the number of employees
was more than 132,000. For further information, visit www.hm.com.
Nine-month report 2015 (1 Dec 2014 – 31 Aug 2015)
10
GROUP INCOME STATEMENT (SEK m)
Sales including VAT 53,420 45,259 153,444 126,964 176,620
Sales excluding VAT 46,024 38,805 132,167 108,775 151,419
Cost of goods sold -20,312 -16,178 -56,997 -45,497 -62,367
GROSS PROFIT 25,712 22,627 75,170 63,278 89,052
Gross margin, % 55.9 58.3 56.9 58.2 58.8
Selling expenses -17,371 -14,568 -50,953 -41,871 -58,525
Administrative expenses -1,472 -1,173 -4,359 -3,555 -4,944
OPERATING PROFIT 6,869 6,886 19,858 17,852 25,583
Operating margin, % 14.9 17.7 15.0 16.4 16.9
Interest income 71 84 242 250 328
Interest expense -4 -3 -6 -6 -16
PROFIT AFTER FINANCIAL ITEMS 6,936 6,967 20,094 18,096 25,895
Tax -1,630 -1,671 -4,722 -4,342 -5,919
PROFIT FOR THE PERIOD 5,306 5,296 15,372 13,754 19,976
All profit for the year is attributable to the shareholders of the parent company H & M Hennes & Mauritz AB.
Earnings per share, SEK* 3.21 3.20 9.29 8.31 12.07
Number of shares, thousands* 1,655,072 1,655,072 1,655,072 1,655,072 1,655,072
Depreciation, total 1,588 1,231 4,708 3,709 5,045
of which cost of goods sold 176 139 533 417 568
of which selling expenses 1,310 1,015 3,872 3,061 4,159
of which administrative expenses 102 77 303 231 318
* Before and after dilution.
CONSOLIDATED STATEMENT OF COMPREHENSIVE INCOME (SEK m)
Q3
2015
Q3
2014
Nine months
2015
Nine months
2014
1 Dec 2013-
30 Nov 2014
PROFIT FOR THE PERIOD 5,306 5,296 15,372 13,754 19,976
Other comprehensive income
Items that have been reclassified or may be reclassified to profit or loss
Translation differences -450 866 1,414 1,323 1,979
Change in hedging reserves -72 -134 -217 -34 185
Tax attributable to change in hedging reserves 7 32 42 8 -44
Items that have not been and will not be reclassified to profit or loss
Revaluations relating to defined benefit pension plans - - - - -148
Tax attributable to the above revaluation - - - - 35
OTHER COMPREHENSIVE INCOME -515 764 1,239 1,297 2,007
TOTAL COMPREHENSIVE INCOME FOR THE PERIOD 4,791 6,060 16,611 15,051 21,983
All comprehensive income is attributable to the shareholders of the parent company H & M Hennes & Mauritz AB.
Q3
2015
Q3
2014
1 Dec 2013-
30 Nov 2014
Nine months
2015
Nine months
2014
Nine-month report 2015 (1 Dec 2014 – 31 Aug 2015)
11
GROUP BALANCE SHEET IN SUMMARY (SEK m)
ASSETS 31 Aug - 2015 31 Aug - 2014 30 Nov 2014
Fixed assets
Intangible fixed assets 3,900 2,819 2,962
Tangible fixed assets 30,440 25,002 26,948
Financial assets 3,139 2,483 2,946
37,479 30,304 32,856
Current assets
Stock-in-trade 25,205 17,940 19,403
Current receivables 7,374 6,031 6,645
Short-term investments, 4-12 months - - 2,602
Cash and cash equivalents 10,963 13,451 14,091
43,542 37,422 42,741
TOTAL ASSETS 81,021 67,726 75,597
EQUITY AND LIABILITIES
Equity 52,030 44,576 51,556
Long-term liabilities* 3,965 3,324 3,738
Current liabilities** 25,026 19,826 20,303
TOTAL EQUITY AND LIABILITIES 81,021 67,726 75,597
* Only provisions for pensions are interest-bearing.
** No current liabilities are interest-bearing.
CHANGE IN GROUP EQUITY IN SUMMARY (SEK m)
31 Aug - 2015 31 Aug - 2014 30 Nov 2014
Shareholders' equity at the beginning of the period 51,556 45,248 45,248
Total comprehensive income for the period 16,611 15,051 21,983
Overdue bonus share rights - - 48
Dividend -16,137 -15,723 -15,723
Shareholders' equity at the end of the period 52,030 44,576 51,556
Nine-month report 2015 (1 Dec 2014 – 31 Aug 2015)
12
GROUP CASH FLOW STATEMENT (SEK m)
Nine months 2015 Nine months 2014
Current operations
Profit after financial items* 20,094 18,096
Provisions for pensions 59 35
Depreciation 4,708 3,709
Tax paid -4,639 -4,199
Cash flow from current operations before changes in working capital 20,222 17,641
Cash flow from changes in working capital
Current receivables -622 -418
Stock-in-trade -5,434 -965
Current liabilities 3,647 1,749
CASH FLOW FROM CURRENT OPERATIONS 17,813 18,007
Investment activities
Investment in intangible fixed assets -1,131 -687
Investment in tangible fixed assets -6,762 -5,661
Change in short-term investments, 4 - 12 months 2,673 3,306
Other investments -117 -47
CASH FLOW FROM INVESTMENT ACTIVITIES -5,337 -3,089
Financial activities
Dividend -16,137 -15,723
CASH FLOW FROM FINANCIAL ACTIVITIES -16,137 -15,723
CASH FLOW FOR THE PERIOD -3,661 -805
Cash and cash equivalents at beginning of the financial year 14,091 13,918
Cash flow for the period -3,661 -805
Exchange rate effect 533 338
Cash and cash equivalents at end of the period** 10,963 13,451
* Interest paid for the group amounts to SEK 6 m (6).
** Cash and cash equivalents and short-term investments 4-12 months at the end of the period amounted to SEK 10,963 m (13,451).
Nine-month report 2015 (1 Dec 2014 – 31 Aug 2015)
13
SALES INCLUDING VAT BY MARKET AND NUMBER OF STORES
Q3, 1 June - 31 August
Market Q3 - 2015 Q3 - 2014 31 Aug - 15
SEK m SEK m SEK Local
currency
No. of stores New
stores
Closed
stores
Sweden 2,469 2,302 7 7 172 5
Norway 1,592 1,532 4 9 117 1
Denmark 1,362 1,269 7 5 102 1
United Kingdom 4,104 3,402 21 5 254 4 3
Switzerland 1,786 1,522 17 0 96
Germany 9,056 8,742 4 1 447 1 1
Netherlands 1,842 1,840 0 -2 136 3 2
Belgium 1,117 1,033 8 5 81
Austria 1,309 1,295 1 -1 76 1
Luxembourg 111 109 2 0 10
Finland 744 710 5 2 60 1
France 3,566 3,205 11 9 213 2
USA 6,565 4,500 46 17 381 13 2
Spain 1,971 1,735 14 11 161 2
Poland 1,173 991 18 15 144 1
Czech Republic 310 257 21 16 44
Portugal 348 289 20 17 30
Italy 2,094 1,724 21 19 138
Canada 1,032 854 21 14 76 3 1
Slovenia 137 129 6 4 12
Ireland 252 207 22 19 21
Hungary 349 268 30 27 36
Slovakia 145 113 28 26 17 1
Greece 386 319 21 18 32
China 2,582 1,883 37 11 299 10 1
Hong Kong 423 362 17 -6 21
Japan 823 736 12 9 53 1
Russia 1,018 881 16 56 86 2
South Korea 300 241 24 8 26 2
Turkey 560 325 72 76 37 2
Romania 448 315 42 39 41
Croatia 211 199 6 2 14
Singapore 237 209 13 0 10
Bulgaria 140 104 35 31 16
Latvia 91 78 17 13 6
Malaysia 242 185 31 24 21 1
Mexico 271 134 102 99 13 2
Chile 132 91 45 36 1
Lithuania 86 69 25 21 7
Serbia 74 57 30 31 5
Estonia 95 61 56 51 6
Australia 270 146 85 81 6 1
Philippines 124 6 1
Taiwan 64 1
Peru 112 1
Macau 40 2 2
Franchise 1,257 836 50 27 141 3 2
Total 53,420 45,259 18 11 3,675 57 21
Change in % Q3 - 2015
Nine-month report 2015 (1 Dec 2014 – 31 Aug 2015)
14
SALES INCLUDING VAT BY MARKET AND NUMBER OF STORES
Nine months, 1 December - 31 August
Market 2015 2014 31 Aug - 15
SEK m SEK m SEK Local
currency
No. of stores New
stores
Closed
stores
Sweden 6,974 6,597 6 6 172 2 6
Norway 4,357 4,183 4 6 117 1
Denmark 3,952 3,758 5 1 102 5 2
United Kingdom 11,595 9,180 26 9 254 5 4
Switzerland 5,118 4,336 18 0 96 3
Germany 27,204 25,557 6 2 447 12 5
Netherlands 5,484 5,344 3 -1 136 4 3
Belgium 3,134 2,888 9 4 81 4 1
Austria 3,904 3,784 3 -1 76 3
Luxembourg 315 309 2 -2 10
Finland 2,082 1,998 4 0 60 1 1
France 10,043 8,952 12 8 213 10 2
USA 18,358 11,975 53 22 381 28 3
Spain 5,711 4,917 16 12 161 7 5
Poland 3,220 2,741 17 12 144 4
Czech Republic 856 693 24 18 44 1
Portugal 955 802 19 14 30
Italy 6,193 4,994 24 19 138 6
Canada 2,796 2,156 30 17 76 5 1
Slovenia 387 358 8 4 12
Ireland 746 582 28 23 21 1
Hungary 961 750 28 24 36 1
Slovakia 407 309 32 27 17 2
Greece 1,195 939 27 22 32 2
China 7,732 5,117 51 21 299 32 3
Hong Kong 1,395 1,127 24 -2 21
Japan 2,697 2,364 14 7 53 4 2
Russia 2,629 2,283 15 52 86 15
South Korea 924 682 35 14 26 4
Turkey 1,517 843 80 71 37 7
Romania 1,274 864 47 41 41 3
Croatia 579 548 6 1 14
Singapore 737 589 25 7 10
Bulgaria 363 265 37 31 16
Latvia 228 173 32 26 6
Malaysia 747 475 57 40 21 3
Mexico 763 405 88 75 13 7
Chile 384 247 55 41 1
Lithuania 218 150 45 39 7 1
Serbia 231 156 48 48 5
Estonia 232 152 53 47 6
Australia 770 282 173 156 6 3
Philippines 405 6 3
Taiwan 188 1 1
Peru 157 1 1
Macau 40 2 2
Franchise 3,287 2,140 54 28 141 14 3
Total 153,444 126,964 21 12 3,675 206 42
Change in % Nine months
Nine-month report 2015 (1 Dec 2014 – 31 Aug 2015)
15
FIVE YEAR SUMMARY
Nine months, 1 December - 31 August
2011 2012 2013 2014 2015
Sales including VAT, SEK m 92,619 103,018 107,480 126,964 153,444
Sales excluding VAT, SEK m 79,047 88,297 92,067 108,775 132,167
Change from previous year in SEK, % 0 12 4 18 22
Change from previous year in local currencies, % 8 12 8 15 12
Operating profit, SEK m 13,714 15,221 14,908 17,852 19,858
Operating margin, % 17.3 17.2 16.2 16.4 15.0
Depreciation for the period, SEK m 2,465 2,761 3,106 3,709 4,708
Profit after financial items, SEK m 14,140 15,649 15,189 18,096 20,094
Profit after tax, SEK m 10,464 11,580 11,544 13,754 15,372
Cash and cash equivalents and short-term investments, SEK m 16,895 13,552 10,953 13,451 10,963
Stock-in-trade, SEK m 13,310 13,501 15,329 17,940 25,205
Equity, SEK m 38,214 38,275 39,203 44,576 52,030
Number of shares, thousands* 1,655,072 1,655,072 1,655,072 1,655,072 1,655,072
Earnings per share, SEK* 6.32 7.00 6.97 8.31 9.29
Shareholders' equity per share, SEK* 23.09 23.13 23.69 26.93 31.44
Cash flow from current operations
per share, SEK* 6.78 7.88 9.05 10.88 10.76
Share of risk-bearing capital, % 72.9 74.0 73.4 70.2 68.5
Equity/assets ratio, % 71.4 72.3 69.9 65.8 64.2
Total number of stores 2,325 2,629 2,964 3,341 3,675
Rolling twelve months
Earnings per share, SEK* 9.64 10.23 10.17 11.66 13.05
Return on shareholders' equity, % 41.1 44.3 43.4 46.1 44.7
Return on capital employed, % 54.6 58.2 55.8 60.0 57.3
* Before and after dilution.
Definition on key figures see annual report.
Nine-month report 2015 (1 Dec 2014 – 31 Aug 2015)
16
SEGMENT REPORTING (SEK m)
Nine months 2015 Nine months 2014
Asia and Oceania
External net sales 17,120 11,802
Operating profit 1,019 1,516
Operating margin, % 6.0 12.8
Europe
External net sales 93,989 83,088
Operating profit 2,611 6,140
Operating margin, % 2.8 7.4
North and South America
External net sales 21,058 13,885
Operating profit 763 91
Operating margin, % 3.6 0.7
Group Functions
Net sales to other segments 57,366 48,111
Operating profit 15,465 10,105
Eliminations
Net sales to other segments -57,366 -48,111
Total
External net sales 132,167 108,775
Operating profit 19,858 17,852
Operating margin, % 15.0 16.4
Nine-month report 2015 (1 Dec 2014 – 31 Aug 2015)
17
PARENT COMPANY INCOME STATEMENT (SEK m)
Q3
2015**
Q3
2014
Nine months
2015**
Nine months
2014
1 Dec 2013-
30 Nov 2014
External sales excluding VAT - 6 2 10 47
Internal sales excluding VAT* 879 2,241 2,525 6,339 8,764
GROSS PROFIT 879 2,247 2,527 6,349 8,811
Selling expenses - -390 - -1,865 -2,982
Administrative expenses 7 -1,331 -50 -3,824 -5,316
OPERATING PROFIT 886 526 2,477 660 513
Dividend from subsidiaries 47 591 1,357 1,642 15,701
Interest income 11 6 28 42 59
Interest expense -5 -15 -7 -23 -25
PROFIT AFTER FINANCIAL ITEMS 939 1,108 3,855 2,321 16,248
Year-end appropriations - - - - -10
Tax -197 -113 -550 -149 -130
PROFIT FOR THE PERIOD 742 995 3,305 2,172 16,108
* Includes royalty received from group companies.
PARENT COMPANY STATEMENT OF COMPREHENSIVE INCOME (SEK m)
Q3
2015**
Q3
2014
Nine months
2015**
Nine months
2014
1 Dec 2013-
30 Nov 2014
PROFIT FOR THE PERIOD 742 995 3,305 2,172 16,108
Other comprehensive income
Items that have not been and will not be reclassified to profit or loss
Revaluations relating to defined benefit pension plans - - - - -24
Tax attributable to the above revaluation - - - - 5
OTHER COMPREHENSIVE INCOME - - - - -19
TOTAL COMPREHENSIVE INCOME FOR THE PERIOD 742 995 3,305 2,172 16,089
** To simplify administration and internal follow-up, with effect from 1 December 2014 all central functions in Sweden were brought together in one company, H & M
Hennes & Mauritz GBC AB. Due to this, the majority of the revenues and costs in the parent company were transferred to H & M Hennes & Mauritz GBC AB.
Nine-month report 2015 (1 Dec 2014 – 31 Aug 2015)
18
PARENT COMPANY BALANCE SHEET IN SUMMARY (SEK m)
31 Aug - 2015 31 Aug - 2014 30 Nov 2014
ASSETS
Fixed assets
Tangible fixed assets 542 540 648
Financial fixed assets 1,714 1,511 1,553
2,256 2,051 2,201
Current assets
Current receivables 3,207 1,707 11,997
Short-term investments, 4-12 months - - 2,602
Cash and cash equivalents 0 1,147 2,314
3,207 2,854 16,913
TOTAL ASSETS 5,463 4,905 19,114
EQUITY AND LIABILITIES
Equity 4,429 3,344 17,261
Untaxed reserves 464 454 464
Long-term liabilities* 223 213 223
Current liabilities** 347 894 1,166
TOTAL EQUITY AND LIABILITIES 5,463 4,905 19,114
* Relates to provisions for pensions.
** No current liabilities are interest-bearing.

More Related Content

What's hot

Deutsche EuroShop | Company Presentation | 07/18
Deutsche EuroShop | Company Presentation | 07/18 Deutsche EuroShop | Company Presentation | 07/18
Deutsche EuroShop | Company Presentation | 07/18 Deutsche EuroShop AG
 
Deutsche EuroShop | Company Presentation | 12/17
Deutsche EuroShop | Company Presentation | 12/17 Deutsche EuroShop | Company Presentation | 12/17
Deutsche EuroShop | Company Presentation | 12/17 Deutsche EuroShop AG
 
AkzoNobel Q2 2014 Media presentation
AkzoNobel Q2 2014 Media presentationAkzoNobel Q2 2014 Media presentation
AkzoNobel Q2 2014 Media presentationAkzoNobel
 
Deutsche EuroShop | Company Presentation | 02/20
Deutsche EuroShop | Company Presentation | 02/20Deutsche EuroShop | Company Presentation | 02/20
Deutsche EuroShop | Company Presentation | 02/20Deutsche EuroShop AG
 
Electrolux Interim Report Q1 2018 - Report
Electrolux Interim Report Q1 2018 - ReportElectrolux Interim Report Q1 2018 - Report
Electrolux Interim Report Q1 2018 - ReportElectrolux Group
 
UK Consumer Market Update 2015
UK Consumer Market Update 2015UK Consumer Market Update 2015
UK Consumer Market Update 2015Nigel Wright Group
 
Deutsche EuroShop | Company Presentation | 12/21
Deutsche EuroShop | Company Presentation | 12/21Deutsche EuroShop | Company Presentation | 12/21
Deutsche EuroShop | Company Presentation | 12/21Deutsche EuroShop AG
 
Tesco Case Study- Presentation- Marketing Management- MBA
Tesco Case Study- Presentation- Marketing Management- MBATesco Case Study- Presentation- Marketing Management- MBA
Tesco Case Study- Presentation- Marketing Management- MBAVineethJose5
 
Business figures for the third quarter of 2021
Business figures for the third quarter of 2021Business figures for the third quarter of 2021
Business figures for the third quarter of 2021GESCO SE
 
Empirical statistics related to Trade Flow
Empirical statistics related to Trade FlowEmpirical statistics related to Trade Flow
Empirical statistics related to Trade FlowKuldeepBhardwaj38
 
Klöckner & Co - Global Steel Conference 2010
Klöckner & Co - Global Steel Conference 2010Klöckner & Co - Global Steel Conference 2010
Klöckner & Co - Global Steel Conference 2010Klöckner & Co SE
 
Deutsche EuroShop | Conference Call Presentation - Half Year Financial Report...
Deutsche EuroShop | Conference Call Presentation - Half Year Financial Report...Deutsche EuroShop | Conference Call Presentation - Half Year Financial Report...
Deutsche EuroShop | Conference Call Presentation - Half Year Financial Report...Deutsche EuroShop AG
 

What's hot (12)

Deutsche EuroShop | Company Presentation | 07/18
Deutsche EuroShop | Company Presentation | 07/18 Deutsche EuroShop | Company Presentation | 07/18
Deutsche EuroShop | Company Presentation | 07/18
 
Deutsche EuroShop | Company Presentation | 12/17
Deutsche EuroShop | Company Presentation | 12/17 Deutsche EuroShop | Company Presentation | 12/17
Deutsche EuroShop | Company Presentation | 12/17
 
AkzoNobel Q2 2014 Media presentation
AkzoNobel Q2 2014 Media presentationAkzoNobel Q2 2014 Media presentation
AkzoNobel Q2 2014 Media presentation
 
Deutsche EuroShop | Company Presentation | 02/20
Deutsche EuroShop | Company Presentation | 02/20Deutsche EuroShop | Company Presentation | 02/20
Deutsche EuroShop | Company Presentation | 02/20
 
Electrolux Interim Report Q1 2018 - Report
Electrolux Interim Report Q1 2018 - ReportElectrolux Interim Report Q1 2018 - Report
Electrolux Interim Report Q1 2018 - Report
 
UK Consumer Market Update 2015
UK Consumer Market Update 2015UK Consumer Market Update 2015
UK Consumer Market Update 2015
 
Deutsche EuroShop | Company Presentation | 12/21
Deutsche EuroShop | Company Presentation | 12/21Deutsche EuroShop | Company Presentation | 12/21
Deutsche EuroShop | Company Presentation | 12/21
 
Tesco Case Study- Presentation- Marketing Management- MBA
Tesco Case Study- Presentation- Marketing Management- MBATesco Case Study- Presentation- Marketing Management- MBA
Tesco Case Study- Presentation- Marketing Management- MBA
 
Business figures for the third quarter of 2021
Business figures for the third quarter of 2021Business figures for the third quarter of 2021
Business figures for the third quarter of 2021
 
Empirical statistics related to Trade Flow
Empirical statistics related to Trade FlowEmpirical statistics related to Trade Flow
Empirical statistics related to Trade Flow
 
Klöckner & Co - Global Steel Conference 2010
Klöckner & Co - Global Steel Conference 2010Klöckner & Co - Global Steel Conference 2010
Klöckner & Co - Global Steel Conference 2010
 
Deutsche EuroShop | Conference Call Presentation - Half Year Financial Report...
Deutsche EuroShop | Conference Call Presentation - Half Year Financial Report...Deutsche EuroShop | Conference Call Presentation - Half Year Financial Report...
Deutsche EuroShop | Conference Call Presentation - Half Year Financial Report...
 

Viewers also liked

SU16_MECH691_FinalReport_RahulS_09292016
SU16_MECH691_FinalReport_RahulS_09292016SU16_MECH691_FinalReport_RahulS_09292016
SU16_MECH691_FinalReport_RahulS_09292016Rahul Surianarayanan
 
Citienship badge
Citienship badgeCitienship badge
Citienship badgebengbeng13
 
Wading through the mobile WebRTC developer gauntlet (IIT RTC Conference sessi...
Wading through the mobile WebRTC developer gauntlet (IIT RTC Conference sessi...Wading through the mobile WebRTC developer gauntlet (IIT RTC Conference sessi...
Wading through the mobile WebRTC developer gauntlet (IIT RTC Conference sessi...Brian Pulito
 
RoughRiders Foundation2008 Scholarship
RoughRiders Foundation2008 ScholarshipRoughRiders Foundation2008 Scholarship
RoughRiders Foundation2008 ScholarshipCristal Hooper
 
Lss 3003 assessment overview
Lss 3003 assessment overviewLss 3003 assessment overview
Lss 3003 assessment overviewhedleymfb
 
Arkuda.Concert.presentation.2016
Arkuda.Concert.presentation.2016Arkuda.Concert.presentation.2016
Arkuda.Concert.presentation.2016Arkuda Digital
 
Assignment Bank 2 intro
Assignment Bank 2 introAssignment Bank 2 intro
Assignment Bank 2 introcskinner1
 
H&M in Canada
H&M in CanadaH&M in Canada
H&M in CanadaEncrypted
 
Presentation by University of British Columbia - Runner Ups in the CBS Case C...
Presentation by University of British Columbia - Runner Ups in the CBS Case C...Presentation by University of British Columbia - Runner Ups in the CBS Case C...
Presentation by University of British Columbia - Runner Ups in the CBS Case C...CBS Case Competition
 
Enterprise 2.0 - Modelli organizzativi e gestione dei social media in azienda
Enterprise 2.0 - Modelli organizzativi e gestione dei social media in aziendaEnterprise 2.0 - Modelli organizzativi e gestione dei social media in azienda
Enterprise 2.0 - Modelli organizzativi e gestione dei social media in aziendaAlessandro Prunesti
 
Big data, new epistemologies and paradigm shifts
Big data, new epistemologies and paradigm shiftsBig data, new epistemologies and paradigm shifts
Big data, new epistemologies and paradigm shiftsrobkitchin
 

Viewers also liked (16)

SU16_MECH691_FinalReport_RahulS_09292016
SU16_MECH691_FinalReport_RahulS_09292016SU16_MECH691_FinalReport_RahulS_09292016
SU16_MECH691_FinalReport_RahulS_09292016
 
Citienship badge
Citienship badgeCitienship badge
Citienship badge
 
Wading through the mobile WebRTC developer gauntlet (IIT RTC Conference sessi...
Wading through the mobile WebRTC developer gauntlet (IIT RTC Conference sessi...Wading through the mobile WebRTC developer gauntlet (IIT RTC Conference sessi...
Wading through the mobile WebRTC developer gauntlet (IIT RTC Conference sessi...
 
RoughRiders Foundation2008 Scholarship
RoughRiders Foundation2008 ScholarshipRoughRiders Foundation2008 Scholarship
RoughRiders Foundation2008 Scholarship
 
Lss 3003 assessment overview
Lss 3003 assessment overviewLss 3003 assessment overview
Lss 3003 assessment overview
 
2010fall ch14 tselmeg
2010fall ch14 tselmeg2010fall ch14 tselmeg
2010fall ch14 tselmeg
 
Arkuda.Concert.presentation.2016
Arkuda.Concert.presentation.2016Arkuda.Concert.presentation.2016
Arkuda.Concert.presentation.2016
 
Misión
MisiónMisión
Misión
 
Assignment Bank 2 intro
Assignment Bank 2 introAssignment Bank 2 intro
Assignment Bank 2 intro
 
H&M in Canada
H&M in CanadaH&M in Canada
H&M in Canada
 
Presentation by University of British Columbia - Runner Ups in the CBS Case C...
Presentation by University of British Columbia - Runner Ups in the CBS Case C...Presentation by University of British Columbia - Runner Ups in the CBS Case C...
Presentation by University of British Columbia - Runner Ups in the CBS Case C...
 
H&m
H&mH&m
H&m
 
Enterprise 2.0 - Modelli organizzativi e gestione dei social media in azienda
Enterprise 2.0 - Modelli organizzativi e gestione dei social media in aziendaEnterprise 2.0 - Modelli organizzativi e gestione dei social media in azienda
Enterprise 2.0 - Modelli organizzativi e gestione dei social media in azienda
 
Big data, new epistemologies and paradigm shifts
Big data, new epistemologies and paradigm shiftsBig data, new epistemologies and paradigm shifts
Big data, new epistemologies and paradigm shifts
 
H&M
H&MH&M
H&M
 
LTE Vs. 3G
LTE Vs. 3GLTE Vs. 3G
LTE Vs. 3G
 

Similar to H&M Eng q3 rapport 2015

Mid term exam1
Mid term exam1Mid term exam1
Mid term exam1Bakryk
 
IRI's Weekly FMCG News Update - w/c 23rd January 2017
IRI's Weekly FMCG News Update  - w/c 23rd January 2017IRI's Weekly FMCG News Update  - w/c 23rd January 2017
IRI's Weekly FMCG News Update - w/c 23rd January 2017Rūta Misiūnaitė
 
Deutsche EuroShop | Annual Report 2013
Deutsche EuroShop | Annual Report 2013Deutsche EuroShop | Annual Report 2013
Deutsche EuroShop | Annual Report 2013Deutsche EuroShop AG
 
Aegon annual report 2015
Aegon annual report 2015Aegon annual report 2015
Aegon annual report 2015Aegon
 
supermarket results
supermarket resultssupermarket results
supermarket resultsIvonaPoyntz
 
Ernst&Young Luxury factbook-2015
Ernst&Young Luxury factbook-2015Ernst&Young Luxury factbook-2015
Ernst&Young Luxury factbook-2015Umberto Tessitore
 
Banco Santander delivers on its targets and earns EUR 5.966 million (+3%), wi...
Banco Santander delivers on its targets and earns EUR 5.966 million (+3%), wi...Banco Santander delivers on its targets and earns EUR 5.966 million (+3%), wi...
Banco Santander delivers on its targets and earns EUR 5.966 million (+3%), wi...BANCO SANTANDER
 
Deutsche EuroShop | Annual Report 2017
Deutsche EuroShop | Annual Report 2017Deutsche EuroShop | Annual Report 2017
Deutsche EuroShop | Annual Report 2017Deutsche EuroShop AG
 
Product Media Magazine: March - April 2017
Product Media Magazine: March - April 2017Product Media Magazine: March - April 2017
Product Media Magazine: March - April 2017The BPMA
 
H&M The Challenges of Global Expansion and the Move to adopt Intern.pdf
H&M The Challenges of Global Expansion and the Move to adopt Intern.pdfH&M The Challenges of Global Expansion and the Move to adopt Intern.pdf
H&M The Challenges of Global Expansion and the Move to adopt Intern.pdffazanmobiles
 
IRI's weekly news update - w/c 5th June 2017
IRI's weekly news update - w/c 5th June 2017IRI's weekly news update - w/c 5th June 2017
IRI's weekly news update - w/c 5th June 2017Rūta Misiūnaitė
 
Wessanen H1 and Q2 2015 results
Wessanen H1 and Q2 2015 resultsWessanen H1 and Q2 2015 results
Wessanen H1 and Q2 2015 resultsKlaus Arntz
 
Santander made ordinary profit of EUR 3.426 billion, a 24% increase
Santander made ordinary profit of EUR 3.426 billion, a 24% increase Santander made ordinary profit of EUR 3.426 billion, a 24% increase
Santander made ordinary profit of EUR 3.426 billion, a 24% increase BANCO SANTANDER
 
Deutsche EuroShop | Half-Year Financial Report 2022
Deutsche EuroShop | Half-Year Financial Report 2022Deutsche EuroShop | Half-Year Financial Report 2022
Deutsche EuroShop | Half-Year Financial Report 2022Deutsche EuroShop AG
 
Deutsche EuroShop | Interim Report H1 2015
Deutsche EuroShop | Interim Report H1 2015Deutsche EuroShop | Interim Report H1 2015
Deutsche EuroShop | Interim Report H1 2015Deutsche EuroShop AG
 
ENDLESS magazine 2015_Vol 4
ENDLESS magazine 2015_Vol 4ENDLESS magazine 2015_Vol 4
ENDLESS magazine 2015_Vol 4Steen L. Laursen
 
160216 investor-presentation-final pacific
160216 investor-presentation-final pacific160216 investor-presentation-final pacific
160216 investor-presentation-final pacificArzish Baaquie
 

Similar to H&M Eng q3 rapport 2015 (20)

Mid term exam1
Mid term exam1Mid term exam1
Mid term exam1
 
Ppt h&m
Ppt h&mPpt h&m
Ppt h&m
 
IRI's Weekly FMCG News Update - w/c 23rd January 2017
IRI's Weekly FMCG News Update  - w/c 23rd January 2017IRI's Weekly FMCG News Update  - w/c 23rd January 2017
IRI's Weekly FMCG News Update - w/c 23rd January 2017
 
Deutsche EuroShop | Annual Report 2013
Deutsche EuroShop | Annual Report 2013Deutsche EuroShop | Annual Report 2013
Deutsche EuroShop | Annual Report 2013
 
Aegon annual report 2015
Aegon annual report 2015Aegon annual report 2015
Aegon annual report 2015
 
supermarket results
supermarket resultssupermarket results
supermarket results
 
Ernst&Young Luxury factbook-2015
Ernst&Young Luxury factbook-2015Ernst&Young Luxury factbook-2015
Ernst&Young Luxury factbook-2015
 
20140220 ref gp bpk v12 eng 1
20140220 ref gp bpk v12 eng 120140220 ref gp bpk v12 eng 1
20140220 ref gp bpk v12 eng 1
 
Banco Santander delivers on its targets and earns EUR 5.966 million (+3%), wi...
Banco Santander delivers on its targets and earns EUR 5.966 million (+3%), wi...Banco Santander delivers on its targets and earns EUR 5.966 million (+3%), wi...
Banco Santander delivers on its targets and earns EUR 5.966 million (+3%), wi...
 
Deutsche EuroShop | Annual Report 2017
Deutsche EuroShop | Annual Report 2017Deutsche EuroShop | Annual Report 2017
Deutsche EuroShop | Annual Report 2017
 
Product Media Magazine: March - April 2017
Product Media Magazine: March - April 2017Product Media Magazine: March - April 2017
Product Media Magazine: March - April 2017
 
H&M The Challenges of Global Expansion and the Move to adopt Intern.pdf
H&M The Challenges of Global Expansion and the Move to adopt Intern.pdfH&M The Challenges of Global Expansion and the Move to adopt Intern.pdf
H&M The Challenges of Global Expansion and the Move to adopt Intern.pdf
 
IRI's weekly news update - w/c 5th June 2017
IRI's weekly news update - w/c 5th June 2017IRI's weekly news update - w/c 5th June 2017
IRI's weekly news update - w/c 5th June 2017
 
Deutsche EuroShop | Magazine 2020
Deutsche EuroShop | Magazine 2020Deutsche EuroShop | Magazine 2020
Deutsche EuroShop | Magazine 2020
 
Wessanen H1 and Q2 2015 results
Wessanen H1 and Q2 2015 resultsWessanen H1 and Q2 2015 results
Wessanen H1 and Q2 2015 results
 
Santander made ordinary profit of EUR 3.426 billion, a 24% increase
Santander made ordinary profit of EUR 3.426 billion, a 24% increase Santander made ordinary profit of EUR 3.426 billion, a 24% increase
Santander made ordinary profit of EUR 3.426 billion, a 24% increase
 
Deutsche EuroShop | Half-Year Financial Report 2022
Deutsche EuroShop | Half-Year Financial Report 2022Deutsche EuroShop | Half-Year Financial Report 2022
Deutsche EuroShop | Half-Year Financial Report 2022
 
Deutsche EuroShop | Interim Report H1 2015
Deutsche EuroShop | Interim Report H1 2015Deutsche EuroShop | Interim Report H1 2015
Deutsche EuroShop | Interim Report H1 2015
 
ENDLESS magazine 2015_Vol 4
ENDLESS magazine 2015_Vol 4ENDLESS magazine 2015_Vol 4
ENDLESS magazine 2015_Vol 4
 
160216 investor-presentation-final pacific
160216 investor-presentation-final pacific160216 investor-presentation-final pacific
160216 investor-presentation-final pacific
 

Recently uploaded

Appkodes Tinder Clone Script with Customisable Solutions.pptx
Appkodes Tinder Clone Script with Customisable Solutions.pptxAppkodes Tinder Clone Script with Customisable Solutions.pptx
Appkodes Tinder Clone Script with Customisable Solutions.pptxappkodes
 
Welding Electrode Making Machine By Deccan Dynamics
Welding Electrode Making Machine By Deccan DynamicsWelding Electrode Making Machine By Deccan Dynamics
Welding Electrode Making Machine By Deccan DynamicsIndiaMART InterMESH Limited
 
business environment micro environment macro environment.pptx
business environment micro environment macro environment.pptxbusiness environment micro environment macro environment.pptx
business environment micro environment macro environment.pptxShruti Mittal
 
Darshan Hiranandani [News About Next CEO].pdf
Darshan Hiranandani [News About Next CEO].pdfDarshan Hiranandani [News About Next CEO].pdf
Darshan Hiranandani [News About Next CEO].pdfShashank Mehta
 
Effective Strategies for Maximizing Your Profit When Selling Gold Jewelry
Effective Strategies for Maximizing Your Profit When Selling Gold JewelryEffective Strategies for Maximizing Your Profit When Selling Gold Jewelry
Effective Strategies for Maximizing Your Profit When Selling Gold JewelryWhittensFineJewelry1
 
NAB Show Exhibitor List 2024 - Exhibitors Data
NAB Show Exhibitor List 2024 - Exhibitors DataNAB Show Exhibitor List 2024 - Exhibitors Data
NAB Show Exhibitor List 2024 - Exhibitors DataExhibitors Data
 
Psychic Reading | Spiritual Guidance – Astro Ganesh Ji
Psychic Reading | Spiritual Guidance – Astro Ganesh JiPsychic Reading | Spiritual Guidance – Astro Ganesh Ji
Psychic Reading | Spiritual Guidance – Astro Ganesh Jiastral oracle
 
Strategic Project Finance Essentials: A Project Manager’s Guide to Financial ...
Strategic Project Finance Essentials: A Project Manager’s Guide to Financial ...Strategic Project Finance Essentials: A Project Manager’s Guide to Financial ...
Strategic Project Finance Essentials: A Project Manager’s Guide to Financial ...Aggregage
 
14680-51-4.pdf Good quality CAS Good quality CAS
14680-51-4.pdf  Good  quality CAS Good  quality CAS14680-51-4.pdf  Good  quality CAS Good  quality CAS
14680-51-4.pdf Good quality CAS Good quality CAScathy664059
 
Cyber Security Training in Office Environment
Cyber Security Training in Office EnvironmentCyber Security Training in Office Environment
Cyber Security Training in Office Environmentelijahj01012
 
20220816-EthicsGrade_Scorecard-JP_Morgan_Chase-Q2-63_57.pdf
20220816-EthicsGrade_Scorecard-JP_Morgan_Chase-Q2-63_57.pdf20220816-EthicsGrade_Scorecard-JP_Morgan_Chase-Q2-63_57.pdf
20220816-EthicsGrade_Scorecard-JP_Morgan_Chase-Q2-63_57.pdfChris Skinner
 
TriStar Gold Corporate Presentation - April 2024
TriStar Gold Corporate Presentation - April 2024TriStar Gold Corporate Presentation - April 2024
TriStar Gold Corporate Presentation - April 2024Adnet Communications
 
digital marketing , introduction of digital marketing
digital marketing , introduction of digital marketingdigital marketing , introduction of digital marketing
digital marketing , introduction of digital marketingrajputmeenakshi733
 
How Generative AI Is Transforming Your Business | Byond Growth Insights | Apr...
How Generative AI Is Transforming Your Business | Byond Growth Insights | Apr...How Generative AI Is Transforming Your Business | Byond Growth Insights | Apr...
How Generative AI Is Transforming Your Business | Byond Growth Insights | Apr...Hector Del Castillo, CPM, CPMM
 
PSCC - Capability Statement Presentation
PSCC - Capability Statement PresentationPSCC - Capability Statement Presentation
PSCC - Capability Statement PresentationAnamaria Contreras
 
WSMM Technology February.March Newsletter_vF.pdf
WSMM Technology February.March Newsletter_vF.pdfWSMM Technology February.March Newsletter_vF.pdf
WSMM Technology February.March Newsletter_vF.pdfJamesConcepcion7
 
WSMM Media and Entertainment Feb_March_Final.pdf
WSMM Media and Entertainment Feb_March_Final.pdfWSMM Media and Entertainment Feb_March_Final.pdf
WSMM Media and Entertainment Feb_March_Final.pdfJamesConcepcion7
 
Data Analytics Strategy Toolkit and Templates
Data Analytics Strategy Toolkit and TemplatesData Analytics Strategy Toolkit and Templates
Data Analytics Strategy Toolkit and TemplatesAurelien Domont, MBA
 
Driving Business Impact for PMs with Jon Harmer
Driving Business Impact for PMs with Jon HarmerDriving Business Impact for PMs with Jon Harmer
Driving Business Impact for PMs with Jon HarmerAggregage
 

Recently uploaded (20)

Appkodes Tinder Clone Script with Customisable Solutions.pptx
Appkodes Tinder Clone Script with Customisable Solutions.pptxAppkodes Tinder Clone Script with Customisable Solutions.pptx
Appkodes Tinder Clone Script with Customisable Solutions.pptx
 
Welding Electrode Making Machine By Deccan Dynamics
Welding Electrode Making Machine By Deccan DynamicsWelding Electrode Making Machine By Deccan Dynamics
Welding Electrode Making Machine By Deccan Dynamics
 
business environment micro environment macro environment.pptx
business environment micro environment macro environment.pptxbusiness environment micro environment macro environment.pptx
business environment micro environment macro environment.pptx
 
Darshan Hiranandani [News About Next CEO].pdf
Darshan Hiranandani [News About Next CEO].pdfDarshan Hiranandani [News About Next CEO].pdf
Darshan Hiranandani [News About Next CEO].pdf
 
Effective Strategies for Maximizing Your Profit When Selling Gold Jewelry
Effective Strategies for Maximizing Your Profit When Selling Gold JewelryEffective Strategies for Maximizing Your Profit When Selling Gold Jewelry
Effective Strategies for Maximizing Your Profit When Selling Gold Jewelry
 
NAB Show Exhibitor List 2024 - Exhibitors Data
NAB Show Exhibitor List 2024 - Exhibitors DataNAB Show Exhibitor List 2024 - Exhibitors Data
NAB Show Exhibitor List 2024 - Exhibitors Data
 
The Bizz Quiz-E-Summit-E-Cell-IITPatna.pptx
The Bizz Quiz-E-Summit-E-Cell-IITPatna.pptxThe Bizz Quiz-E-Summit-E-Cell-IITPatna.pptx
The Bizz Quiz-E-Summit-E-Cell-IITPatna.pptx
 
Psychic Reading | Spiritual Guidance – Astro Ganesh Ji
Psychic Reading | Spiritual Guidance – Astro Ganesh JiPsychic Reading | Spiritual Guidance – Astro Ganesh Ji
Psychic Reading | Spiritual Guidance – Astro Ganesh Ji
 
Strategic Project Finance Essentials: A Project Manager’s Guide to Financial ...
Strategic Project Finance Essentials: A Project Manager’s Guide to Financial ...Strategic Project Finance Essentials: A Project Manager’s Guide to Financial ...
Strategic Project Finance Essentials: A Project Manager’s Guide to Financial ...
 
14680-51-4.pdf Good quality CAS Good quality CAS
14680-51-4.pdf  Good  quality CAS Good  quality CAS14680-51-4.pdf  Good  quality CAS Good  quality CAS
14680-51-4.pdf Good quality CAS Good quality CAS
 
Cyber Security Training in Office Environment
Cyber Security Training in Office EnvironmentCyber Security Training in Office Environment
Cyber Security Training in Office Environment
 
20220816-EthicsGrade_Scorecard-JP_Morgan_Chase-Q2-63_57.pdf
20220816-EthicsGrade_Scorecard-JP_Morgan_Chase-Q2-63_57.pdf20220816-EthicsGrade_Scorecard-JP_Morgan_Chase-Q2-63_57.pdf
20220816-EthicsGrade_Scorecard-JP_Morgan_Chase-Q2-63_57.pdf
 
TriStar Gold Corporate Presentation - April 2024
TriStar Gold Corporate Presentation - April 2024TriStar Gold Corporate Presentation - April 2024
TriStar Gold Corporate Presentation - April 2024
 
digital marketing , introduction of digital marketing
digital marketing , introduction of digital marketingdigital marketing , introduction of digital marketing
digital marketing , introduction of digital marketing
 
How Generative AI Is Transforming Your Business | Byond Growth Insights | Apr...
How Generative AI Is Transforming Your Business | Byond Growth Insights | Apr...How Generative AI Is Transforming Your Business | Byond Growth Insights | Apr...
How Generative AI Is Transforming Your Business | Byond Growth Insights | Apr...
 
PSCC - Capability Statement Presentation
PSCC - Capability Statement PresentationPSCC - Capability Statement Presentation
PSCC - Capability Statement Presentation
 
WSMM Technology February.March Newsletter_vF.pdf
WSMM Technology February.March Newsletter_vF.pdfWSMM Technology February.March Newsletter_vF.pdf
WSMM Technology February.March Newsletter_vF.pdf
 
WSMM Media and Entertainment Feb_March_Final.pdf
WSMM Media and Entertainment Feb_March_Final.pdfWSMM Media and Entertainment Feb_March_Final.pdf
WSMM Media and Entertainment Feb_March_Final.pdf
 
Data Analytics Strategy Toolkit and Templates
Data Analytics Strategy Toolkit and TemplatesData Analytics Strategy Toolkit and Templates
Data Analytics Strategy Toolkit and Templates
 
Driving Business Impact for PMs with Jon Harmer
Driving Business Impact for PMs with Jon HarmerDriving Business Impact for PMs with Jon Harmer
Driving Business Impact for PMs with Jon Harmer
 

H&M Eng q3 rapport 2015

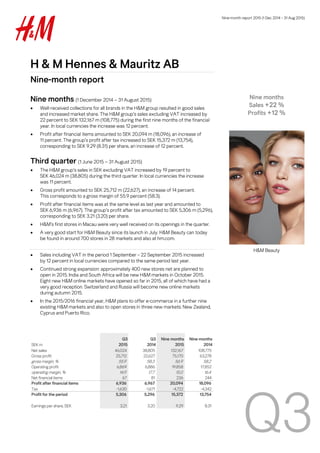
  • 1. Nine-month report 2015 (1 Dec 2014 – 31 Aug 2015) Q3 H & M Hennes & Mauritz AB Nine-month report Nine months (1 December 2014 — 31 August 2015)  Well-received collections for all brands in the H&M group resulted in good sales and increased market share. The H&M group’s sales excluding VAT increased by 22 percent to SEK 132,167 m (108,775) during the first nine months of the financial year. In local currencies the increase was 12 percent.  Profit after financial items amounted to SEK 20,094 m (18,096), an increase of 11 percent. The group’s profit after tax increased to SEK 15,372 m (13,754), corresponding to SEK 9.29 (8.31) per share, an increase of 12 percent. Third quarter (1 June 2015 — 31 August 2015)  The H&M group’s sales in SEK excluding VAT increased by 19 percent to SEK 46,024 m (38,805) during the third quarter. In local currencies the increase was 11 percent.  Gross profit amounted to SEK 25,712 m (22,627), an increase of 14 percent. This corresponds to a gross margin of 55.9 percent (58.3).  Profit after financial items was at the same level as last year and amounted to SEK 6,936 m (6,967). The group’s profit after tax amounted to SEK 5,306 m (5,296), corresponding to SEK 3.21 (3.20) per share.  H&M’s first stores in Macau were very well received on its openings in the quarter.  A very good start for H&M Beauty since its launch in July. H&M Beauty can today be found in around 700 stores in 28 markets and also at hm.com.  Sales including VAT in the period 1 September – 22 September 2015 increased by 12 percent in local currencies compared to the same period last year.  Continued strong expansion: approximately 400 new stores net are planned to open in 2015. India and South Africa will be new H&M markets in October 2015. Eight new H&M online markets have opened so far in 2015, all of which have had a very good reception. Switzerland and Russia will become new online markets during autumn 2015.  In the 2015/2016 financial year, H&M plans to offer e-commerce in a further nine existing H&M markets and also to open stores in three new markets: New Zealand, Cyprus and Puerto Rico. SEK m Q3 2015 Q3 2014 Nine months 2015 Nine months 2014 Net sales 46,024 38,805 132,167 108,775 Gross profit 25,712 22,627 75,170 63,278 gross margin, % 55.9 58.3 56.9 58.2 Operating profit 6,869 6,886 19,858 17,852 operating margin, % 14.9 17.7 15.0 16.4 Net financial items 67 81 236 244 Profit after financial items 6,936 6,967 20,094 18,096 Tax -1,630 -1,671 -4,722 -4,342 Profit for the period 5,306 5,296 15,372 13,754 Earnings per share, SEK 3.21 3.20 9.29 8.31 Nine months Sales +22 % Profits +12 % H&M Beauty
  • 2. Nine-month report 2015 (1 Dec 2014 - 31 Aug 2015) 2 Comments by Karl-Johan Persson, CEO “So far this year our sales have exceeded SEK 153 billion including VAT, an increase of more than 20 percent – an acknowledgement that our collections are well appreciated worldwide. Sales were also good in the third quarter even though sales in August were negatively affected by the unseasonably warm weather in many of our large European markets. When the weather became more normal in September, sales took off again and we are looking forward to an exciting fashion autumn. Profits have developed well during the first nine months of the year, although profits in the third quarter were negatively affected by increased purchasing costs due to the strong US dollar. As always, we are reviewing our customer offering in each market and we are monitoring the market closely to ensure that we offer the best combination of fashion, quality, price and sustainability. We are also strengthening our offering by continuously developing and improving our range even further. For example, our new concept H&M Beauty was launched during the summer. H&M Beauty has enjoyed a very good start in around 700 stores in 28 markets as well as online. We are now continuing the roll-out to a further 14 markets during the autumn. We are also looking into launching other new concepts and brands; we will come back to this at a later date. Our online roll-out to new countries is continuing according to plan. We will open our H&M online store in both Switzerland and Russia during this autumn, giving us 23 H&M online markets at the end of the financial year. In 2016 we plan to offer e-commerce in a further nine existing H&M markets. These countries will be Ireland, Japan, Greece, Croatia, Slovenia, Estonia, Latvia, Lithuania and Luxembourg. In parallel with our rapid online expansion we are also opening stores at a fast pace. In the fourth quarter we will open approximately 240 new stores net – which is almost three new stores per day. India and South Africa will become two new and exciting H&M countries this autumn, when we open our first store in New Delhi next week and in Cape Town later on in October. Next year, we plan to open stores in three new markets: New Zealand, Cyprus and Puerto Rico. Our other brands are performing well and are continuing to reach out to more and more customers. For example, COS now has around 130 stores across 27 markets, Monki more than 90 stores in 13 markets, & Other Stories 25 stores in 10 markets and Weekday 20 stores in five markets. There is also much going on within our sustainability work. Our strategy for Fair Living Wages, which we are working on together with other big buyers in our purchasing countries, is showing good progress and now more and more of our suppliers will start using the Fair Wage method to achieve fairer wage setting for their employees. In addition, thanks to the commitment of our customers we have now collected almost 20,000 tonnes of garments for re-use and recycling since 2013. Some of these have been turned into brand new clothing, most recently into some great denim pieces currently in our stores. Through the H&M Conscious Foundation, which works on issues of concern, we contribute humanitarian support in countries where H&M operates. Alongside this the foundation has established a new prize, the Global Change Award, which encourages innovation in the textile industry. The aim is to develop new processes that enable used garments to be recycled on a larger scale, which we hope will lead our industry towards a more circular economy.” Global Change Award “We are very proud that our customers have so far handed in almost 20,000 tonnes of garments to our stores. In order to find the best ideas for how to close the loop for textiles the H&M Conscious Foundation has established a prize, the Global Change Award, to create a real game changer for the industry.”
  • 3. Nine-month report 2015 (1 Dec 2014 - 31 Aug 2015) 3 Sales Well-received collections for all brands and continued strong expansion led to increased sales and continued market share gains for the H&M group in a fashion retail market that in many countries was still characterised by a challenging macroeconomic situation. Sales in the third quarter were strong in June and July, but in August sales were negatively affected by the unseasonably warm weather in many of the H&M group’s large European markets. Sales including VAT converted into SEK increased by 18 percent to SEK 53,420 m (45,259) in the third quarter. Sales including VAT in the nine-month period increased by 21 percent and amounted to SEK 153,444 m (126,964). Sales excluding VAT increased by 19 percent to SEK 46,024 m (38,805) in the third quarter and by 22 percent to SEK 132,167 m (108,775) in the nine-month period. In local currencies sales including VAT increased by 11 percent in the third quarter and by 12 percent in the nine-month period. The substantial difference between the sales increase in SEK and in local currencies is due to the weakness of the Swedish krona against most sales currencies in the group compared to the same period last year. Currency translation effects arise when sales in local currencies are translated into the company’s reporting currency, SEK. A positive currency translation effect arises when the Swedish krona weakens and a negative currency translation effect arises if the Swedish krona strengthens. Sales in top ten markets, nine months 45,259 126,964 53,420 153,444 + 18% + 21% 0 50,000 100,000 150,000 200,000 Q3 Nine months SEK m incl VAT 2014 2015 2015 2014 31 Aug - 15 2015 SEK m Inc. VAT SEK m Inc. VAT SEK Local currency Number of stores New stores (net) Germany 27,204 25,557 6 2 447 7 USA 18,358 11,975 53 22 381 25 United Kingdom 11,595 9,180 26 9 254 1 France 10,043 8,952 12 8 213 8 China 7,732 5,117 51 21 299 29 Sweden 6,974 6,597 6 6 172 -4 Italy 6,193 4,994 24 19 138 6 Spain 5,711 4,917 16 12 161 2 Netherlands 5,484 5,344 3 -1 136 1 Switzerland 5,118 4,336 18 0 96 3 Others* 49,032 39,995 23 17 1,378 86 Total 153,444 126,964 21 12 3,675 164 * Whereof franchise 3,287 2,140 54 28 141 11 Change in % H&M Ladies
  • 4. Nine-month report 2015 (1 Dec 2014 - 31 Aug 2015) 4 Gross profit and gross margin H&M’s gross profit and gross margin are a result of many different factors, internal as well as external, and are also affected by the decisions that H&M takes in line with its strategy to always have the best customer offering in each individual market – based on the combination of fashion, quality, price and sustainability. Gross profit increased by 14 percent to SEK 25,712 m (22,627) in the third quarter, corresponding to a gross margin of 55.9 percent (58.3). For the nine-month period, gross profit increased by 19 percent to SEK 75,170 m (63,278), corresponding to a gross margin of 56.9 percent (58.2). Markdowns in relation to sales increased by 0.3 percentage points in the third quarter 2015 compared to the corresponding quarter in 2014, mostly due to increased price activities in August. Overall, the market situation as regards external factors such as raw material prices, cost inflation, capacity at suppliers, purchasing currencies and transportation costs has continued to be negative during the purchasing period for the third quarter compared to the corresponding purchasing period the previous year, mostly due to the stronger US dollar. Since the US dollar strengthened further during the purchasing period for the fourth quarter, the purchasing costs for the fourth quarter have continued to be negatively affected. 22,627 25,712 63,278 75,170 58.3% 55.9% 58.2% 56.9% 30% 35% 40% 45% 50% 55% 60% 0 10,000 20,000 30,000 40,000 50,000 60,000 70,000 80,000 Gross profit SEK m Q3 Nine months Gross profit SEK m Q3 Nine months 2014 2015 H&M Sport
  • 5. Nine-month report 2015 (1 Dec 2014 - 31 Aug 2015) 5 Selling and administration expenses Cost control in the group remains good. For the third quarter in 2015, the selling and administrative expenses increased by 20 percent in SEK and 12 percent in local currencies compared to the third quarter last year. The increase is mainly due to the expansion and the long-term investments within IT and online, and to the broadening of the product range. Profit after financial items Profit after financial items amounted to SEK 20,094 m (18,096), in the nine-month period which is an increase of 11 percent. Profit after financial items in the third quarter was at the same level as last year and amounted to SEK 6,936 m (6,967). Profits in the third quarter were negatively affected mostly by the effect of the strong US dollar on purchasing costs and by the unseasonably warm weather in August in many European markets, which led to weaker sales and increased markdowns. Costs for long-term investments were also higher than in the corresponding period last year. These long-term investments aim to further strengthen the H&M group’s market position and secure future expansion. The investments continue and will be at a higher level in 2015 than in 2014, and the costs of these investments may be divided unequally between the quarters. 15,741 45,426 18,843 55,312 + 20% + 22% 0 10,000 20,000 30,000 40,000 50,000 60,000 Q3 Nine months SEK m 2014 2015 6,967 18,096 6,936 20,094 0% + 11% 0 5,000 10,000 15,000 20,000 25,000 Q3 Nine months SEK m 2014 2015 H&M Man
  • 6. Nine-month report 2015 (1 Dec 2014 - 31 Aug 2015) 6 Stock-in-trade Stock-in-trade amounted to SEK 25,205 m (17,940), an increase of 40 percent in SEK and 38 percent in local currencies compared to the same time the previous year. Although the reported increase in the stock-in-trade is high, both the level and the composition of the stock-in-trade are considered to be good with a higher proportion of new garments compared to the same time last year. The increase in the stock-in-trade is mostly due to the strengthening of the US dollar, which affected purchasing costs and thus the value of the stock, but also to the store and online expansion. The increase is also due to the previously communicated change in the administrative process surrounding invoice management for goods purchasing as part of the work to streamline and simplify this process. In the new process invoices for goods purchases are posted earlier, which means that the size of the reported stock-in-trade and accounts payable will increase with effect from the third quarter 2015. This bookkeeping effect has led to an increase of the reported stock-in-trade by approximately SEK 1,200 m as of 31 August 2015 compared to the same time last year. For the same reason, accounts payable have increased by the same amount. The stock-in-trade amounted to 14.4 percent (12.3) of sales excluding VAT, rolling 12 months and 31.1 percent (26.5) of total assets. Expansion H&M remains positive as regards future expansion and the group’s business opportunities. The strong expansion continues both through stores and online. H&M’s growth target remains intact. The aim is to increase the number of stores by 10–15 percent per year with continued high profitability. For the full-year 2015 a net addition of around 400 new stores is planned. China and USA will be the largest expansion markets for H&M in 2015. There are also still great opportunities for expansion in other existing markets as well as in new markets. Five new H&M markets are being added in 2015. The first H&M stores in Taipei, Taiwan in February, in Lima, Peru in May and in Macau in June have all been very successful. The other new H&M markets, India and South Africa, are planned to open in October 2015. The first H&M store in India will open in New Delhi and the first in South Africa will open in Cape Town. H&M plans to open stores in three new markets during the 2015/2016 financial year: New Zealand, Cyprus and Puerto Rico. The global rollout of H&M’s online store continues. So far in 2015 H&M has opened eight new online markets: Portugal, Poland, the Czech Republic, Romania, Slovakia, Hungary, Bulgaria and Belgium. Switzerland and Russia will become new online markets during autumn 2015. 17,940 25,205 + 40% 0 5,000 10,000 15,000 20,000 25,000 30,000 31 Aug SEK m 2014 2015 & Other Stories in Aarhus in Denmark
  • 7. Nine-month report 2015 (1 Dec 2014 - 31 Aug 2015) 7 During 2016 H&M plans to offer e-commerce in a further nine of H&M’s existing markets. These countries are Ireland, Japan, Greece, Croatia, Slovenia, Estonia, Latvia, Lithuania and Luxembourg. Expansion continues for the group’s other brands: COS, Monki, Weekday, Cheap Monday and & Other Stories. The main focus of this expansion is on COS and & Other Stories, which will open more stores in 2015 than in 2014. COS will open in four new markets this year. In February a COS franchise store opened in Bahrain. This autumn will see the opening of the first COS stores in Luxembourg, in Budapest in Hungary and in Toronto and Montreal in Canada. The first COS store in the Czech Republic is planned to open in Prague in spring 2016. H&M Home is also continuing its rapid expansion, with around a hundred new H&M Home departments and 10 new H&M Home markets in 2015. Examples of ongoing long-term investments in broadening H&M’s product range include H&M Sport, H&M Beauty and the extended shoe range. H&M Beauty has got off to a very good start since its launch began in July. H&M Beauty is now available in around 700 stores in 28 H&M markets, as well as online. H&M Beauty is a new and broad concept for make-up, body care and hair care, which offers high quality value-for-money products in a specially produced design. The launch of H&M Beauty – which will replace H&M’s current cosmetics – will continue during autumn 2015. By the end of the financial year H&M Beauty will be available in a total of around 900 H&M stores in 42 markets, as well as online at hm.com. Store count by brand In the nine-month period, the group opened 206 (245) stores and closed 42 (36) stores, i.e. a net increase of 164 (209) new stores. The group had 3,675 (3,341) stores as of 31 August 2015, of which 141 were franchise stores. Store count by region Current quarter Sales including VAT in the period 1 September – 22 September 2015 increased by 12 percent in local currencies compared to the same period last year. Brand Q3 Nine months 2015 2014 H&M 33 142 3,403 3,118 COS 5 14 128 97 Monki -2 2 94 90 Weekday -1 -2 20 21 & Other Stories 1 8 25 10 Cheap Monday 0 0 5 5 Total 36 164 3,675 3,341 New Stores 2015 (Net) Total No of stores (31 Aug) Region Q3 Nine months 2015 2014 Europe 5 69 2,617 2,468 Asia & Oceania 16 58 586 468 North & South America 15 37 472 405 Total 36 164 3,675 3,341 New Stores 2015 (Net) Total No of stores (31 Aug) H&M Beauty
  • 8. Nine-month report 2015 (1 Dec 2014 - 31 Aug 2015) 8 Tax The H&M group’s tax rate is expected to be approximately 22.5 – 23.5 percent for the financial year of 2014/2015. In the first, second and third quarters an estimated tax rate of 23.5 percent has been used. The final outcome of the tax rate for the year depends on the results of the group’s various companies and the corporate tax rates in each country. Accounting principles The group applies International Financial Reporting Standards (IFRS) as adopted by the EU. This report has been prepared according to IAS 34 Interim Financial Reporting as well as the Swedish Annual Accounts Act. The accounting principles and calculation methods applied in this report are unchanged from those used in the preparation of the annual report and consolidated financial statements for 2013/2014 which are described in Note 1 – Accounting principles. H & M Hennes & Mauritz AB’s financial instruments consist of accounts receivable, other receivables, cash and cash equivalents, accounts payable, accrued trade payables, interest-bearing securities and currency derivatives. Currency derivatives are measured at fair value based on input data corresponding to level 2 of IFRS 13. Other financial assets and liabilities have short terms. It is therefore judged that the fair values of these financial instruments are approximately equal to their book values. The parent company applies the Swedish Annual Accounts Act and the Swedish Financial Reporting Board’s recommendation RFR 2 Accounting for Legal Entities, which essentially involves applying IFRS. In accordance with RFR 2, the parent company does not apply IAS 39 to the measurement of financial instruments; nor does it capitalise development expenditure. For definitions see the Annual Report. Risks and uncertainties A number of factors may affect H&M’s results and business. Many of these can be dealt with through internal routines, while certain others are affected more by external influences. There are risks and uncertainties related to fashion, weather conditions, negative macro-economic changes, sustainability and external factors in production countries, trade interventions, foreign currency and tax but also in connection with expansion into new markets, the launch of new concepts, changes in consumer behaviour and how the brand is managed. There are also some risks related to the group’s reputation, so called “reputational risks”. For a more detailed description of risks and uncertainties, refer to the administration report and to note 2 in the annual report and consolidated accounts for 2014. Calendar 28 January 2016 Full-year report, 1 Dec 2014 – 30 November 2015 6 April 2016 Three-month report, 1 Dec 2015 – 29 February 2016 3 May 2016 Annual General Meeting 2016, Victoriahallen, Stockholm International Fairs at 3 p.m. Stockholm, 23 September 2015 Board of Directors
  • 9. Nine-month report 2015 (1 Dec 2014 - 31 Aug 2015) 9 Review report H & M Hennes & Mauritz AB (publ), corporate identity number 556042-7220 Introduction We have reviewed the interim report for H & M Hennes & Mauritz AB (publ) as of 31 August 2015 and for the nine-month period which ended on this date. It is the responsibility of the Board of Directors and the Chief Executive Officer to prepare and present this interim report in accordance with IAS 34 and the Swedish Annual Accounts Act. Our responsibility is to express an opinion on this interim report based on our review. Focus and scope of review We conducted our review in accordance with the International Standard on Review Engagements (ISRE 2410), Review of Interim Financial Information Performed by the Independent Auditor of the Entity. A review consists of making inquiries, primarily of persons responsible for financial and accounting matters, and applying analytical and other review procedures. A review has a different focus and is substantially less in scope compared with the focus and scope of an audit conducted in accordance with the International Standards on Auditing and the generally accepted auditing practices. The procedures performed in a review do not enable us to obtain a level of assurance that would make us aware of all significant matters that might be identified in an audit. Therefore, the opinion expressed based on a review does not provide the same level of assurance as an opinion expressed on the basis of an audit. Conclusion On the basis of our review, nothing has come to our attention that causes us to believe that the interim report, in all material aspects, was not prepared in accordance with IAS 34 and the Swedish Annual Accounts Act in the case of the group and in accordance with the Annual Accounts Act in the case of the parent company. Stockholm, 23 September 2015 Ernst & Young AB Åsa Lundvall Authorised Public Accountant The information in this interim report is that which H & M Hennes & Mauritz AB (publ) is required to disclose under Sweden’s Securities Market Act. It will be released for publication at 8.00 (CET) on 24 September 2015. This interim report, and other information about H&M, is available at www.hm.com Contact persons Nils Vinge, IR +46-8-796 52 50 Karl-Johan Persson, CEO +46-8-796 55 00 (switchboard) Jyrki Tervonen, CFO +46-8-796 55 00 (switchboard) H & M Hennes & Mauritz AB (publ) SE-106 38 Stockholm Phone: +46-8-796 55 00, Fax: +46-8-24 80 78, E-mail: info@hm.com Registered office: Stockholm, Reg. No. 556042-7220 H & M Hennes & Mauritz AB (publ) was founded in Sweden in 1947 and is quoted on Nasdaq Stockholm. H&M’s business idea is to offer fashion and quality at the best price in a sustainable way. In addition to H&M, the group includes the brands COS, Monki, Weekday, Cheap Monday, & Other Stories as well as H&M Home. The H&M group has more than 3,600 stores in 59 markets including franchise markets. In 2014, sales including VAT amounted to SEK 177 billion and the number of employees was more than 132,000. For further information, visit www.hm.com.
  • 10. Nine-month report 2015 (1 Dec 2014 – 31 Aug 2015) 10 GROUP INCOME STATEMENT (SEK m) Sales including VAT 53,420 45,259 153,444 126,964 176,620 Sales excluding VAT 46,024 38,805 132,167 108,775 151,419 Cost of goods sold -20,312 -16,178 -56,997 -45,497 -62,367 GROSS PROFIT 25,712 22,627 75,170 63,278 89,052 Gross margin, % 55.9 58.3 56.9 58.2 58.8 Selling expenses -17,371 -14,568 -50,953 -41,871 -58,525 Administrative expenses -1,472 -1,173 -4,359 -3,555 -4,944 OPERATING PROFIT 6,869 6,886 19,858 17,852 25,583 Operating margin, % 14.9 17.7 15.0 16.4 16.9 Interest income 71 84 242 250 328 Interest expense -4 -3 -6 -6 -16 PROFIT AFTER FINANCIAL ITEMS 6,936 6,967 20,094 18,096 25,895 Tax -1,630 -1,671 -4,722 -4,342 -5,919 PROFIT FOR THE PERIOD 5,306 5,296 15,372 13,754 19,976 All profit for the year is attributable to the shareholders of the parent company H & M Hennes & Mauritz AB. Earnings per share, SEK* 3.21 3.20 9.29 8.31 12.07 Number of shares, thousands* 1,655,072 1,655,072 1,655,072 1,655,072 1,655,072 Depreciation, total 1,588 1,231 4,708 3,709 5,045 of which cost of goods sold 176 139 533 417 568 of which selling expenses 1,310 1,015 3,872 3,061 4,159 of which administrative expenses 102 77 303 231 318 * Before and after dilution. CONSOLIDATED STATEMENT OF COMPREHENSIVE INCOME (SEK m) Q3 2015 Q3 2014 Nine months 2015 Nine months 2014 1 Dec 2013- 30 Nov 2014 PROFIT FOR THE PERIOD 5,306 5,296 15,372 13,754 19,976 Other comprehensive income Items that have been reclassified or may be reclassified to profit or loss Translation differences -450 866 1,414 1,323 1,979 Change in hedging reserves -72 -134 -217 -34 185 Tax attributable to change in hedging reserves 7 32 42 8 -44 Items that have not been and will not be reclassified to profit or loss Revaluations relating to defined benefit pension plans - - - - -148 Tax attributable to the above revaluation - - - - 35 OTHER COMPREHENSIVE INCOME -515 764 1,239 1,297 2,007 TOTAL COMPREHENSIVE INCOME FOR THE PERIOD 4,791 6,060 16,611 15,051 21,983 All comprehensive income is attributable to the shareholders of the parent company H & M Hennes & Mauritz AB. Q3 2015 Q3 2014 1 Dec 2013- 30 Nov 2014 Nine months 2015 Nine months 2014
  • 11. Nine-month report 2015 (1 Dec 2014 – 31 Aug 2015) 11 GROUP BALANCE SHEET IN SUMMARY (SEK m) ASSETS 31 Aug - 2015 31 Aug - 2014 30 Nov 2014 Fixed assets Intangible fixed assets 3,900 2,819 2,962 Tangible fixed assets 30,440 25,002 26,948 Financial assets 3,139 2,483 2,946 37,479 30,304 32,856 Current assets Stock-in-trade 25,205 17,940 19,403 Current receivables 7,374 6,031 6,645 Short-term investments, 4-12 months - - 2,602 Cash and cash equivalents 10,963 13,451 14,091 43,542 37,422 42,741 TOTAL ASSETS 81,021 67,726 75,597 EQUITY AND LIABILITIES Equity 52,030 44,576 51,556 Long-term liabilities* 3,965 3,324 3,738 Current liabilities** 25,026 19,826 20,303 TOTAL EQUITY AND LIABILITIES 81,021 67,726 75,597 * Only provisions for pensions are interest-bearing. ** No current liabilities are interest-bearing. CHANGE IN GROUP EQUITY IN SUMMARY (SEK m) 31 Aug - 2015 31 Aug - 2014 30 Nov 2014 Shareholders' equity at the beginning of the period 51,556 45,248 45,248 Total comprehensive income for the period 16,611 15,051 21,983 Overdue bonus share rights - - 48 Dividend -16,137 -15,723 -15,723 Shareholders' equity at the end of the period 52,030 44,576 51,556
  • 12. Nine-month report 2015 (1 Dec 2014 – 31 Aug 2015) 12 GROUP CASH FLOW STATEMENT (SEK m) Nine months 2015 Nine months 2014 Current operations Profit after financial items* 20,094 18,096 Provisions for pensions 59 35 Depreciation 4,708 3,709 Tax paid -4,639 -4,199 Cash flow from current operations before changes in working capital 20,222 17,641 Cash flow from changes in working capital Current receivables -622 -418 Stock-in-trade -5,434 -965 Current liabilities 3,647 1,749 CASH FLOW FROM CURRENT OPERATIONS 17,813 18,007 Investment activities Investment in intangible fixed assets -1,131 -687 Investment in tangible fixed assets -6,762 -5,661 Change in short-term investments, 4 - 12 months 2,673 3,306 Other investments -117 -47 CASH FLOW FROM INVESTMENT ACTIVITIES -5,337 -3,089 Financial activities Dividend -16,137 -15,723 CASH FLOW FROM FINANCIAL ACTIVITIES -16,137 -15,723 CASH FLOW FOR THE PERIOD -3,661 -805 Cash and cash equivalents at beginning of the financial year 14,091 13,918 Cash flow for the period -3,661 -805 Exchange rate effect 533 338 Cash and cash equivalents at end of the period** 10,963 13,451 * Interest paid for the group amounts to SEK 6 m (6). ** Cash and cash equivalents and short-term investments 4-12 months at the end of the period amounted to SEK 10,963 m (13,451).
  • 13. Nine-month report 2015 (1 Dec 2014 – 31 Aug 2015) 13 SALES INCLUDING VAT BY MARKET AND NUMBER OF STORES Q3, 1 June - 31 August Market Q3 - 2015 Q3 - 2014 31 Aug - 15 SEK m SEK m SEK Local currency No. of stores New stores Closed stores Sweden 2,469 2,302 7 7 172 5 Norway 1,592 1,532 4 9 117 1 Denmark 1,362 1,269 7 5 102 1 United Kingdom 4,104 3,402 21 5 254 4 3 Switzerland 1,786 1,522 17 0 96 Germany 9,056 8,742 4 1 447 1 1 Netherlands 1,842 1,840 0 -2 136 3 2 Belgium 1,117 1,033 8 5 81 Austria 1,309 1,295 1 -1 76 1 Luxembourg 111 109 2 0 10 Finland 744 710 5 2 60 1 France 3,566 3,205 11 9 213 2 USA 6,565 4,500 46 17 381 13 2 Spain 1,971 1,735 14 11 161 2 Poland 1,173 991 18 15 144 1 Czech Republic 310 257 21 16 44 Portugal 348 289 20 17 30 Italy 2,094 1,724 21 19 138 Canada 1,032 854 21 14 76 3 1 Slovenia 137 129 6 4 12 Ireland 252 207 22 19 21 Hungary 349 268 30 27 36 Slovakia 145 113 28 26 17 1 Greece 386 319 21 18 32 China 2,582 1,883 37 11 299 10 1 Hong Kong 423 362 17 -6 21 Japan 823 736 12 9 53 1 Russia 1,018 881 16 56 86 2 South Korea 300 241 24 8 26 2 Turkey 560 325 72 76 37 2 Romania 448 315 42 39 41 Croatia 211 199 6 2 14 Singapore 237 209 13 0 10 Bulgaria 140 104 35 31 16 Latvia 91 78 17 13 6 Malaysia 242 185 31 24 21 1 Mexico 271 134 102 99 13 2 Chile 132 91 45 36 1 Lithuania 86 69 25 21 7 Serbia 74 57 30 31 5 Estonia 95 61 56 51 6 Australia 270 146 85 81 6 1 Philippines 124 6 1 Taiwan 64 1 Peru 112 1 Macau 40 2 2 Franchise 1,257 836 50 27 141 3 2 Total 53,420 45,259 18 11 3,675 57 21 Change in % Q3 - 2015
  • 14. Nine-month report 2015 (1 Dec 2014 – 31 Aug 2015) 14 SALES INCLUDING VAT BY MARKET AND NUMBER OF STORES Nine months, 1 December - 31 August Market 2015 2014 31 Aug - 15 SEK m SEK m SEK Local currency No. of stores New stores Closed stores Sweden 6,974 6,597 6 6 172 2 6 Norway 4,357 4,183 4 6 117 1 Denmark 3,952 3,758 5 1 102 5 2 United Kingdom 11,595 9,180 26 9 254 5 4 Switzerland 5,118 4,336 18 0 96 3 Germany 27,204 25,557 6 2 447 12 5 Netherlands 5,484 5,344 3 -1 136 4 3 Belgium 3,134 2,888 9 4 81 4 1 Austria 3,904 3,784 3 -1 76 3 Luxembourg 315 309 2 -2 10 Finland 2,082 1,998 4 0 60 1 1 France 10,043 8,952 12 8 213 10 2 USA 18,358 11,975 53 22 381 28 3 Spain 5,711 4,917 16 12 161 7 5 Poland 3,220 2,741 17 12 144 4 Czech Republic 856 693 24 18 44 1 Portugal 955 802 19 14 30 Italy 6,193 4,994 24 19 138 6 Canada 2,796 2,156 30 17 76 5 1 Slovenia 387 358 8 4 12 Ireland 746 582 28 23 21 1 Hungary 961 750 28 24 36 1 Slovakia 407 309 32 27 17 2 Greece 1,195 939 27 22 32 2 China 7,732 5,117 51 21 299 32 3 Hong Kong 1,395 1,127 24 -2 21 Japan 2,697 2,364 14 7 53 4 2 Russia 2,629 2,283 15 52 86 15 South Korea 924 682 35 14 26 4 Turkey 1,517 843 80 71 37 7 Romania 1,274 864 47 41 41 3 Croatia 579 548 6 1 14 Singapore 737 589 25 7 10 Bulgaria 363 265 37 31 16 Latvia 228 173 32 26 6 Malaysia 747 475 57 40 21 3 Mexico 763 405 88 75 13 7 Chile 384 247 55 41 1 Lithuania 218 150 45 39 7 1 Serbia 231 156 48 48 5 Estonia 232 152 53 47 6 Australia 770 282 173 156 6 3 Philippines 405 6 3 Taiwan 188 1 1 Peru 157 1 1 Macau 40 2 2 Franchise 3,287 2,140 54 28 141 14 3 Total 153,444 126,964 21 12 3,675 206 42 Change in % Nine months
  • 15. Nine-month report 2015 (1 Dec 2014 – 31 Aug 2015) 15 FIVE YEAR SUMMARY Nine months, 1 December - 31 August 2011 2012 2013 2014 2015 Sales including VAT, SEK m 92,619 103,018 107,480 126,964 153,444 Sales excluding VAT, SEK m 79,047 88,297 92,067 108,775 132,167 Change from previous year in SEK, % 0 12 4 18 22 Change from previous year in local currencies, % 8 12 8 15 12 Operating profit, SEK m 13,714 15,221 14,908 17,852 19,858 Operating margin, % 17.3 17.2 16.2 16.4 15.0 Depreciation for the period, SEK m 2,465 2,761 3,106 3,709 4,708 Profit after financial items, SEK m 14,140 15,649 15,189 18,096 20,094 Profit after tax, SEK m 10,464 11,580 11,544 13,754 15,372 Cash and cash equivalents and short-term investments, SEK m 16,895 13,552 10,953 13,451 10,963 Stock-in-trade, SEK m 13,310 13,501 15,329 17,940 25,205 Equity, SEK m 38,214 38,275 39,203 44,576 52,030 Number of shares, thousands* 1,655,072 1,655,072 1,655,072 1,655,072 1,655,072 Earnings per share, SEK* 6.32 7.00 6.97 8.31 9.29 Shareholders' equity per share, SEK* 23.09 23.13 23.69 26.93 31.44 Cash flow from current operations per share, SEK* 6.78 7.88 9.05 10.88 10.76 Share of risk-bearing capital, % 72.9 74.0 73.4 70.2 68.5 Equity/assets ratio, % 71.4 72.3 69.9 65.8 64.2 Total number of stores 2,325 2,629 2,964 3,341 3,675 Rolling twelve months Earnings per share, SEK* 9.64 10.23 10.17 11.66 13.05 Return on shareholders' equity, % 41.1 44.3 43.4 46.1 44.7 Return on capital employed, % 54.6 58.2 55.8 60.0 57.3 * Before and after dilution. Definition on key figures see annual report.
  • 16. Nine-month report 2015 (1 Dec 2014 – 31 Aug 2015) 16 SEGMENT REPORTING (SEK m) Nine months 2015 Nine months 2014 Asia and Oceania External net sales 17,120 11,802 Operating profit 1,019 1,516 Operating margin, % 6.0 12.8 Europe External net sales 93,989 83,088 Operating profit 2,611 6,140 Operating margin, % 2.8 7.4 North and South America External net sales 21,058 13,885 Operating profit 763 91 Operating margin, % 3.6 0.7 Group Functions Net sales to other segments 57,366 48,111 Operating profit 15,465 10,105 Eliminations Net sales to other segments -57,366 -48,111 Total External net sales 132,167 108,775 Operating profit 19,858 17,852 Operating margin, % 15.0 16.4
  • 17. Nine-month report 2015 (1 Dec 2014 – 31 Aug 2015) 17 PARENT COMPANY INCOME STATEMENT (SEK m) Q3 2015** Q3 2014 Nine months 2015** Nine months 2014 1 Dec 2013- 30 Nov 2014 External sales excluding VAT - 6 2 10 47 Internal sales excluding VAT* 879 2,241 2,525 6,339 8,764 GROSS PROFIT 879 2,247 2,527 6,349 8,811 Selling expenses - -390 - -1,865 -2,982 Administrative expenses 7 -1,331 -50 -3,824 -5,316 OPERATING PROFIT 886 526 2,477 660 513 Dividend from subsidiaries 47 591 1,357 1,642 15,701 Interest income 11 6 28 42 59 Interest expense -5 -15 -7 -23 -25 PROFIT AFTER FINANCIAL ITEMS 939 1,108 3,855 2,321 16,248 Year-end appropriations - - - - -10 Tax -197 -113 -550 -149 -130 PROFIT FOR THE PERIOD 742 995 3,305 2,172 16,108 * Includes royalty received from group companies. PARENT COMPANY STATEMENT OF COMPREHENSIVE INCOME (SEK m) Q3 2015** Q3 2014 Nine months 2015** Nine months 2014 1 Dec 2013- 30 Nov 2014 PROFIT FOR THE PERIOD 742 995 3,305 2,172 16,108 Other comprehensive income Items that have not been and will not be reclassified to profit or loss Revaluations relating to defined benefit pension plans - - - - -24 Tax attributable to the above revaluation - - - - 5 OTHER COMPREHENSIVE INCOME - - - - -19 TOTAL COMPREHENSIVE INCOME FOR THE PERIOD 742 995 3,305 2,172 16,089 ** To simplify administration and internal follow-up, with effect from 1 December 2014 all central functions in Sweden were brought together in one company, H & M Hennes & Mauritz GBC AB. Due to this, the majority of the revenues and costs in the parent company were transferred to H & M Hennes & Mauritz GBC AB.
  • 18. Nine-month report 2015 (1 Dec 2014 – 31 Aug 2015) 18 PARENT COMPANY BALANCE SHEET IN SUMMARY (SEK m) 31 Aug - 2015 31 Aug - 2014 30 Nov 2014 ASSETS Fixed assets Tangible fixed assets 542 540 648 Financial fixed assets 1,714 1,511 1,553 2,256 2,051 2,201 Current assets Current receivables 3,207 1,707 11,997 Short-term investments, 4-12 months - - 2,602 Cash and cash equivalents 0 1,147 2,314 3,207 2,854 16,913 TOTAL ASSETS 5,463 4,905 19,114 EQUITY AND LIABILITIES Equity 4,429 3,344 17,261 Untaxed reserves 464 454 464 Long-term liabilities* 223 213 223 Current liabilities** 347 894 1,166 TOTAL EQUITY AND LIABILITIES 5,463 4,905 19,114 * Relates to provisions for pensions. ** No current liabilities are interest-bearing.