Recommandé

Recommandé
Contenu connexe
Tendances
Tendances (19)
Similaire à Growth of Calcium-Fertilized Sugar Maple and Yellow Birch at Hubbard Brook
Similaire à Growth of Calcium-Fertilized Sugar Maple and Yellow Birch at Hubbard Brook (20)
Growth of Calcium-Fertilized Sugar Maple and Yellow Birch at Hubbard Brook
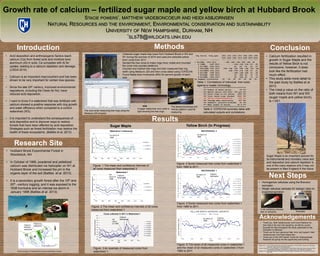
- 1. Next Steps Acknowledgements • Thank you, Matt Vadeboncoeur and Conor Madison for their help in the tree core sampling, as well as Lauren Buzinski for help throughout the study, especially for the extraction of cellulose. • Thank you for your generous help, time, and support, Matt Vadeboncoeur and Heidi Asbjornsen. • Thank you to the UNH Hamel Center for Undergraduate Research for giving me this opportunity and funding. . Research Site • Hubbard Brook Experimental Forest in Woodstock, NH • In October of 1999, powdered and pelletized calcium was distributed via helicopter on W1 at Hubbard Brook and increased the pH in the organic layer of the soil (Battles et al. 2013). • It is a secondary growth forest after the 19th and 20th –century logging, and it was exposed to the 1938 hurricane and an intense ice storm in January 1998 (Battles et al. 2013). MethodsIntroduction Growth rate of calcium – fertilized sugar maple and yellow birch at Hubbard Brook STACIE POWERS*, MATTHEW VADEBONCOEUR AND HEIDI ASBJORNSEN NATURAL RESOURCES AND THE ENVIRONMENT, ENVIRONMENTAL CONSERVATION AND SUSTAINABILITY UNIVERSITY OF NEW HAMPSHIRE, DURHAM, NH *SLS78@WILDCATS.UNH.EDU Conclusion • Acid deposition and anthropogenic factors leach calcium (Ca) from forest soils and mobilize toxic aluminum (Al) in soils. Ca competes with Al for uptake, leading to a calcium depletion and damage. (USDA 2010) • Calcium is an important macronutrient and has been shown to be very important for certain tree species. • Since the late 20th century, improved environmental regulations, including the Clean Air Act, have reduced acid deposition. • I want to know if a watershed that was fertilized with calcium showed a positive response with ring growth and water efficiency when compared to a control watershed (W3). • It is important to understand the consequences of acid deposition and to discover ways to restore forests that have been affected by acid deposition. Strategies such as forest fertilization may restore the health of these ecosystems. (Battles et al. 2013) 0% 1% 2% 3% 4% 5% 1980 1985 1990 1995 2000 2005 2010 2015 relativebasalareaincrement Year Watershed 1 MEAN UPPER CI LOWER CI Calcium fertilization 0% 1% 2% 3% 4% 5% 6% 7% 8% 9% 10% 1980 1985 1990 1995 2000 2005 2010 Relativebasalareaincrement Year Cores collected in 2011 in Watershed 1 H1S1SM H1S2SM H1S4SM H1S5SM H1S6SM H1S7SM H1S8SM H1S9SM 0% 1% 2% 3% 4% 5% 1980 1985 1990 1995 2000 2005 2010 2015 Relativebasalareaincrement Year Watershed 3 (reference) MEAN UPPER CI LOWER CI Ice storm of 1998 • Homogenize cellulose using the Branson sonicator. • Weigh cellulose samples for isotopic data on evapotranspiration 0 0.2 0.4 0.6 0.8 1 1.2 1.4 1.6 1.8 2 1980 1985 1990 1995 2000 2005 2010 RADIALINCREMENT(MM) YEAR YELLOW BIRCH AVERAGE GROWTH H3 Average H1 Average • Calcium fertilization resulted in growth in Sugar Maple and the results of Yellow Birch is not conclusive, however, it does look like the fertilization had much effect. • This study adds more detail to the past study by Battles et al. 2013. • The t-test p value on the ratio of both means from W1 and W3 (sugar maple and yellow birch) is <.001. • Collected sugar maple tree cores from Hubbard Brook in W3 and W1 during the summer of 2014 and used pre-collected yellow birch cores from 2011. • Sanded the tree cores to make rings more visible and mounted the cores onto wooden platforms. • Counted and marked tree rings and then measured tree ring width using Measure J2X and then cross-dated using COFECHA • Found Basal Area Increments (BAI) for percent growth of each year. Calcium- fertilized watershed Reference watershed Ice storm of 1998 Calcium fertilizationIce storm of 1998 Calcium fertilization Ice storm of 1998 Yellow Birch (In Progress)Sugar Maple Figure. 1 The mean and confidence intervals of all cores measured from watershed 3. Figure. 2 The mean and confidence intervals of all cores measured from watershed 1. Figure. 3 An example of measured cores from watershed 1. 0 0.5 1 1.5 2 2.5 3 3.5 4 1980 1985 1990 1995 2000 2005 2010 RADIALINCREMENT(MILLIMETERS) YEAR WATERSHED 3 H3YB1S4 H3YB2S4 H3YB2S5 H3YB2S7 H3YB2S8 H3YB3S2 H3YB3S4 H3YB3S7 0 0.5 1 1.5 2 2.5 3 3.5 4 4.5 1980 1985 1990 1995 2000 2005 2010 RADIALINCREMENTS(MILLIMETERS) YEAR WATERSHED 1 H1YB1S3 H1YB1S7 H1YB1S9 H1YB2S6 H1YB2S7 H1YB3S6 H1YB3S7 H1YB3S8 Figure. 4 Some measured tree cores from watershed 3 from 1980 to 2011. Figure. 5 Some measured tree cores from watershed 1 from 1980 to 2011. Figure. 6 The mean of all measured cores in watershed 1 and the mean of all measured cores in watershed 3 from 1980 to 2011. 2000 **************************************** *C* Number of dated series 28 *C* *O* Master series 1914 2013 100 yrs *O* *F* Total rings in all series 2254 *F* *E* Total dated rings checked 2251 *E* *C* Series intercorrelation .369 *C* *H* Average mean sensitivity .267 *H* *A* Segments, possible problems 91 *A* *** Mean length of series 80.5 *** **************************************** Seq Series Time_span 1905 1920 1935 1950 1965 1980 1995 1934 1949 1964 1979 1994 2009 2024 --- -------- --------- ---- ---- ---- ---- ---- ---- ---- 1 H110SM1 1934 2013 -.16B-.18B-.18B-.08B .38A .48 2 13SM1 1947 2013 -.01B-.11B .11B .53 .52 3 H113SM2 1942 2013 .55 .58 .43 .55 .67 4 H1S14SM2 1919 2013 .03B-.03B .16A .20B .19B .37A .35A 5 H116SMT6 1924 2012 .00B-.07B-.07B .16B .63 .61 6 H117SM2 1949 2013 -.04B-.15B-.04B .43 .59 7 H118SM1 1940 2013 .45 .42A .63 .76 .74 8 H118SM2 1943 2013 .46 .32A .60 .73 .72 Av segment correlation .01 .19 .35 .36 .32 .48 .51 Sugar Maple is an important species for its instrumental and monetary value and acid deposition and calcium depletion is one of the many reasons why it may not be present in New England in the future. The view while measuring tree rings using the Measure J2X program Results A vial containing cellulose after an extraction A sugar maple tree core under a light showing the tree rings. Photos courtesy of Hubbard Brook Experimental Station website Table 1. Correlations of individual tree cores against a master chronology. Table 2. COFECHA summary table with calculated outputs and correlations. The stereomicroscope and Velmex platform used for measuring. Ice storm of 1998 Calcium fertilization Ice storm of 1998 Battles, John J., et al. “Restoring Soil Calcium Reverses Forest Decline.” Environmental Science and Technology Letters vol. 1 (2014):15-19. Web. Sept 30 2014. Driscoll, Charles, et al. “Acidic Deposition in the Northeastern United States: Sources and Inputs, Ecosystem Effects, and Management Strategies.” Bioscience 51:3 (March, 2001): 180-198. Web. 30 Sept 2014. Schaberg, Paul. "Acid Rain and Calcium Depletion." Forest Disturbance Processes. USDA Forest Service, 27 Jan. 2010. Web Sonicator