Excel: Sensitivity Analysis with data tables
•
0 j'aime•158 vues

The "What If Analysis" functionality in Excel finds the best possible scenario based on available data points. Use it to find the best price to optimise revenue and profit.

Recommandé
Contenu connexe
Tendances
Tendances (20)
Plus de Stefania Borchia
Plus de Stefania Borchia (20)
Dernier
Dernier (20)
Excel: Sensitivity Analysis with data tables
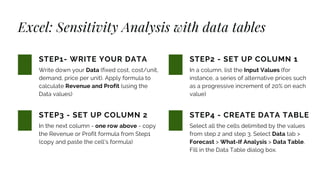
- 1. Excel: Sensitivity Analysis with data tables Write down your Data (fixed cost, cost/unit, demand, price per unit). Apply formula to calculate Revenue and Profit (using the Data values) STEP1- WRITE YOUR DATA In the next column - one row above - copy the Revenue or Profit formula from Step1 (copy and paste the cell's formula) STEP3 - SET UP COLUMN 2 In a column, list the Input Values (for instance, a series of alternative prices such as a progressive increment of 20% on each value) STEP2 - SET UP COLUMN 1 Select all the cells delimited by the values from step 2 and step 3. Select Data tab > Forecast > What-If Analysis > Data Table. Fill in the Data Table dialog box. STEP4 - CREATE DATA TABLE