SlideShare a Scribd company logo
1 of 6
Download to read offline
1
The NPA Story
NPAs in the banking system have started increasing sharply since the end of 2011. This was also the
period when the growth in India’s GDP had started slowing down from levels of above 8% (based on old
methodology) to 6.2% in FY12 and further to 4.5% and 4.7% respectively in the subsequent years. Based
on the new methodology, growth rates are higher at 5.6% and 6.6% respectively in FY13 and FY14.
These years were also the ones where there was low industrial growth as well as build-up of stalled
projects as there were challenges in areas such as mining, power, land, environment to name some.
Industrial growth came down to 1.1% in FY13, -0.1% in FY14 and 2.8% in FY15. Growth in bank credit has
also averaged a lower number of 13.5% for the period FY12-FY15 compared with 19.5% in the preceding
four years. Therefore, the macro conditions have not been favourable and hence contributed to the
higher growth in NPAs.
It has been observed historically that banks also tend to lend more money when economic conditions are
good. However, once the downturn sets in the business cycle, the assets come under pressure and move
towards becoming NPAs – especially those in the infrastructure sector as well as loans given to the SME
segment which get impacted significantly during a downturn. Also a sub-optimal monsoon leads to an
increase in NPAs on farm loans. A combination of these factors has contributed to this build-up of NPAs
over the years.
Table 1 below provides information on the absolute quantum of NPAs across various bank groups for the
last 5 years. The share of PSBs in total NPAs has been increasing continuously over the last 5 years from
around 71% in FY10 to 86% in FY15. Therefore there has been concentration of NPAs in this segment. Also
in value terms the incremental increase has been more perceptible after FY12 with an increase of
between Rs 44,000-60,000 cr each year. Quite clearly the level of stress has gone up. It is important to
note that the numbers mentioned here are the classified NPAs and do not include the restructured assets,
which is another portfolio of stressed assets that had built-up largely due to the infra sector which was
buffeted by extraneous forces that made debt servicing difficult. Also these NPAs are after sale of assets
to ARCs, 5/25 assets and SDR (strategic debt restructuring).
Table 1: Gross NPAs of banks (Rs cr)
March Public Private Foreign Total
2010 59,434 17,341 7,134 83,909
2011 74,926 18,239 5,068 98,233
2012 117,838 18,768 6,297 142,903
2013 164,461 21,071 7,964 193,496
2014 227,264 24,542 11,565 263,371
2015 278,465 34,106 10,771 323,342
Source: RBI
Table 2 below traces the growth pattern of NPAs across the three categories of banks over the 5 year
period. Growth in NPAs has been fairly high with a compounded rate of 31% for the 5-year period. This
rate has exceeded that of credit thus bringing to the fore the rudiments of the problem. Such a situation
does signal an inherent weakness in the system that has to be addressed.
EconomicsFebruary19,2016
Economics
The NPA Story 2
Table 2: Growth in NPAs (%)
March Public Private Foreign Total
2011 26.1 5.2 -29.0 17.1
2012 57.3 2.9 24.3 45.5
2013 39.6 12.3 26.5 35.4
2014 38.2 16.5 45.2 36.1
2015 22.5 39.0 -6.9 22.8
Source: RBI
The table shows that PSBs have witnessed the highest growth rate given their rising share in the total NPAs of the
banking system. However, private banks too have witnessed an increasing growth rate in NPAs implying that the
downturn does affect all banks alike and hence depending on the portfolio on the assets side, the intensity differs.
Foreign banks have had a mixed picture in terms of growth in NPAs, being high in the years FY12-FY14, but
declining in the other two years. The conclusion that emerges is that while PSBs have definitely had the highest
growth in NPAs, the trend in other banks was also the same, albeit at a lower level. Typically banks with a higher
retail portfolio as well as lower proportion of legacy loans would tend to have better NPA ratios. Private banks on
the whole would be scoring better on both these counts.
For the system as a whole the Gross NPA ratio has been increasing from FY12 onwards after declining in
FY11.(Exhibit 1) With higher growth in NPAs and lower growth in bank advances growth, the ratio has tended to
have an upward bias.
Exhibit 1: Gross NPA ratio of all banks (%)
Source: RBI
2.51
2.35
2.95
3.23
3.83
4.27
0.00
0.50
1.00
1.50
2.00
2.50
3.00
3.50
4.00
4.50
2010 2011 2012 2013 2014 2015
Economics
The NPA Story 3
Table 3: NPA ratios Bank Group-wise
Year Public Private Foreign Total
2010 2.27 2.99 4.36 2.51
2011 2.31 2.48 2.61 2.35
2012 3.17 2.09 2.76 2.95
2013 3.61 1.77 3.04 3.23
2014 4.36 1.78 3.86 3.83
2015 4.96 2.10 3.20 4.27
Source: RBI
Table 3 shows that the NPA ratio has been the highest for public sector banks followed by foreign banks. In case
of PSBs it has been increasing continuously over the years while for the foreign banks it declined in FY12 and then
rose till FY14 before declining in FY15. The private sector banks however, have witnessed declining trend till FY14
before increasing in FY15.
Incremental NPAs
Gross NPAs of the system have been increasing also in incremental terms i.e. additions to NPAs. The CAGR was
24.5% over the five-year period reflecting again difficult economic circumstances. Table 4 provides information on
additions to gross NPAs for the last 5 years as well as new NPAs as a percentage of incremental advances. This
ratio again has been increasing sharply in FY14 and FY15 reaching 30.5%. While admittedly these additions to
NPAs are recognition for the past years and hence not strictly comparable with the incremental credit of the
banking system, it still serves as a broad indicator of the movement of these two variables and the fact that it has
been generally rising does flag a problem for the system. Further, such additions to NPAs do put pressure on
banks in terms of making provisions as well as writing off sticky assets which affects the profitability of the
system.
Table 4: Additions to NPAs as % of incremental credit (%)
March Additions Inc lending Ratio
2011 70,439 733,903 9.6
2012 97,519 652,826 14.9
2013 138,389 1,323,012 10.5
2014 189,722 903,928 21.0
2015 208,638 684,918 30.5
Source: RBI
Bank action on NPAs
Two aspects of NPAs which are important are the responses from banks in terms of write-offs and provisions
which finally affect their balance sheets. Table 5 gives the total write-offs of all banks which have been increasing
especially from FY14 onwards. In FY15 write-offs were at the peak at Rs 60,050 crore, which is 0.79% of total
outstanding advances as of March 2015. However, write-offs were 26% of operating profits, which is quite
significant.
Economics
The NPA Story 4
Table 5: Total write-offs of NPAs (Rs crore)
Public Private Foreign Total
2010 2,897 4,072 2,948 9,917
2011 5,885 2,339 78 8,302
2012 2,348 3,262 4 5,614
2013 7,186 4,115 52 11,353
2014 30,834 6,541 1,339 38,714
2015 50,979 7,134 1,937 60,050
Source: RBI
Table 6 below presents data on provisions made by banks for NPAs. Like write-offs they have been increasing
continuously with a sharp gradient in FY14 and FY15. While the provisions were a high multiple of write-offs in the
first 4 years, this has come down in the last two years indicating a combination of either more NPAs being written
off or lower provisions being made keeping in mind the profit movement.
Table 6: Provisions for NPAs (Rs crore)
Public Private Foreign Total
2010 17,142 9,629 3,908 30,679
2011 25,956 5,084 538 31,578
2012 34,572 3,981 1,999 40,552
2013 43,063 5,474 1,048 49,585
2014 55,450 7,261 3,933 66,644
2015 67,752 9,962 2,069 79,783
Source: RBI
The credit cost (defined as provisions to average outstanding advances in two years) has been concomitantly
increasing from 0.87% in FY11 to 1.04% and 1.11% in the last 2 years respectively.
The FY16 episode
In FY16 the NPA scene has become even more serious over the quarters. Information however, is available for a
sub-set of 39 Indian banks, 24 in the public sector and 15 in private.
Table 6: NPAs in FY16 (Rs crore and ratio in %)
Q4 FY15 Q1 FY16 Q2 FY16 Q3 FY16
Rs cr Ratio
%
Rs cr Ratio
%
Rs cr Ratio
%
Rs cr Ratio
%
Public Banks 269,124 5.1 285,748 5.5 303,678 5.8 527,246 9.2
Private Banks 32,379 2.0 34,805 2.2 36,716 2.2 44,813 2.7
All Banks 301,502 4.4 320,554 4.7 340,395 4.9 572,059 8.1
Source: ACE Equity database
Average Gross NPAs across all banks increased from 4.4% in Q4-FY15 to 4.7% in Q1-FY16 to 4.9% in Q2-FY16 and
8.1% in Q3-FY16. As witnessed in the table, most of the increase in the NPAs can be attributed to the PSBs. It
Economics
The NPA Story 5
needs to be noted that out of the 24 PSBs banks, only 4 banks have gross NPAs below 5% in Q3-FY16. Two of
them have had a ratio of above 10%, while 7 had between 8-10%. Although lower, NPAs of private banks have
also increased from 2.0% in Q4-FY15 to 2.7% in Q3-FY16. Only two of them had ratios of above 5% and are old
private banks.
The higher NPA ratios for some PSBs for December quarter can be attributed to prudent recognition norms
following the advice given by RBI as well as recognition of some restructured assets as non-performing as per the
new guidelines besides absolute numbers increasing due to corporate stress. Economic slowdown, incorrect
credit assessment, governance issues and wilful default are other reasons for this increase in NPAs. The NPAs
according to the RBI are concentrated in sectors such as infrastructure, mining, textiles, steel and aviation which
could still be under pressure given the direction of global commodity prices. Further the price movements in steel
on account of the China factor would continue to exert pressure.
How to reduce NPAs?
NPAs normally have tended to move along with the economic cycle. Often loans given during good times stop
performing when conditions turn adverse. The recent fall in commodity prices has affected several industries and
those which are leveraged have had issues with debt servicing. The interest cover ratio has also been declining
over the last few quarters. For a random sample of 2,454 manufacturing companies, the interest cover (defined as
PBIT/interest) declined continuously from 3.78 in March 2015 to 3.70 in June, 3.20 in September and 2.70 in
December.
The following are some thoughts on reducing NPAs.
1. More stringent credit appraisal from the point of view of banks. Weak banks could pursue narrow banking
until such time their books look better after capitalization. This process could also imply shrinking the
balance sheets at times.
2. Better monitoring of assets, especially those with high value. There could be separate departments to
address this issue.
3. Have in place early warning signals to flag such problems. This would be in the nature of picking up signals
on policy or industry developments besides the regular financial indicators.
4. Better information dissemination on the NPAs especially on those who are wilful defaulters or have very
large debt overhang. This can be useful for banks when sanctioning fresh loans.
5. Recognizing the same in a prudent manner and making provisions thereof.
6. Addressing governance issues in some banks that have high NPAs.
7. Asset reconstruction companies would need to run in parallel to takeover such assets. Creating a bad
bank is an idea to be pursued in this respect.
8. The passing of the bankruptcy code would be very useful in addressing this issue.
Assuming that these books are cleaned up by March 2016, a recovery in industrial prospects should help to lower
the delinquency rates. The RBI had also noted in its draft guidelines on large exposures of banks that a certain
segment should be migrated to the corporate debt market. Such a move will help to spread risk across sectors.
Given that there will be an upward pressure on funding once the investment cycle recovers and infrastructure
investment picks up, there will be the need to provide for the same through the financial system. Banks may not be
able to fully accommodate this requirement and hence it may be expected that there would be a diversion to the
bond market. The challenge however will still remain for the system to ensure that 1-5 mentioned above are
assiduously followed to keep these numbers under check.
Economics
The NPA Story 6
Conclusions
- NPAs are a serious issue which has gotten magnified after FY12 with the economic downturn.
- A warning signal is when growth in NPAs exceeds that in credit on a continuous basis of 3-4 quarters
- While there is concentration of NPAs in PSBs, the problem is generalized for all banks including those in
the private sector and foreign banks.
- When viewing NPAs it is also essential to look at additions to this stock as well as provisions made and
write offs as they do affect the profit lines of banks.
- Conditions could improve from FY17 onwards on account of the cleaning up operations of banks as per
news received in Q3-FY16 as well as a turnaround in the economy.
- There are several solutions to solving this issue of NPAs as noted earlier. However, to be effective, they
must be used together from all fronts so that they are effective.
Disclaimer
This report is prepared by Credit Analysis &Research Limited (CARE Ratings). CARE Ratings has taken utmost care to ensure accuracy
and objectivity while developing this report based on information available in public domain. However, neither the accuracy nor
completeness of information contained in this report is guaranteed. CARE Ratings is not responsible for any errors or omissions in
analysis/inferences/views or for results obtained from the use of information contained in this report and especially states that CARE
Ratings has no financial liability whatsoever to the user of this report.
Contact:
Madan Sabnavis Anuja Shah
Chief Economist Economist
madan.sabnavis@careratings.com anuja.shah@careratings.com
91-022-67543489 91-022-6754 3568

More Related Content

What's hot

Recent performance of the debt mutual funds and the way forward
Recent performance of the debt mutual funds and the way forwardRecent performance of the debt mutual funds and the way forward
Recent performance of the debt mutual funds and the way forwardDhuraivel Gunasekaran
 
China macroeconomy
China macroeconomyChina macroeconomy
China macroeconomygarimayadav7
 
Capital Markets Insights - Spring 2017
Capital Markets Insights - Spring 2017Capital Markets Insights - Spring 2017
Capital Markets Insights - Spring 2017Duff & Phelps
 
The World This Week - 1st June to 6th June, 2015
The World This Week - 1st June to 6th June, 2015The World This Week - 1st June to 6th June, 2015
The World This Week - 1st June to 6th June, 2015Karvy Private Wealth
 
Assessing Countries’ Financial Inclusion Standing: A New Composite Index
Assessing Countries’ Financial Inclusion Standing: A New Composite IndexAssessing Countries’ Financial Inclusion Standing: A New Composite Index
Assessing Countries’ Financial Inclusion Standing: A New Composite IndexDr Lendy Spires
 

What's hot (20)

Advice for The Wise March 2014
Advice for The Wise March 2014Advice for The Wise March 2014
Advice for The Wise March 2014
 
Advice For The Wise - May
Advice For The Wise - May Advice For The Wise - May
Advice For The Wise - May
 
Polish economic outlook 1/2010 (44)
Polish economic outlook 1/2010 (44)Polish economic outlook 1/2010 (44)
Polish economic outlook 1/2010 (44)
 
Recent performance of the debt mutual funds and the way forward
Recent performance of the debt mutual funds and the way forwardRecent performance of the debt mutual funds and the way forward
Recent performance of the debt mutual funds and the way forward
 
Advice for The Wise February 2014
Advice for The Wise February 2014Advice for The Wise February 2014
Advice for The Wise February 2014
 
Advice for the Wise: June 2013
Advice for the Wise: June 2013Advice for the Wise: June 2013
Advice for the Wise: June 2013
 
Advice for The Wise April 2014
Advice for The Wise April 2014Advice for The Wise April 2014
Advice for The Wise April 2014
 
Weekly Market Review - July 5, 2013
Weekly Market Review - July 5, 2013Weekly Market Review - July 5, 2013
Weekly Market Review - July 5, 2013
 
Advice For The Wise: July, 2013
Advice For The Wise: July, 2013Advice For The Wise: July, 2013
Advice For The Wise: July, 2013
 
China macroeconomy
China macroeconomyChina macroeconomy
China macroeconomy
 
India economic-survey-main-findings
India economic-survey-main-findingsIndia economic-survey-main-findings
India economic-survey-main-findings
 
Capital Markets Insights - Spring 2017
Capital Markets Insights - Spring 2017Capital Markets Insights - Spring 2017
Capital Markets Insights - Spring 2017
 
Advice for The Wise January 2014
Advice for The Wise January 2014Advice for The Wise January 2014
Advice for The Wise January 2014
 
Employment Trends Survey 2012
Employment Trends Survey 2012Employment Trends Survey 2012
Employment Trends Survey 2012
 
c
cc
c
 
The World This Week - 1st June to 6th June, 2015
The World This Week - 1st June to 6th June, 2015The World This Week - 1st June to 6th June, 2015
The World This Week - 1st June to 6th June, 2015
 
Assessing Countries’ Financial Inclusion Standing: A New Composite Index
Assessing Countries’ Financial Inclusion Standing: A New Composite IndexAssessing Countries’ Financial Inclusion Standing: A New Composite Index
Assessing Countries’ Financial Inclusion Standing: A New Composite Index
 
Weekly Market Review - July 26, 2013
Weekly Market Review - July 26, 2013Weekly Market Review - July 26, 2013
Weekly Market Review - July 26, 2013
 
Advice for the wise july 2013
Advice for the wise  july 2013Advice for the wise  july 2013
Advice for the wise july 2013
 
Fin3600 11
Fin3600 11Fin3600 11
Fin3600 11
 

Viewers also liked

Смірнова Т.Ю.
Смірнова Т.Ю.Смірнова Т.Ю.
Смірнова Т.Ю.elenasurprise
 
Monitoring of teaching report 2016_round 1_nsu_slides_fs
Monitoring of teaching report 2016_round 1_nsu_slides_fsMonitoring of teaching report 2016_round 1_nsu_slides_fs
Monitoring of teaching report 2016_round 1_nsu_slides_fsTatyana Cherkashina
 
Medicon 2016 presentation
Medicon 2016 presentationMedicon 2016 presentation
Medicon 2016 presentationmadurai
 
CAMBRIDGE AS HISTORY: BERLIN CONFERENCE
CAMBRIDGE AS HISTORY: BERLIN CONFERENCECAMBRIDGE AS HISTORY: BERLIN CONFERENCE
CAMBRIDGE AS HISTORY: BERLIN CONFERENCEGeorge Dumitrache
 
CTC Detection and Molecular Characterization – Challenges and Solutions
CTC Detection and Molecular Characterization – Challenges and SolutionsCTC Detection and Molecular Characterization – Challenges and Solutions
CTC Detection and Molecular Characterization – Challenges and SolutionsQIAGEN
 
Inhibidores selectivos cox 2
Inhibidores selectivos cox 2Inhibidores selectivos cox 2
Inhibidores selectivos cox 2Arelly Moreno
 

Viewers also liked (11)

Justics
JusticsJustics
Justics
 
PERSONAL DETAILS
PERSONAL DETAILSPERSONAL DETAILS
PERSONAL DETAILS
 
Info sacu
Info sacuInfo sacu
Info sacu
 
Смірнова Т.Ю.
Смірнова Т.Ю.Смірнова Т.Ю.
Смірнова Т.Ю.
 
Monitoring of teaching report 2016_round 1_nsu_slides_fs
Monitoring of teaching report 2016_round 1_nsu_slides_fsMonitoring of teaching report 2016_round 1_nsu_slides_fs
Monitoring of teaching report 2016_round 1_nsu_slides_fs
 
Italy
ItalyItaly
Italy
 
Medicon 2016 presentation
Medicon 2016 presentationMedicon 2016 presentation
Medicon 2016 presentation
 
CAMBRIDGE AS HISTORY: BERLIN CONFERENCE
CAMBRIDGE AS HISTORY: BERLIN CONFERENCECAMBRIDGE AS HISTORY: BERLIN CONFERENCE
CAMBRIDGE AS HISTORY: BERLIN CONFERENCE
 
CTC Detection and Molecular Characterization – Challenges and Solutions
CTC Detection and Molecular Characterization – Challenges and SolutionsCTC Detection and Molecular Characterization – Challenges and Solutions
CTC Detection and Molecular Characterization – Challenges and Solutions
 
Plan de desarrollo la guajira 2016 2019 - parte 2 de 5
Plan de desarrollo la guajira 2016 2019 - parte 2 de 5Plan de desarrollo la guajira 2016 2019 - parte 2 de 5
Plan de desarrollo la guajira 2016 2019 - parte 2 de 5
 
Inhibidores selectivos cox 2
Inhibidores selectivos cox 2Inhibidores selectivos cox 2
Inhibidores selectivos cox 2
 

Similar to NPA Story

Developments in the monetary policy arena
Developments in the monetary policy arenaDevelopments in the monetary policy arena
Developments in the monetary policy arenavideoaakash15
 
2016/17 China Macroeconomic Outlook & Market Opportunities
2016/17 China Macroeconomic Outlook & Market Opportunities2016/17 China Macroeconomic Outlook & Market Opportunities
2016/17 China Macroeconomic Outlook & Market OpportunitiesNan BAI,CFA
 
Federal Bank Fundamental Report
Federal Bank Fundamental ReportFederal Bank Fundamental Report
Federal Bank Fundamental ReportSumeesh Thomas
 
A STUDY OF NON-PERFORMING ASSETS AND ITS IMPACT ON BANKING SECTOR
A STUDY OF NON-PERFORMING ASSETS AND ITS IMPACT ON BANKING SECTORA STUDY OF NON-PERFORMING ASSETS AND ITS IMPACT ON BANKING SECTOR
A STUDY OF NON-PERFORMING ASSETS AND ITS IMPACT ON BANKING SECTORJournal For Research
 
Empowering MSMEs - Role of Banks - part - 2
Empowering MSMEs - Role of Banks - part - 2Empowering MSMEs - Role of Banks - part - 2
Empowering MSMEs - Role of Banks - part - 2Resurgent India
 
RBI's FY2011 Annual Monetary Policy Review 21-04-10
RBI's FY2011 Annual Monetary Policy Review 21-04-10RBI's FY2011 Annual Monetary Policy Review 21-04-10
RBI's FY2011 Annual Monetary Policy Review 21-04-10Angel Broking
 
05 money and_credit
05 money and_credit05 money and_credit
05 money and_creditAsgharHoti1
 
Fending off Toxic Debt
Fending off Toxic Debt Fending off Toxic Debt
Fending off Toxic Debt Kyna Tsai
 
China’s Latest Stimulus
China’s Latest Stimulus China’s Latest Stimulus
China’s Latest Stimulus QNB Group
 
ijresm-v4-i5-55 A Study On Structure and Growth of Banking Industry in India.pdf
ijresm-v4-i5-55 A Study On Structure and Growth of Banking Industry in India.pdfijresm-v4-i5-55 A Study On Structure and Growth of Banking Industry in India.pdf
ijresm-v4-i5-55 A Study On Structure and Growth of Banking Industry in India.pdfDR BHADRAPPA HARALAYYA
 
Indonesia Economic Outlook Q1 2019
Indonesia Economic Outlook Q1 2019Indonesia Economic Outlook Q1 2019
Indonesia Economic Outlook Q1 2019Febrio Kacaribu
 
Indonesia Economic Outlook Q1 2019
Indonesia Economic Outlook Q1 2019Indonesia Economic Outlook Q1 2019
Indonesia Economic Outlook Q1 2019febrionathan
 
E392430
E392430E392430
E392430aijbm
 
Indian Banking Moving towards a new landscape - Current Status and Trends of...
Indian Banking  Moving towards a new landscape - Current Status and Trends of...Indian Banking  Moving towards a new landscape - Current Status and Trends of...
Indian Banking Moving towards a new landscape - Current Status and Trends of...Resurgent India
 
Economic Outlook- Nov'15
Economic Outlook- Nov'15Economic Outlook- Nov'15
Economic Outlook- Nov'15choice broking
 

Similar to NPA Story (20)

Developments in the monetary policy arena
Developments in the monetary policy arenaDevelopments in the monetary policy arena
Developments in the monetary policy arena
 
2016/17 China Macroeconomic Outlook & Market Opportunities
2016/17 China Macroeconomic Outlook & Market Opportunities2016/17 China Macroeconomic Outlook & Market Opportunities
2016/17 China Macroeconomic Outlook & Market Opportunities
 
Federal Bank Fundamental Report
Federal Bank Fundamental ReportFederal Bank Fundamental Report
Federal Bank Fundamental Report
 
A STUDY OF NON-PERFORMING ASSETS AND ITS IMPACT ON BANKING SECTOR
A STUDY OF NON-PERFORMING ASSETS AND ITS IMPACT ON BANKING SECTORA STUDY OF NON-PERFORMING ASSETS AND ITS IMPACT ON BANKING SECTOR
A STUDY OF NON-PERFORMING ASSETS AND ITS IMPACT ON BANKING SECTOR
 
Empowering MSMEs - Role of Banks - part - 2
Empowering MSMEs - Role of Banks - part - 2Empowering MSMEs - Role of Banks - part - 2
Empowering MSMEs - Role of Banks - part - 2
 
RBI's FY2011 Annual Monetary Policy Review 21-04-10
RBI's FY2011 Annual Monetary Policy Review 21-04-10RBI's FY2011 Annual Monetary Policy Review 21-04-10
RBI's FY2011 Annual Monetary Policy Review 21-04-10
 
05 money and_credit
05 money and_credit05 money and_credit
05 money and_credit
 
Fending off Toxic Debt
Fending off Toxic Debt Fending off Toxic Debt
Fending off Toxic Debt
 
China’s Latest Stimulus
China’s Latest Stimulus China’s Latest Stimulus
China’s Latest Stimulus
 
ijresm-v4-i5-55 A Study On Structure and Growth of Banking Industry in India.pdf
ijresm-v4-i5-55 A Study On Structure and Growth of Banking Industry in India.pdfijresm-v4-i5-55 A Study On Structure and Growth of Banking Industry in India.pdf
ijresm-v4-i5-55 A Study On Structure and Growth of Banking Industry in India.pdf
 
Indonesia Economic Outlook Q1 2019
Indonesia Economic Outlook Q1 2019Indonesia Economic Outlook Q1 2019
Indonesia Economic Outlook Q1 2019
 
Indonesia Economic Outlook Q1 2019
Indonesia Economic Outlook Q1 2019Indonesia Economic Outlook Q1 2019
Indonesia Economic Outlook Q1 2019
 
E392430
E392430E392430
E392430
 
Indian Banking Moving towards a new landscape - Current Status and Trends of...
Indian Banking  Moving towards a new landscape - Current Status and Trends of...Indian Banking  Moving towards a new landscape - Current Status and Trends of...
Indian Banking Moving towards a new landscape - Current Status and Trends of...
 
Non performing assets
Non performing assetsNon performing assets
Non performing assets
 
Global economy
Global economyGlobal economy
Global economy
 
Economic Outlook- Nov'15
Economic Outlook- Nov'15Economic Outlook- Nov'15
Economic Outlook- Nov'15
 
Worldbank report may 2015
Worldbank report may 2015Worldbank report may 2015
Worldbank report may 2015
 
Worldbank report may 2015
Worldbank report may 2015Worldbank report may 2015
Worldbank report may 2015
 
442-1012-1-PB
442-1012-1-PB442-1012-1-PB
442-1012-1-PB
 

Recently uploaded

办理学位证中佛罗里达大学毕业证,UCF成绩单原版一比一
办理学位证中佛罗里达大学毕业证,UCF成绩单原版一比一办理学位证中佛罗里达大学毕业证,UCF成绩单原版一比一
办理学位证中佛罗里达大学毕业证,UCF成绩单原版一比一F sss
 
RS 9000 Call In girls Dwarka Mor (DELHI)⇛9711147426🔝Delhi
RS 9000 Call In girls Dwarka Mor (DELHI)⇛9711147426🔝DelhiRS 9000 Call In girls Dwarka Mor (DELHI)⇛9711147426🔝Delhi
RS 9000 Call In girls Dwarka Mor (DELHI)⇛9711147426🔝Delhijennyeacort
 
MK KOMUNIKASI DATA (TI)komdat komdat.docx
MK KOMUNIKASI DATA (TI)komdat komdat.docxMK KOMUNIKASI DATA (TI)komdat komdat.docx
MK KOMUNIKASI DATA (TI)komdat komdat.docxUnduhUnggah1
 
Top 5 Best Data Analytics Courses In Queens
Top 5 Best Data Analytics Courses In QueensTop 5 Best Data Analytics Courses In Queens
Top 5 Best Data Analytics Courses In Queensdataanalyticsqueen03
 
High Class Call Girls Noida Sector 39 Aarushi 🔝8264348440🔝 Independent Escort...
High Class Call Girls Noida Sector 39 Aarushi 🔝8264348440🔝 Independent Escort...High Class Call Girls Noida Sector 39 Aarushi 🔝8264348440🔝 Independent Escort...
High Class Call Girls Noida Sector 39 Aarushi 🔝8264348440🔝 Independent Escort...soniya singh
 
INTERNSHIP ON PURBASHA COMPOSITE TEX LTD
INTERNSHIP ON PURBASHA COMPOSITE TEX LTDINTERNSHIP ON PURBASHA COMPOSITE TEX LTD
INTERNSHIP ON PURBASHA COMPOSITE TEX LTDRafezzaman
 
Beautiful Sapna Vip Call Girls Hauz Khas 9711199012 Call /Whatsapps
Beautiful Sapna Vip  Call Girls Hauz Khas 9711199012 Call /WhatsappsBeautiful Sapna Vip  Call Girls Hauz Khas 9711199012 Call /Whatsapps
Beautiful Sapna Vip Call Girls Hauz Khas 9711199012 Call /Whatsappssapnasaifi408
 
RABBIT: A CLI tool for identifying bots based on their GitHub events.
RABBIT: A CLI tool for identifying bots based on their GitHub events.RABBIT: A CLI tool for identifying bots based on their GitHub events.
RABBIT: A CLI tool for identifying bots based on their GitHub events.natarajan8993
 
Effects of Smartphone Addiction on the Academic Performances of Grades 9 to 1...
Effects of Smartphone Addiction on the Academic Performances of Grades 9 to 1...Effects of Smartphone Addiction on the Academic Performances of Grades 9 to 1...
Effects of Smartphone Addiction on the Academic Performances of Grades 9 to 1...limedy534
 
Advanced Machine Learning for Business Professionals
Advanced Machine Learning for Business ProfessionalsAdvanced Machine Learning for Business Professionals
Advanced Machine Learning for Business ProfessionalsVICTOR MAESTRE RAMIREZ
 
ASML's Taxonomy Adventure by Daniel Canter
ASML's Taxonomy Adventure by Daniel CanterASML's Taxonomy Adventure by Daniel Canter
ASML's Taxonomy Adventure by Daniel Cantervoginip
 
9654467111 Call Girls In Munirka Hotel And Home Service
9654467111 Call Girls In Munirka Hotel And Home Service9654467111 Call Girls In Munirka Hotel And Home Service
9654467111 Call Girls In Munirka Hotel And Home ServiceSapana Sha
 
1:1定制(UQ毕业证)昆士兰大学毕业证成绩单修改留信学历认证原版一模一样
1:1定制(UQ毕业证)昆士兰大学毕业证成绩单修改留信学历认证原版一模一样1:1定制(UQ毕业证)昆士兰大学毕业证成绩单修改留信学历认证原版一模一样
1:1定制(UQ毕业证)昆士兰大学毕业证成绩单修改留信学历认证原版一模一样vhwb25kk
 
Multiple time frame trading analysis -brianshannon.pdf
Multiple time frame trading analysis -brianshannon.pdfMultiple time frame trading analysis -brianshannon.pdf
Multiple time frame trading analysis -brianshannon.pdfchwongval
 
Generative AI for Social Good at Open Data Science East 2024
Generative AI for Social Good at Open Data Science East 2024Generative AI for Social Good at Open Data Science East 2024
Generative AI for Social Good at Open Data Science East 2024Colleen Farrelly
 
How we prevented account sharing with MFA
How we prevented account sharing with MFAHow we prevented account sharing with MFA
How we prevented account sharing with MFAAndrei Kaleshka
 
EMERCE - 2024 - AMSTERDAM - CROSS-PLATFORM TRACKING WITH GOOGLE ANALYTICS.pptx
EMERCE - 2024 - AMSTERDAM - CROSS-PLATFORM  TRACKING WITH GOOGLE ANALYTICS.pptxEMERCE - 2024 - AMSTERDAM - CROSS-PLATFORM  TRACKING WITH GOOGLE ANALYTICS.pptx
EMERCE - 2024 - AMSTERDAM - CROSS-PLATFORM TRACKING WITH GOOGLE ANALYTICS.pptxthyngster
 
Consent & Privacy Signals on Google *Pixels* - MeasureCamp Amsterdam 2024
Consent & Privacy Signals on Google *Pixels* - MeasureCamp Amsterdam 2024Consent & Privacy Signals on Google *Pixels* - MeasureCamp Amsterdam 2024
Consent & Privacy Signals on Google *Pixels* - MeasureCamp Amsterdam 2024thyngster
 

Recently uploaded (20)

办理学位证中佛罗里达大学毕业证,UCF成绩单原版一比一
办理学位证中佛罗里达大学毕业证,UCF成绩单原版一比一办理学位证中佛罗里达大学毕业证,UCF成绩单原版一比一
办理学位证中佛罗里达大学毕业证,UCF成绩单原版一比一
 
RS 9000 Call In girls Dwarka Mor (DELHI)⇛9711147426🔝Delhi
RS 9000 Call In girls Dwarka Mor (DELHI)⇛9711147426🔝DelhiRS 9000 Call In girls Dwarka Mor (DELHI)⇛9711147426🔝Delhi
RS 9000 Call In girls Dwarka Mor (DELHI)⇛9711147426🔝Delhi
 
MK KOMUNIKASI DATA (TI)komdat komdat.docx
MK KOMUNIKASI DATA (TI)komdat komdat.docxMK KOMUNIKASI DATA (TI)komdat komdat.docx
MK KOMUNIKASI DATA (TI)komdat komdat.docx
 
Top 5 Best Data Analytics Courses In Queens
Top 5 Best Data Analytics Courses In QueensTop 5 Best Data Analytics Courses In Queens
Top 5 Best Data Analytics Courses In Queens
 
High Class Call Girls Noida Sector 39 Aarushi 🔝8264348440🔝 Independent Escort...
High Class Call Girls Noida Sector 39 Aarushi 🔝8264348440🔝 Independent Escort...High Class Call Girls Noida Sector 39 Aarushi 🔝8264348440🔝 Independent Escort...
High Class Call Girls Noida Sector 39 Aarushi 🔝8264348440🔝 Independent Escort...
 
E-Commerce Order PredictionShraddha Kamble.pptx
E-Commerce Order PredictionShraddha Kamble.pptxE-Commerce Order PredictionShraddha Kamble.pptx
E-Commerce Order PredictionShraddha Kamble.pptx
 
INTERNSHIP ON PURBASHA COMPOSITE TEX LTD
INTERNSHIP ON PURBASHA COMPOSITE TEX LTDINTERNSHIP ON PURBASHA COMPOSITE TEX LTD
INTERNSHIP ON PURBASHA COMPOSITE TEX LTD
 
Beautiful Sapna Vip Call Girls Hauz Khas 9711199012 Call /Whatsapps
Beautiful Sapna Vip  Call Girls Hauz Khas 9711199012 Call /WhatsappsBeautiful Sapna Vip  Call Girls Hauz Khas 9711199012 Call /Whatsapps
Beautiful Sapna Vip Call Girls Hauz Khas 9711199012 Call /Whatsapps
 
RABBIT: A CLI tool for identifying bots based on their GitHub events.
RABBIT: A CLI tool for identifying bots based on their GitHub events.RABBIT: A CLI tool for identifying bots based on their GitHub events.
RABBIT: A CLI tool for identifying bots based on their GitHub events.
 
Effects of Smartphone Addiction on the Academic Performances of Grades 9 to 1...
Effects of Smartphone Addiction on the Academic Performances of Grades 9 to 1...Effects of Smartphone Addiction on the Academic Performances of Grades 9 to 1...
Effects of Smartphone Addiction on the Academic Performances of Grades 9 to 1...
 
Advanced Machine Learning for Business Professionals
Advanced Machine Learning for Business ProfessionalsAdvanced Machine Learning for Business Professionals
Advanced Machine Learning for Business Professionals
 
ASML's Taxonomy Adventure by Daniel Canter
ASML's Taxonomy Adventure by Daniel CanterASML's Taxonomy Adventure by Daniel Canter
ASML's Taxonomy Adventure by Daniel Canter
 
Deep Generative Learning for All - The Gen AI Hype (Spring 2024)
Deep Generative Learning for All - The Gen AI Hype (Spring 2024)Deep Generative Learning for All - The Gen AI Hype (Spring 2024)
Deep Generative Learning for All - The Gen AI Hype (Spring 2024)
 
9654467111 Call Girls In Munirka Hotel And Home Service
9654467111 Call Girls In Munirka Hotel And Home Service9654467111 Call Girls In Munirka Hotel And Home Service
9654467111 Call Girls In Munirka Hotel And Home Service
 
1:1定制(UQ毕业证)昆士兰大学毕业证成绩单修改留信学历认证原版一模一样
1:1定制(UQ毕业证)昆士兰大学毕业证成绩单修改留信学历认证原版一模一样1:1定制(UQ毕业证)昆士兰大学毕业证成绩单修改留信学历认证原版一模一样
1:1定制(UQ毕业证)昆士兰大学毕业证成绩单修改留信学历认证原版一模一样
 
Multiple time frame trading analysis -brianshannon.pdf
Multiple time frame trading analysis -brianshannon.pdfMultiple time frame trading analysis -brianshannon.pdf
Multiple time frame trading analysis -brianshannon.pdf
 
Generative AI for Social Good at Open Data Science East 2024
Generative AI for Social Good at Open Data Science East 2024Generative AI for Social Good at Open Data Science East 2024
Generative AI for Social Good at Open Data Science East 2024
 
How we prevented account sharing with MFA
How we prevented account sharing with MFAHow we prevented account sharing with MFA
How we prevented account sharing with MFA
 
EMERCE - 2024 - AMSTERDAM - CROSS-PLATFORM TRACKING WITH GOOGLE ANALYTICS.pptx
EMERCE - 2024 - AMSTERDAM - CROSS-PLATFORM  TRACKING WITH GOOGLE ANALYTICS.pptxEMERCE - 2024 - AMSTERDAM - CROSS-PLATFORM  TRACKING WITH GOOGLE ANALYTICS.pptx
EMERCE - 2024 - AMSTERDAM - CROSS-PLATFORM TRACKING WITH GOOGLE ANALYTICS.pptx
 
Consent & Privacy Signals on Google *Pixels* - MeasureCamp Amsterdam 2024
Consent & Privacy Signals on Google *Pixels* - MeasureCamp Amsterdam 2024Consent & Privacy Signals on Google *Pixels* - MeasureCamp Amsterdam 2024
Consent & Privacy Signals on Google *Pixels* - MeasureCamp Amsterdam 2024
 

NPA Story

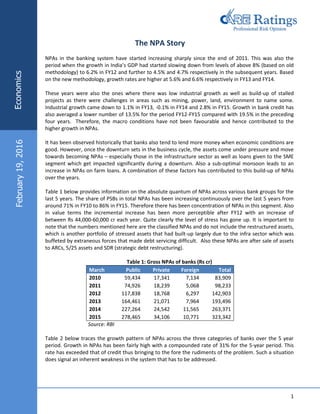
  • 1. 1 The NPA Story NPAs in the banking system have started increasing sharply since the end of 2011. This was also the period when the growth in India’s GDP had started slowing down from levels of above 8% (based on old methodology) to 6.2% in FY12 and further to 4.5% and 4.7% respectively in the subsequent years. Based on the new methodology, growth rates are higher at 5.6% and 6.6% respectively in FY13 and FY14. These years were also the ones where there was low industrial growth as well as build-up of stalled projects as there were challenges in areas such as mining, power, land, environment to name some. Industrial growth came down to 1.1% in FY13, -0.1% in FY14 and 2.8% in FY15. Growth in bank credit has also averaged a lower number of 13.5% for the period FY12-FY15 compared with 19.5% in the preceding four years. Therefore, the macro conditions have not been favourable and hence contributed to the higher growth in NPAs. It has been observed historically that banks also tend to lend more money when economic conditions are good. However, once the downturn sets in the business cycle, the assets come under pressure and move towards becoming NPAs – especially those in the infrastructure sector as well as loans given to the SME segment which get impacted significantly during a downturn. Also a sub-optimal monsoon leads to an increase in NPAs on farm loans. A combination of these factors has contributed to this build-up of NPAs over the years. Table 1 below provides information on the absolute quantum of NPAs across various bank groups for the last 5 years. The share of PSBs in total NPAs has been increasing continuously over the last 5 years from around 71% in FY10 to 86% in FY15. Therefore there has been concentration of NPAs in this segment. Also in value terms the incremental increase has been more perceptible after FY12 with an increase of between Rs 44,000-60,000 cr each year. Quite clearly the level of stress has gone up. It is important to note that the numbers mentioned here are the classified NPAs and do not include the restructured assets, which is another portfolio of stressed assets that had built-up largely due to the infra sector which was buffeted by extraneous forces that made debt servicing difficult. Also these NPAs are after sale of assets to ARCs, 5/25 assets and SDR (strategic debt restructuring). Table 1: Gross NPAs of banks (Rs cr) March Public Private Foreign Total 2010 59,434 17,341 7,134 83,909 2011 74,926 18,239 5,068 98,233 2012 117,838 18,768 6,297 142,903 2013 164,461 21,071 7,964 193,496 2014 227,264 24,542 11,565 263,371 2015 278,465 34,106 10,771 323,342 Source: RBI Table 2 below traces the growth pattern of NPAs across the three categories of banks over the 5 year period. Growth in NPAs has been fairly high with a compounded rate of 31% for the 5-year period. This rate has exceeded that of credit thus bringing to the fore the rudiments of the problem. Such a situation does signal an inherent weakness in the system that has to be addressed. EconomicsFebruary19,2016
  • 2. Economics The NPA Story 2 Table 2: Growth in NPAs (%) March Public Private Foreign Total 2011 26.1 5.2 -29.0 17.1 2012 57.3 2.9 24.3 45.5 2013 39.6 12.3 26.5 35.4 2014 38.2 16.5 45.2 36.1 2015 22.5 39.0 -6.9 22.8 Source: RBI The table shows that PSBs have witnessed the highest growth rate given their rising share in the total NPAs of the banking system. However, private banks too have witnessed an increasing growth rate in NPAs implying that the downturn does affect all banks alike and hence depending on the portfolio on the assets side, the intensity differs. Foreign banks have had a mixed picture in terms of growth in NPAs, being high in the years FY12-FY14, but declining in the other two years. The conclusion that emerges is that while PSBs have definitely had the highest growth in NPAs, the trend in other banks was also the same, albeit at a lower level. Typically banks with a higher retail portfolio as well as lower proportion of legacy loans would tend to have better NPA ratios. Private banks on the whole would be scoring better on both these counts. For the system as a whole the Gross NPA ratio has been increasing from FY12 onwards after declining in FY11.(Exhibit 1) With higher growth in NPAs and lower growth in bank advances growth, the ratio has tended to have an upward bias. Exhibit 1: Gross NPA ratio of all banks (%) Source: RBI 2.51 2.35 2.95 3.23 3.83 4.27 0.00 0.50 1.00 1.50 2.00 2.50 3.00 3.50 4.00 4.50 2010 2011 2012 2013 2014 2015
  • 3. Economics The NPA Story 3 Table 3: NPA ratios Bank Group-wise Year Public Private Foreign Total 2010 2.27 2.99 4.36 2.51 2011 2.31 2.48 2.61 2.35 2012 3.17 2.09 2.76 2.95 2013 3.61 1.77 3.04 3.23 2014 4.36 1.78 3.86 3.83 2015 4.96 2.10 3.20 4.27 Source: RBI Table 3 shows that the NPA ratio has been the highest for public sector banks followed by foreign banks. In case of PSBs it has been increasing continuously over the years while for the foreign banks it declined in FY12 and then rose till FY14 before declining in FY15. The private sector banks however, have witnessed declining trend till FY14 before increasing in FY15. Incremental NPAs Gross NPAs of the system have been increasing also in incremental terms i.e. additions to NPAs. The CAGR was 24.5% over the five-year period reflecting again difficult economic circumstances. Table 4 provides information on additions to gross NPAs for the last 5 years as well as new NPAs as a percentage of incremental advances. This ratio again has been increasing sharply in FY14 and FY15 reaching 30.5%. While admittedly these additions to NPAs are recognition for the past years and hence not strictly comparable with the incremental credit of the banking system, it still serves as a broad indicator of the movement of these two variables and the fact that it has been generally rising does flag a problem for the system. Further, such additions to NPAs do put pressure on banks in terms of making provisions as well as writing off sticky assets which affects the profitability of the system. Table 4: Additions to NPAs as % of incremental credit (%) March Additions Inc lending Ratio 2011 70,439 733,903 9.6 2012 97,519 652,826 14.9 2013 138,389 1,323,012 10.5 2014 189,722 903,928 21.0 2015 208,638 684,918 30.5 Source: RBI Bank action on NPAs Two aspects of NPAs which are important are the responses from banks in terms of write-offs and provisions which finally affect their balance sheets. Table 5 gives the total write-offs of all banks which have been increasing especially from FY14 onwards. In FY15 write-offs were at the peak at Rs 60,050 crore, which is 0.79% of total outstanding advances as of March 2015. However, write-offs were 26% of operating profits, which is quite significant.
  • 4. Economics The NPA Story 4 Table 5: Total write-offs of NPAs (Rs crore) Public Private Foreign Total 2010 2,897 4,072 2,948 9,917 2011 5,885 2,339 78 8,302 2012 2,348 3,262 4 5,614 2013 7,186 4,115 52 11,353 2014 30,834 6,541 1,339 38,714 2015 50,979 7,134 1,937 60,050 Source: RBI Table 6 below presents data on provisions made by banks for NPAs. Like write-offs they have been increasing continuously with a sharp gradient in FY14 and FY15. While the provisions were a high multiple of write-offs in the first 4 years, this has come down in the last two years indicating a combination of either more NPAs being written off or lower provisions being made keeping in mind the profit movement. Table 6: Provisions for NPAs (Rs crore) Public Private Foreign Total 2010 17,142 9,629 3,908 30,679 2011 25,956 5,084 538 31,578 2012 34,572 3,981 1,999 40,552 2013 43,063 5,474 1,048 49,585 2014 55,450 7,261 3,933 66,644 2015 67,752 9,962 2,069 79,783 Source: RBI The credit cost (defined as provisions to average outstanding advances in two years) has been concomitantly increasing from 0.87% in FY11 to 1.04% and 1.11% in the last 2 years respectively. The FY16 episode In FY16 the NPA scene has become even more serious over the quarters. Information however, is available for a sub-set of 39 Indian banks, 24 in the public sector and 15 in private. Table 6: NPAs in FY16 (Rs crore and ratio in %) Q4 FY15 Q1 FY16 Q2 FY16 Q3 FY16 Rs cr Ratio % Rs cr Ratio % Rs cr Ratio % Rs cr Ratio % Public Banks 269,124 5.1 285,748 5.5 303,678 5.8 527,246 9.2 Private Banks 32,379 2.0 34,805 2.2 36,716 2.2 44,813 2.7 All Banks 301,502 4.4 320,554 4.7 340,395 4.9 572,059 8.1 Source: ACE Equity database Average Gross NPAs across all banks increased from 4.4% in Q4-FY15 to 4.7% in Q1-FY16 to 4.9% in Q2-FY16 and 8.1% in Q3-FY16. As witnessed in the table, most of the increase in the NPAs can be attributed to the PSBs. It
  • 5. Economics The NPA Story 5 needs to be noted that out of the 24 PSBs banks, only 4 banks have gross NPAs below 5% in Q3-FY16. Two of them have had a ratio of above 10%, while 7 had between 8-10%. Although lower, NPAs of private banks have also increased from 2.0% in Q4-FY15 to 2.7% in Q3-FY16. Only two of them had ratios of above 5% and are old private banks. The higher NPA ratios for some PSBs for December quarter can be attributed to prudent recognition norms following the advice given by RBI as well as recognition of some restructured assets as non-performing as per the new guidelines besides absolute numbers increasing due to corporate stress. Economic slowdown, incorrect credit assessment, governance issues and wilful default are other reasons for this increase in NPAs. The NPAs according to the RBI are concentrated in sectors such as infrastructure, mining, textiles, steel and aviation which could still be under pressure given the direction of global commodity prices. Further the price movements in steel on account of the China factor would continue to exert pressure. How to reduce NPAs? NPAs normally have tended to move along with the economic cycle. Often loans given during good times stop performing when conditions turn adverse. The recent fall in commodity prices has affected several industries and those which are leveraged have had issues with debt servicing. The interest cover ratio has also been declining over the last few quarters. For a random sample of 2,454 manufacturing companies, the interest cover (defined as PBIT/interest) declined continuously from 3.78 in March 2015 to 3.70 in June, 3.20 in September and 2.70 in December. The following are some thoughts on reducing NPAs. 1. More stringent credit appraisal from the point of view of banks. Weak banks could pursue narrow banking until such time their books look better after capitalization. This process could also imply shrinking the balance sheets at times. 2. Better monitoring of assets, especially those with high value. There could be separate departments to address this issue. 3. Have in place early warning signals to flag such problems. This would be in the nature of picking up signals on policy or industry developments besides the regular financial indicators. 4. Better information dissemination on the NPAs especially on those who are wilful defaulters or have very large debt overhang. This can be useful for banks when sanctioning fresh loans. 5. Recognizing the same in a prudent manner and making provisions thereof. 6. Addressing governance issues in some banks that have high NPAs. 7. Asset reconstruction companies would need to run in parallel to takeover such assets. Creating a bad bank is an idea to be pursued in this respect. 8. The passing of the bankruptcy code would be very useful in addressing this issue. Assuming that these books are cleaned up by March 2016, a recovery in industrial prospects should help to lower the delinquency rates. The RBI had also noted in its draft guidelines on large exposures of banks that a certain segment should be migrated to the corporate debt market. Such a move will help to spread risk across sectors. Given that there will be an upward pressure on funding once the investment cycle recovers and infrastructure investment picks up, there will be the need to provide for the same through the financial system. Banks may not be able to fully accommodate this requirement and hence it may be expected that there would be a diversion to the bond market. The challenge however will still remain for the system to ensure that 1-5 mentioned above are assiduously followed to keep these numbers under check.
  • 6. Economics The NPA Story 6 Conclusions - NPAs are a serious issue which has gotten magnified after FY12 with the economic downturn. - A warning signal is when growth in NPAs exceeds that in credit on a continuous basis of 3-4 quarters - While there is concentration of NPAs in PSBs, the problem is generalized for all banks including those in the private sector and foreign banks. - When viewing NPAs it is also essential to look at additions to this stock as well as provisions made and write offs as they do affect the profit lines of banks. - Conditions could improve from FY17 onwards on account of the cleaning up operations of banks as per news received in Q3-FY16 as well as a turnaround in the economy. - There are several solutions to solving this issue of NPAs as noted earlier. However, to be effective, they must be used together from all fronts so that they are effective. Disclaimer This report is prepared by Credit Analysis &Research Limited (CARE Ratings). CARE Ratings has taken utmost care to ensure accuracy and objectivity while developing this report based on information available in public domain. However, neither the accuracy nor completeness of information contained in this report is guaranteed. CARE Ratings is not responsible for any errors or omissions in analysis/inferences/views or for results obtained from the use of information contained in this report and especially states that CARE Ratings has no financial liability whatsoever to the user of this report. Contact: Madan Sabnavis Anuja Shah Chief Economist Economist madan.sabnavis@careratings.com anuja.shah@careratings.com 91-022-67543489 91-022-6754 3568