Energy & Commodities, No.7 - August 19, 2011
•
0 j'aime•239 vues

Energy & Commodities, No.7 - August 19, 2011: Commodities prices fall as global growth slows

Recommandé
Recommandé
Contenu connexe
Tendances
Tendances (20)
En vedette
En vedette (7)
Similaire à Energy & Commodities, No.7 - August 19, 2011
Similaire à Energy & Commodities, No.7 - August 19, 2011 (20)
Plus de Swedbank
Plus de Swedbank (20)
Dernier
Dernier (20)
Energy & Commodities, No.7 - August 19, 2011
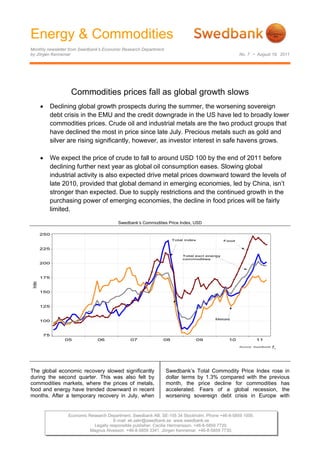
- 1. Energy & Commodities Monthly newsletter from Swedbank’s Economic Research Department by Jörgen Kennemar No. 7 • August 19, 2011 Commodities prices fall as global growth slows Declining global growth prospects during the summer, the worsening sovereign debt crisis in the EMU and the credit downgrade in the US have led to broadly lower commodities prices. Crude oil and industrial metals are the two product groups that have declined the most in price since late July. Precious metals such as gold and silver are rising significantly, however, as investor interest in safe havens grows. We expect the price of crude to fall to around USD 100 by the end of 2011 before declining further next year as global oil consumption eases. Slowing global industrial activity is also expected drive metal prices downward toward the levels of late 2010, provided that global demand in emerging economies, led by China, isn’t stronger than expected. Due to supply restrictions and the continued growth in the purchasing power of emerging economies, the decline in food prices will be fairly limited. Swedbank’s Commodities Price Index, USD r, The global economic recovery slowed significantly Swedbank’s Total Commodity Price Index rose in during the second quarter. This was also felt by dollar terms by 1.3% compared with the previous commodities markets, where the prices of metals, month, the price decline for commodities has food and energy have trended downward in recent accelerated. Fears of a global recession, the months. After a temporary recovery in July, when worsening sovereign debt crisis in Europe with Economic Research Department. Swedbank AB. SE-105 34 Stockholm. Phone +46-8-5859 1000. E-mail: ek.sekr@swedbank.se www.swedbank.se Legally responsible publisher: Cecilia Hermansson. +46-8-5859 7720. Magnus Alvesson. +46-8-5859 3341. Jörgen Kennemar. +46-8-5859 7730.
- 2. Energy & Commodities Monthly newsletter from Swedbank’s Economic Research Department, continued No. 7 • August 19, 2011 adverse consequences for financial markets, and In its most recent forecast, the International Energy the credit downgrade in the US caused Agency, IEA, projected that global oil consumption considerable turbulence in the global financial will rise by 1.8% in 2012 to just over 91 million markets in early August. Due to an increased risk barrels a day, based on an increase in global aversion among financial investors, investment growth of nearly 4.5%. Our prediction of weaker capital is seeking out safe havens such as global growth suggests a slower rise in oil government bonds or gold. The financial markets’ consumption, however, and thus lower crude revised risk assessment has therefore pushed long- prices. We anticipate an average oil price of USD term bond yields lower at the same time that the 97 in 2012, which is a downward revision from USD price of gold is reaching record levels in USD. 103 dollar last spring. A weaker global economy will probably reduce pressure on OPEC members to The largest price declines between July and August boost production volume, provided that the global were among energy commodities. The price of economy does not deteriorate significantly. crude oil has fallen from USD 119 to USD 108 dollar, or by just over 10%. At the same time supply Industrial metals prices in USD, 2008=100 conditions in the oil market have improved thanks to Saudi Arabia's increased production, which is compensating for the loss of production in Libya. Access to oil also increased following the decision to reduce the strategic oil reserves in June. The major increase in oil prices in early 2011 was probably driven more by speculation about a potential lack of access due to geopolitical developments in the Middle East than fundamental reasons. Although some of the factors that are driving supply still apply, concerns about the economy's future have had a greater impact on prices. We anticipate that oil will continue to fall during the second half of the year owing to current economic uncertainty. Because of the major increase in oil prices in early 2011, the average price for the year will still be higher than we Economically sensitive industrial metals noted projected last spring. We have therefore revised our declining prices and growing inventories back in the full-year forecast upward from USD 105 in April to spring and early summer, in line with weakening USD 110. global industrial activity. The rise in metal prices in July, as indicated by Swedbank’s metal price index, Commodity price trend since June 2011 was probably temporary, especially since underlying growth indicators for industry remain weak. For example, the purchasing managers indexes in most economies reached their lowest levels since fall 2009. In August the price drop accelerated, with nickel, zinc and lead noting the largest declines. Although the price of copper has fallen, the current level is still over 20% higher than a year ago. Our forecast of weaker global growth in the year ahead, especially among advanced industrial countries, will reduce demand for metals and other input goods. Emerging economies will continue to account for a large share of global growth, but are expected to grow at a slower rate in the next 12-18 months, not least due to the austerity measures that governments have taken to mitigate the risk of overheating. Capacity shortages, strikes and rising production costs are all factors that could counteract the price decline for metals, however. 2 (5)
- 3. Energy & Commodities Monthly newsletter from Swedbank’s Economic Research Department, continued No. 7 • August 19, 2011 Forecasts of higher global production have Industrial metal and gold prices compared with global stock index (MSCI) contributed to lower food prices following last year’s substantial increase. The price index in USD has fallen by 8-10% since January, but is still at higher levels than during the global food crisis in 2008 regardless of exchange rates. The food commodities market is still faced with small inventory levels, which means that disruptions to production could have major implications for food prices. At the same time global demand is on the rise, not least from population-dense regions of Asia, where purchasing power is growing and consumption patterns are changing. Although the economic slowdown and higher food production are expected to continue to keep pressure on prices going forward, it is not until 2012 that we anticipate lower average prices. Agricultural commodities are also impacted when We expect that the current economic uncertainty demand slows. This is especially true of cotton, and worsening debt crisis in the EMU countries and which noted a significant price correction in June the US will force central banks to delay raising and July, dropping by nearly half from March due to interest rates. An increased risk aversion and lower Chinese cotton imports. For the textiles diversification toward larger gold holdings suggest industry, lower cotton prices can mean lower that the price of gold will continue to rise in the production costs. Pulp prices continue to rise in quarters ahead. It is not unlikely, therefore, that USD, however. Knowing the cyclical nature of pulp gold could reach USD 2 000 per ounce by the end prices, there is an increased risk that a weaker of 2012. At the time of writing it was trading at growth outlook will put increased pressure on pulp slightly over USD 1 750, an increase of nearly 30% going forward. since the start of the year. Silver has also trended higher, but is not yet at the same levels as in April, when it reached a record high USD 48 per ounce. A lower risk of recession and more effective economic policies in both the US and the EMU area to resolve the debt crisis and budget consolidation could stop the rise in the price of gold. 3 (5)
- 4. Energy & Commodities Monthly newsletter from Swedbank’s Economic Research Department, continued No. 7 • August 19, 2011 Swedbank Commodity Index - US$ - Swedbank Commodity Index - SKr - Basis 2000 = 1oo 19-08-11 Basis 2000 = 1oo 19-08-11 5.2011 6.2011 7.2011 5.2011 6.2011 7.2011 T otal index 367.5 360.3 365.0 T otal index 249.6 247.9 253.1 Per cent change month ago -5.6 -2.0 1.3 Per cent change month ago -4.9 -0.7 2.1 Per cent change year ago 39.6 38.6 37.8 Per cent change year ago 13.5 11.9 18.7 T otal index exclusive energy 324.1 321.3 319.0 T otal index exclusive energy 220.2 221.1 221.2 Per cent change month ago -2.6 -0.9 -0.7 Per cent change month ago -1.8 0.4 0.1 Per cent change year ago 33.6 34.3 24.5 Per cent change year ago 8.6 8.4 7.2 Food, tropical beverages 314.5 305.6 294.6 Food, tropical beverages 213.7 210.3 204.3 Per cent change month ago -1.7 -2.8 -3.6 Per cent change month ago -0.9 -1.6 -2.8 Per cent change year ago 53.8 43.9 30.5 Per cent change year ago 25.0 16.2 12.4 Cereals 300.5 296.5 301.2 Cereals 204.1 204.0 208.9 Per cent change month ago -3.2 -1.3 1.6 Per cent change month ago -2.4 -0.1 2.4 Per cent change year ago 66.2 70.1 55.7 Per cent change year ago 35.1 37.3 34.1 T ropical beverages and tobacco 342.3 329.0 309.3 T ropical beverages and tobacco 232.5 226.4 214.5 Per cent change month ago -1.9 -3.9 -6.0 Per cent change month ago -1.2 -2.7 -5.2 Per cent change year ago 55.7 39.9 24.2 Per cent change year ago 26.6 13.0 7.0 Coffee 227.3 214.4 209.7 Coffee 154.4 147.5 145.4 Per cent change month ago -1.1 -5.7 -2.2 Per cent change month ago -0.3 -4.5 -1.4 Per cent change year ago 77.3 50.8 36.7 Per cent change year ago 44.1 21.7 17.7 Oilseeds and oil 263.7 261.0 258.5 Oilseeds and oil 179.1 179.6 179.3 Per cent change month ago 0.2 -1.0 -1.0 Per cent change month ago 1.0 0.2 -0.2 Per cent change year ago 41.1 38.7 31.4 Per cent change year ago 14.7 12.0 13.1 Industrial raw materials 326.9 325.8 326.0 Industrial raw materials 222.1 224.2 226.1 Per cent change month ago -2.9 -0.3 0.1 Per cent change month ago -2.1 1.0 0.8 Per cent change year ago 28.9 31.9 23.0 Per cent change year ago 4.8 6.5 5.9 Agricultural raw materials 204.5 206.3 202.9 Agricultural raw materials 138.9 141.9 140.7 Per cent change month ago -2.6 0.9 -1.6 Per cent change month ago -1.8 2.2 -0.9 Per cent change year ago 24.8 26.3 21.6 Per cent change year ago 1.4 1.9 4.7 Cotton 152.4 155.8 107.3 Cotton 103.5 107.2 74.4 Per cent change month ago -21.1 2.2 -31.1 Per cent change month ago -20.5 3.5 -30.6 Per cent change year ago 87.2 91.4 35.8 Per cent change year ago 52.2 54.5 16.9 Softwood 154.8 155.7 154.8 Softwood 105.2 107.1 107.4 Per cent change month ago 2.0 0.6 -0.6 Per cent change month ago 2.9 1.9 0.2 Per cent change year ago 6.8 8.0 3.8 Per cent change year ago -13.2 -12.8 -10.6 W oodpulp 1009.4 1018.4 1017.6 W oodpulp 685.7 700.7 705.7 Per cent change month ago 1.7 0.9 -0.1 Per cent change month ago 2.5 2.2 0.7 Per cent change year ago 6.7 5.1 4.0 Per cent change year ago -13.3 -15.2 -10.5 Non-ferrous metals 287.4 283.0 290.6 Non-ferrous metals 195.2 194.7 201.5 Per cent change month ago -4.8 -1.5 2.7 Per cent change month ago -4.1 -0.3 3.5 Per cent change year ago 29.2 36.3 35.3 Per cent change year ago 5.0 10.0 16.5 Copper 8956.8 9053.0 9618.8 Copper 6084.8 6228.9 6670.4 Per cent change month ago -5.5 1.1 6.2 Per cent change month ago -4.7 2.4 7.1 Per cent change year ago 30.5 39.3 42.8 Per cent change year ago 6.1 12.5 23.0 Aluminium 2592.2 2555.4 2512.0 Aluminium 1761.0 1758.2 1742.0 Per cent change month ago -2.6 -1.4 -1.7 Per cent change month ago -1.9 -0.2 -0.9 Per cent change year ago 26.7 32.3 26.4 Per cent change year ago 3.0 6.8 8.8 Lead 2430.2 2516.3 2682.0 Lead 1651.0 1731.3 1859.9 Per cent change month ago -11.0 3.5 6.6 Per cent change month ago -10.3 4.9 7.4 Per cent change year ago 28.4 47.7 46.0 Per cent change year ago 4.3 19.3 25.7 Z inc 2166.6 2230.5 2390.0 Z inc 1471.9 1534.7 1657.4 Per cent change month ago -8.4 2.9 7.2 Per cent change month ago -7.6 4.3 8.0 Per cent change year ago 9.5 28.0 29.7 Per cent change year ago -11.0 3.4 11.6 Nickel 24266.4 22324.0 23726.3 Nickel 16485.3 15359.9 16453.7 Per cent change month ago -7.9 -8.0 6.3 Per cent change month ago -7.1 -6.8 7.1 Per cent change year ago 9.5 15.2 21.6 Per cent change year ago -11.0 -7.0 4.7 Iron ore, steel scrap 750.9 752.0 740.3 Iron ore, steel scrap 510.1 517.4 513.4 Per cent change month ago -0.9 0.1 -1.6 Per cent change month ago -0.1 1.4 -0.8 Per cent change year ago 31.5 31.6 12.5 Per cent change year ago 6.9 6.2 -3.1 Energy raw materials 386.7 377.6 385.4 Energy raw materials 262.7 259.8 267.3 Per cent change month ago -6.7 -2.4 2.1 Per cent change month ago -6.0 -1.1 2.9 Per cent change year ago 42.0 40.4 43.5 Per cent change year ago 15.4 13.3 23.5 Coking coal 459.1 458.7 459.8 Coking coal 311.9 315.6 318.9 Per cent change month ago -2.6 -0.1 0.2 Per cent change month ago -1.8 1.2 1.0 Per cent change year ago 21.6 23.2 26.8 Per cent change year ago -1.1 -0.5 9.2 Crude oil 383.4 373.9 382.0 Crude oil 260.5 257.3 264.9 Per cent change month ago -6.9 -2.5 2.2 Per cent change month ago -6.2 -1.2 3.0 Per cent change year ago 43.3 41.5 44.5 Per cent change year ago 16.4 14.2 24.4 Source : SW EDBAN K and HW W A-Institute for Economic R esearch H amburg Source : SW EDBAN K and HW W A-Institute for Economic R esearch Hamburg Swedbank Economic Research Department Swedbank’s monthly Energy & Commodities newsletter is published as a service to our customers. We believe that we have used reliable sources and methods in the preparation SE-105 34 Stockholm, Sweden of the analyses reported in this publication. However, we cannot guarantee the accuracy or Phone +46-8-5859 7740 completeness of the report and cannot be held responsible for any error or omission in the ek.sekr@swedbank.se underlying material or its use. Readers are encouraged to base any (investment) decisions www.swedbank.se on other material as well. Neither Swedbank nor its employees may be held responsible for Legally responsible publisher losses or damages, direct or indirect, owing to any errors or omissions in Swedbank’s Cecilia Hermansson, +46-88-5859 7720 monthly Energy & Commodities newsletter. Magnus Alvesson, +46-8-5859 3341 Jörgen Kennemar, +46-8-5859 7730 4 (5)