TATA Power-DDL Utility Connect (Issue 02)
•
1 like•408 views

The Second Issue of Utility Connect Talks about the KPI e-Tracker of Tata Power-DDL.

Recommended
Recommended
More Related Content
What's hot
What's hot (20)
Similar to TATA Power-DDL Utility Connect (Issue 02)
Similar to TATA Power-DDL Utility Connect (Issue 02) (20)
More from Tata Power Delhi Distribution Limited
More from Tata Power Delhi Distribution Limited (20)
Recently uploaded
Recently uploaded (20)
TATA Power-DDL Utility Connect (Issue 02)
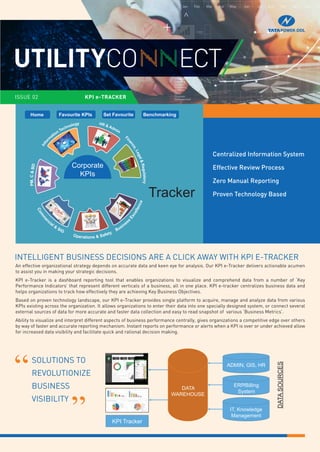
- 1. For Further Information: Tarun Katiyar Head - Business Development Mobile No.: +91 9818100744 Phone: 011 66112246 Fax: 011 27468042 E-mail: tarun.katiyar@tatapower-ddl.com Address: NDPL House, Hudson Lines, Kingsway Camp, Delhi-110 009 CIN No.: U40109DL2001PLC111526 https://in.linkedin.com/company/tatapower-ddl https://www.facebook.com/TataPower.DDL/ https://www.youtube.com/c/TataPowerDelhi- DistributionLimited www.tatapower-ddl.com UTILITYCO ECT ISSUE 01 METER DATA ANALYTICS UTILITYCO ECT ISSUE 02 KPI e-TRACKER Tata Power-DDL & Confederation of Indian Industry (CII) have signed a Memorandum of Understanding to work jointly towards designing innovative energy efficiency solutions for the Indian Industrial Sector. The purpose of the MoU is to work jointly towards achievement of goals under the National Mission on ‘Enhanced Energy Efficiency (NMEEE)’ program which is one of the eight national missions under the National Action Plan on Climate Change (NAPCC). The MoU paves the way for knowledge transfer, information & experience sharing, technical cooperation between the parties in the field of Energy Efficiency & Demand Side Management. TATA POWER-DDL launches India’s first artificial intelligence ‘Choice Revenue Intelligence’ Solution Tata Power-DDL launched artificial intelligence solution for Indian Discoms to make their operations smarter. The solution- ‘Choice Revenue Intelligence’ is a first time in India & Tata Power-DDL is the exclusive country partner and system integrator of the predictive analytics software solution for Indian Discoms. Mr. Praveer Sinha then CEO & MD, Tata Power-DDL; Denis Maia, CEO, Choice Technologies; Stefan Engelhardt, VP, SAP Germany & Reji Pillai, President, ISGF launched the solution to help more than 18 states in their loss reduction initiatives. POWERTALK @ TATA POWER-DDL Tata Power-DDL conferred with ‘Rooftop Solar Enabler of the Year –Utility’ Award Memorandum of Understanding with CII Tata Power-DDL has been awarded with the prestigious ‘Rooftop Solar Enabler of the Year-Utility’ Award 2018 at the 3rd Annual Indian Rooftop Solar Congress 2018 organized by Solar Quarter. The award was handed over by Dr. Ketan Shukla, Joint Secretary, Ministry of Foreign Affairs & Sh. O.P. Mishra, Additional Secretary, Government of Delhi. An effective organizational strategy depends on accurate data and keen eye for analysis. Our KPI e-Tracker delivers actionable acumen to assist you in making your strategic decisions. KPI e-Tracker is a dashboard reporting tool that enables organizations to visualize and comprehend data from a number of ‘Key Performance Indicators’ that represent different verticals of a business, all in one place. KPI e-tracker centralizes business data and helps organizations to track how effectively they are achieving Key Business Objectives. Based on proven technology landscape, our KPI e-Tracker provides single platform to acquire, manage and analyze data from various KPIs existing across the organization. It allows organizations to enter their data into one specially designed system, or connect several external sources of data for more accurate and faster data collection and easy to read snapshot of various ‘Business Metrics’. Ability to visualize and interpret different aspects of business performance centrally, gives organizations a competitive edge over others by way of faster and accurate reporting mechanism. Instant reports on performance or alerts when a KPI is over or under achieved allow for increased data visibility and facilitate quick and rational decision making. INTELLIGENT BUSINESS DECISIONS ARE A CLICK AWAY WITH KPI E-TRACKER Centralized Information System Effective Review Process Zero Manual Reporting Proven Technology BasedTracker Home Favourite KPIs Set Favourite Benchmarking Corporate KPIs PM,C&BD Infor m ation Technology HR & Admin Fi nance,Legal&Regulatory Com m er cial & SIG Operations & Safety Busines s Excellence DATASOURCES ADMIN, GIS, HR ERP/Billing System IT, Knowledge Management DATA WAREHOUSE KPI Tracker SOLUTIONS TO REVOLUTIONIZE BUSINESS VISIBILITY
- 2. UTILITY CONNECT Issue 02 Enhance Performance by glancing through Key Results Depending upon the area to be tracked, there are a number of KPIs that have been developed in KPI e-Tracker. These may be categorized as under: OPERATIONAL & SAFETY KPIs Operational Complaints/1000 Consumers, Performance Assurance Compliance, SAIDI, SAIFI, PADCI, Repeat No Current Complaints, Safety Observations, Unauthorized construction notices, Accident Free Days, INVENTORY KPIs Inventory Status, Non Moving/Slow Moving Inventory IT KPIs Server Downtime, WAN Up Time, Cyber Security, Downtime of Communication Network, IT Helpdesk % Compliance to SLA HUMAN RESOURCE AND ADMINISTRATION KPIs Manpower Statistics, Average Age, Attrition, Rewards & Recognitions, Customer Served /Employee, Transfers, Employee Grievances FINANCE / LEGAL / REGULATORY KPIs Revenue, PAT, Regulatory Asset, O&M Expenses, Interest rate, Debt Equity Ratio, Capitalization POWER MANAGEMENT KPIs ADSM Charges, Power Purchase Cost, Power Sale Rate COMMERCIAL KPIs AT&C Losses, Billing/Collection Efficiency, Average Billing Rate, Commercial Complaints/1000 Consumers, Energy Input, Provisional Billing, Live Arrears Dashboard Benefits Visibility into Business: Stay updated about what is going on in the business. Strategic decisions may be taken accordingly to improvise upon the business results. No More Manual Reporting: The dashboard eliminates the need for spending time in creating reports in Excel or other spreadsheet programs saving a lot of time and energy of employees and excluding any possibility of manual errors. Improved Results: As the saying goes, “Anything that is measured and watched, improves”, our dashboard enables DISCOMs to take stock of various Performance Indicators allowing them to take necessary actions to improve them. 50.18 64.71 75.20 113.31 40.36 47.32 48.01 76.57 0 50 100 150 FY-15 FY-16 Fy-17 FY-18 Inventory (In Cr.) TOTAL KPM 438 416 499 862 1,014 436 0 500 1,000 1,500 18-25 25-30 30-35 35-45 45-55 >55 Manpower (Age Group Wise) 46.06 46.06 43.05 23.71 27.06 26.66 33.41 32.65 0 20 40 60 2014-15 2015-16 2016-17 207-18 SAIDI (Hrs) Actual Target 14.87 15.86 20.11 15.12 14.49 0 5 10 15 20 25 CITY METRO SUB TOWN URBAN % AT&C Loss - Circle Wise Oct 2017-18 10.02 11.19 11.42 11.45 12.41 0 5 10 15 561 1301 501+520 522 571 AT&C Loss - Top 5 Zones/Sub Divisions Oct 2017-18 17.37 18.19 23.44 38.04 0 10 20 30 40 2014-15 2015-16 2016-17 2017-18 Company Level - No Current Complaints per 1000 Customers 2017-18: Call 3804 53.53 66.15 50.67 30.86 28.69 27.56 31.64 33.32 0 25 50 75 2014-15 2015-16 2016-17 2017-18 SAIFI (Nos) Actual Target 99.29 99.30 99.61 99.52 0 25 50 75 100 2014-15 2015-16 2016-17 2017-18 Company Level - Performance Assurance Compliance 557.68 239.42 210.63 150.00 0 250 500 750 FY-15 FY-16 Fy-17 FY-18 ADSM (Additional Deviation Charges) Amount (In Lacs) Target (In Lacs) 14 29 8 19 0 10 20 30 Hardware Maintenance Software Maintenance Hardware Software - Server Down Time Target (Hrs) Actual (Hrs) 261.27 148.67 105.19 326.89 158.51 162.54 0 50 100 150 200 250 300 350 FY-17 Sep FY-17 Sep FY-18 Profit After Tax (YTM Rs. Cr.) Actual Target Amount(Rs.Cr.) 148.67 105.19 158.51 162.54 0 50 100 150 200 Sep FY-17 Sep FY-18 Profit After Tax (YTM Rs. Cr.) Actual Target Amount(Rs.Cr.) Figures shown in the graphs are illustrative only. 9.87 8.88 8.59 8.02 0 50 100 0 5 10 2014-15 90.41 91.23 91.38 92.15 2015-16 2016-17 2017-18 AT&C Loss & Billing Effificency (%) Billing Efficiency AT&C Loss Accident Free days Tata Power - DDL Distribution 6 System 1,546 EHV Projects 2,151 Commercial 192 Stores & CSL 2,029 Admin & HR 501 City Circle 561 Town Circle 6 Metro Circle 481 Urban Circle 60 Sub Urban 1,338 Distribution Projects 83 Associated Groups 443 0 200 500 600 100 400 300
- 3. UTILITY CONNECT Issue 02 Enhance Performance by glancing through Key Results Depending upon the area to be tracked, there are a number of KPIs that have been developed in KPI e-Tracker. These may be categorized as under: OPERATIONAL & SAFETY KPIs Operational Complaints/1000 Consumers, Performance Assurance Compliance, SAIDI, SAIFI, PADCI, Repeat No Current Complaints, Safety Observations, Unauthorized construction notices, Accident Free Days, INVENTORY KPIs Inventory Status, Non Moving/Slow Moving Inventory IT KPIs Server Downtime, WAN Up Time, Cyber Security, Downtime of Communication Network, IT Helpdesk % Compliance to SLA HUMAN RESOURCE AND ADMINISTRATION KPIs Manpower Statistics, Average Age, Attrition, Rewards & Recognitions, Customer Served /Employee, Transfers, Employee Grievances FINANCE / LEGAL / REGULATORY KPIs Revenue, PAT, Regulatory Asset, O&M Expenses, Interest rate, Debt Equity Ratio, Capitalization POWER MANAGEMENT KPIs ADSM Charges, Power Purchase Cost, Power Sale Rate COMMERCIAL KPIs AT&C Losses, Billing/Collection Efficiency, Average Billing Rate, Commercial Complaints/1000 Consumers, Energy Input, Provisional Billing, Live Arrears Dashboard Benefits Visibility into Business: Stay updated about what is going on in the business. Strategic decisions may be taken accordingly to improvise upon the business results. No More Manual Reporting: The dashboard eliminates the need for spending time in creating reports in Excel or other spreadsheet programs saving a lot of time and energy of employees and excluding any possibility of manual errors. Improved Results: As the saying goes, “Anything that is measured and watched, improves”, our dashboard enables DISCOMs to take stock of various Performance Indicators allowing them to take necessary actions to improve them. 50.18 64.71 75.20 113.31 40.36 47.32 48.01 76.57 0 50 100 150 FY-15 FY-16 Fy-17 FY-18 Inventory (In Cr.) TOTAL KPM 438 416 499 862 1,014 436 0 500 1,000 1,500 18-25 25-30 30-35 35-45 45-55 >55 Manpower (Age Group Wise) 46.06 46.06 43.05 23.71 27.06 26.66 33.41 32.65 0 20 40 60 2014-15 2015-16 2016-17 207-18 SAIDI (Hrs) Actual Target 14.87 15.86 20.11 15.12 14.49 0 5 10 15 20 25 CITY METRO SUB TOWN URBAN % AT&C Loss - Circle Wise Oct 2017-18 10.02 11.19 11.42 11.45 12.41 0 5 10 15 561 1301 501+520 522 571 AT&C Loss - Top 5 Zones/Sub Divisions Oct 2017-18 17.37 18.19 23.44 38.04 0 10 20 30 40 2014-15 2015-16 2016-17 2017-18 Company Level - No Current Complaints per 1000 Customers 2017-18: Call 3804 53.53 66.15 50.67 30.86 28.69 27.56 31.64 33.32 0 25 50 75 2014-15 2015-16 2016-17 2017-18 SAIFI (Nos) Actual Target 99.29 99.30 99.61 99.52 0 25 50 75 100 2014-15 2015-16 2016-17 2017-18 Company Level - Performance Assurance Compliance 557.68 239.42 210.63 150.00 0 250 500 750 FY-15 FY-16 Fy-17 FY-18 ADSM (Additional Deviation Charges) Amount (In Lacs) Target (In Lacs) 14 29 8 19 0 10 20 30 Hardware Maintenance Software Maintenance Hardware Software - Server Down Time Target (Hrs) Actual (Hrs) 261.27 148.67 105.19 326.89 158.51 162.54 0 50 100 150 200 250 300 350 FY-17 Sep FY-17 Sep FY-18 Profit After Tax (YTM Rs. Cr.) Actual Target Amount(Rs.Cr.) 148.67 105.19 158.51 162.54 0 50 100 150 200 Sep FY-17 Sep FY-18 Profit After Tax (YTM Rs. Cr.) Actual Target Amount(Rs.Cr.) Figures shown in the graphs are illustrative only. 9.87 8.88 8.59 8.02 0 50 100 0 5 10 2014-15 90.41 91.23 91.38 92.15 2015-16 2016-17 2017-18 AT&C Loss & Billing Effificency (%) Billing Efficiency AT&C Loss Accident Free days Tata Power - DDL Distribution 6 System 1,546 EHV Projects 2,151 Commercial 192 Stores & CSL 2,029 Admin & HR 501 City Circle 561 Town Circle 6 Metro Circle 481 Urban Circle 60 Sub Urban 1,338 Distribution Projects 83 Associated Groups 443 0 200 500 600 100 400 300
- 4. For Further Information: Tarun Katiyar Head - Business Development Mobile No.: +91 9818100744 Phone: 011 66112246 Fax: 011 27468042 E-mail: tarun.katiyar@tatapower-ddl.com Address: NDPL House, Hudson Lines, Kingsway Camp, Delhi-110 009 CIN No.: U40109DL2001PLC111526 https://in.linkedin.com/company/tatapower-ddl https://www.facebook.com/TataPower.DDL/ https://www.youtube.com/c/TataPowerDelhi- DistributionLimited www.tatapower-ddl.com UTILITYCO ECT ISSUE 01 METER DATA ANALYTICS UTILITYCO ECT ISSUE 02 KPI e-TRACKER Tata Power-DDL & Confederation of Indian Industry (CII) have signed a Memorandum of Understanding to work jointly towards designing innovative energy efficiency solutions for the Indian Industrial Sector. The purpose of the MoU is to work jointly towards achievement of goals under the National Mission on ‘Enhanced Energy Efficiency (NMEEE)’ program which is one of the eight national missions under the National Action Plan on Climate Change (NAPCC). The MoU paves the way for knowledge transfer, information & experience sharing, technical cooperation between the parties in the field of Energy Efficiency & Demand Side Management. TATA POWER-DDL launches India’s first artificial intelligence ‘Choice Revenue Intelligence’ Solution Tata Power-DDL launched artificial intelligence solution for Indian Discoms to make their operations smarter. The solution- ‘Choice Revenue Intelligence’ is a first time in India & Tata Power-DDL is the exclusive country partner and system integrator of the predictive analytics software solution for Indian Discoms. Mr. Praveer Sinha then CEO & MD, Tata Power-DDL; Denis Maia, CEO, Choice Technologies; Stefan Engelhardt, VP, SAP Germany & Reji Pillai, President, ISGF launched the solution to help more than 18 states in their loss reduction initiatives. POWERTALK @ TATA POWER-DDL Tata Power-DDL conferred with ‘Rooftop Solar Enabler of the Year –Utility’ Award Memorandum of Understanding with CII Tata Power-DDL has been awarded with the prestigious ‘Rooftop Solar Enabler of the Year-Utility’ Award 2018 at the 3rd Annual Indian Rooftop Solar Congress 2018 organized by Solar Quarter. The award was handed over by Dr. Ketan Shukla, Joint Secretary, Ministry of Foreign Affairs & Sh. O.P. Mishra, Additional Secretary, Government of Delhi. An effective organizational strategy depends on accurate data and keen eye for analysis. Our KPI e-Tracker delivers actionable acumen to assist you in making your strategic decisions. KPI e-Tracker is a dashboard reporting tool that enables organizations to visualize and comprehend data from a number of ‘Key Performance Indicators’ that represent different verticals of a business, all in one place. KPI e-tracker centralizes business data and helps organizations to track how effectively they are achieving Key Business Objectives. Based on proven technology landscape, our KPI e-Tracker provides single platform to acquire, manage and analyze data from various KPIs existing across the organization. It allows organizations to enter their data into one specially designed system, or connect several external sources of data for more accurate and faster data collection and easy to read snapshot of various ‘Business Metrics’. Ability to visualize and interpret different aspects of business performance centrally, gives organizations a competitive edge over others by way of faster and accurate reporting mechanism. Instant reports on performance or alerts when a KPI is over or under achieved allow for increased data visibility and facilitate quick and rational decision making. INTELLIGENT BUSINESS DECISIONS ARE A CLICK AWAY WITH KPI E-TRACKER Centralized Information System Effective Review Process Zero Manual Reporting Proven Technology BasedTracker Home Favourite KPIs Set Favourite Benchmarking Corporate KPIs PM,C&BD Infor m ation Technology HR & Admin Fi nance,Legal&Regulatory Com m er cial & SIG Operations & Safety Busines s Excellence DATASOURCES ADMIN, GIS, HR ERP/Billing System IT, Knowledge Management DATA WAREHOUSE KPI Tracker SOLUTIONS TO REVOLUTIONIZE BUSINESS VISIBILITY